2010 Sustainable Streets Index - NYC.gov
2010 Sustainable Streets Index - NYC.gov
2010 Sustainable Streets Index - NYC.gov

Create successful ePaper yourself
Turn your PDF publications into a flip-book with our unique Google optimized e-Paper software.
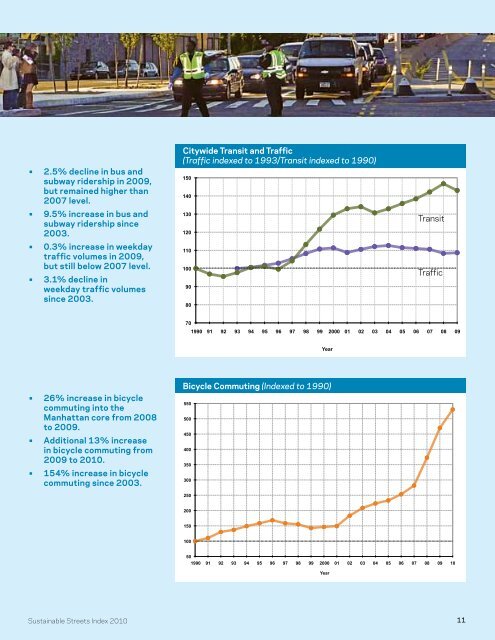
• 2.5% decline in bus and<br />
subway ridership in 2009,<br />
but remained higher than<br />
2007 level.<br />
• 9.5% increase in bus and<br />
subway ridership since<br />
2003.<br />
• 0.3% increase in weekday<br />
traffic volumes in 2009,<br />
but still below 2007 level.<br />
• 3.1% decline in<br />
weekday traffic volumes<br />
since 2003.<br />
Citywide Transit and Traffic<br />
(Traffic indexed to 1993/Transit indexed to 1990)<br />
150<br />
140<br />
130<br />
120<br />
110<br />
100<br />
90<br />
80<br />
Citywide Traffic and Transit<br />
Transit<br />
Traffic<br />
70<br />
1990 91 92 93 94 95 96 97 98 99 2000 01 02 03 04 05 06 07 08 09<br />
Year<br />
• 26% increase in bicycle<br />
commuting into the<br />
Manhattan core from 2008<br />
to 2009.<br />
• Additional 13% increase<br />
in bicycle commuting from<br />
2009 to <strong>2010</strong>.<br />
• 154% increase in bicycle<br />
commuting since 2003.<br />
Bicycle Commuting (<strong>Index</strong>ed to 1990)<br />
550<br />
500<br />
450<br />
400<br />
350<br />
300<br />
Bicycle Commuting (<strong>Index</strong>ed to 1990)<br />
250<br />
200<br />
150<br />
100<br />
50<br />
1990 91 92 93 94 95 96 97 98 99 2000 01 02 03 04 05 06 07 08 09 10<br />
Year<br />
<strong>Sustainable</strong> <strong>Streets</strong> <strong>Index</strong> <strong>2010</strong><br />
11