2010 Sustainable Streets Index - NYC.gov
2010 Sustainable Streets Index - NYC.gov
2010 Sustainable Streets Index - NYC.gov

Create successful ePaper yourself
Turn your PDF publications into a flip-book with our unique Google optimized e-Paper software.
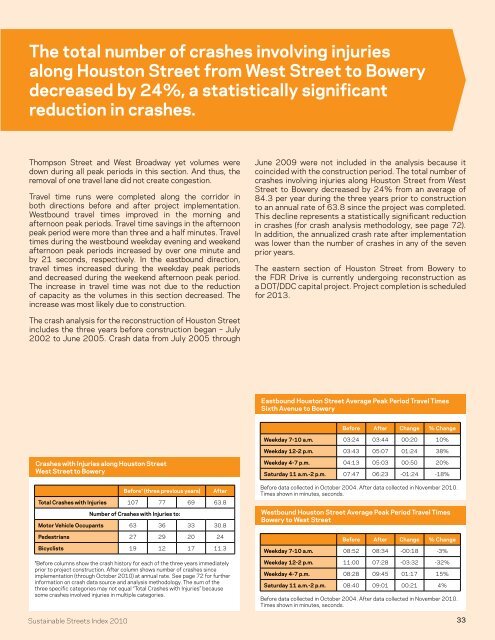
The total number of crashes involving injuries<br />
along Houston Street from West Street to Bowery<br />
decreased by 24%, a statistically significant<br />
reduction in crashes.<br />
Thompson Street and West Broadway yet volumes were<br />
down during all peak periods in this section. And thus, the<br />
removal of one travel lane did not create congestion.<br />
Travel time runs were completed along the corridor in<br />
both directions before and after project implementation.<br />
Westbound travel times improved in the morning and<br />
afternoon peak periods. Travel time savings in the afternoon<br />
peak period were more than three and a half minutes. Travel<br />
times during the westbound weekday evening and weekend<br />
afternoon peak periods increased by over one minute and<br />
by 21 seconds, respectively. In the eastbound direction,<br />
travel times increased during the weekday peak periods<br />
and decreased during the weekend afternoon peak period.<br />
The increase in travel time was not due to the reduction<br />
of capacity as the volumes in this section decreased. The<br />
increase was most likely due to construction.<br />
June 2009 were not included in the analysis because it<br />
coincided with the construction period. The total number of<br />
crashes involving injuries along Houston Street from West<br />
Street to Bowery decreased by 24% from an average of<br />
84.3 per year during the three years prior to construction<br />
to an annual rate of 63.8 since the project was completed.<br />
This decline represents a statistically significant reduction<br />
in crashes (for crash analysis methodology, see page 72).<br />
In addition, the annualized crash rate after implementation<br />
was lower than the number of crashes in any of the seven<br />
prior years.<br />
The eastern section of Houston Street from Bowery to<br />
the FDR Drive is currently undergoing reconstruction as<br />
a DOT/DDC capital project. Project completion is scheduled<br />
for 2013.<br />
The crash analysis for the reconstruction of Houston Street<br />
includes the three years before construction began – July<br />
2002 to June 2005. Crash data from July 2005 through<br />
Eastbound Houston Street Average Peak Period Travel Times<br />
Sixth Avenue to Bowery<br />
Before After Change % Change<br />
Weekday 7-10 a.m. 03:24 03:44 00:20 10%<br />
Weekday 12-2 p.m. 03:43 05:07 01:24 38%<br />
Crashes with Injuries along Houston Street<br />
West Street to Bowery<br />
<strong>Sustainable</strong> <strong>Streets</strong> <strong>Index</strong> <strong>2010</strong><br />
Before* (three previous years)<br />
After<br />
Total Crashes with Injuries 107 77 69 63.8<br />
Number of Crashes with Injuries to:<br />
Motor Vehicle Occupants 63 36 33 30.8<br />
Pedestrians 27 29 20 24<br />
Bicyclists 19 12 17 11.3<br />
*Before columns show the crash history for each of the three years immediately<br />
prior to project construction. After column shows number of crashes since<br />
implementation (through October <strong>2010</strong>) at annual rate. See page 72 for further<br />
information on crash data source and analysis methodology. The sum of the<br />
three specific categories may not equal “Total Crashes with Injuries” because<br />
some crashes involved injuries in multiple categories.<br />
Weekday 4-7 p.m. 04:13 05:03 00:50 20%<br />
Saturday 11 a.m.-2 p.m. 07:47 06:23 -01:24 -18%<br />
Before data collected in October 2004. After data collected in November <strong>2010</strong>.<br />
Times shown in minutes, seconds.<br />
Westbound Houston Street Average Peak Period Travel Times<br />
Bowery to West Street<br />
Before After Change % Change<br />
Weekday 7-10 a.m. 08:52 08:34 -00:18 -3%<br />
Weekday 12-2 p.m. 11:00 07:28 -03:32 -32%<br />
Weekday 4-7 p.m. 08:28 09:45 01:17 15%<br />
Saturday 11 a.m.-2 p.m. 08:40 09:01 00:21 4%<br />
Before data collected in October 2004. After data collected in November <strong>2010</strong>.<br />
Times shown in minutes, seconds.<br />
33