2010 Sustainable Streets Index - NYC.gov
2010 Sustainable Streets Index - NYC.gov
2010 Sustainable Streets Index - NYC.gov

You also want an ePaper? Increase the reach of your titles
YUMPU automatically turns print PDFs into web optimized ePapers that Google loves.
• In six diverse neighborhoods (from the Bronx, Brooklyn,<br />
Manhattan and Queens) 85-93% of people arrived by<br />
transit, biking or walking.<br />
• In two neighborhoods (Astoria, Queens and New Dorp,<br />
Staten Island), 60-77% of people arrived by transit,<br />
biking or walking.<br />
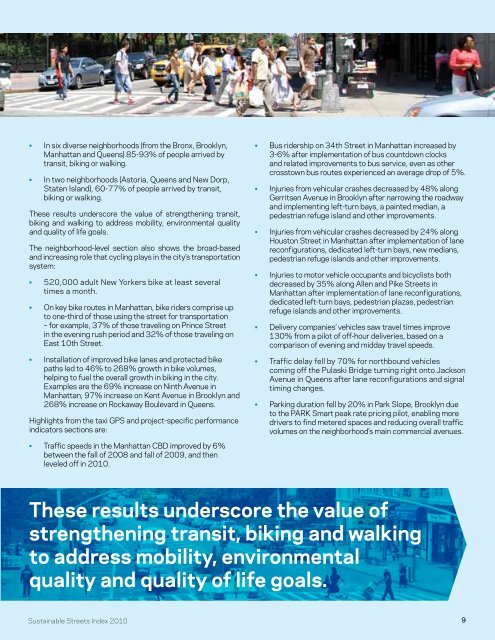
These results underscore the value of strengthening transit,<br />
biking and walking to address mobility, environmental quality<br />
and quality of life goals.<br />
The neighborhood-level section also shows the broad-based<br />
and increasing role that cycling plays in the city’s transportation<br />
system:<br />
• 520,000 adult New Yorkers bike at least several<br />
times a month.<br />
• On key bike routes in Manhattan, bike riders comprise up<br />
to one-third of those using the street for transportation<br />
– for example, 37% of those traveling on Prince Street<br />
in the evening rush period and 32% of those traveling on<br />
East 10th Street.<br />
• Installation of improved bike lanes and protected bike<br />
paths led to 46% to 268% growth in bike volumes,<br />
helping to fuel the overall growth in biking in the city.<br />
Examples are the 69% increase on Ninth Avenue in<br />
Manhattan, 97% increase on Kent Avenue in Brooklyn and<br />
268% increase on Rockaway Boulevard in Queens.<br />
Highlights from the taxi GPS and project-specific performance<br />
indicators sections are:<br />
• Traffic speeds in the Manhattan CBD improved by 6%<br />
between the fall of 2008 and fall of 2009, and then<br />
leveled off in <strong>2010</strong>.<br />
• Bus ridership on 34th Street in Manhattan increased by<br />
3-6% after implementation of bus countdown clocks<br />
and related improvements to bus service, even as other<br />
crosstown bus routes experienced an average drop of 5%.<br />
• Injuries from vehicular crashes decreased by 48% along<br />
Gerritsen Avenue in Brooklyn after narrowing the roadway<br />
and implementing left-turn bays, a painted median, a<br />
pedestrian refuge island and other improvements.<br />
• Injuries from vehicular crashes decreased by 24% along<br />
Houston Street in Manhattan after implementation of lane<br />
reconfigurations, dedicated left-turn bays, new medians,<br />
pedestrian refuge islands and other improvements.<br />
• Injuries to motor vehicle occupants and bicyclists both<br />
decreased by 35% along Allen and Pike <strong>Streets</strong> in<br />
Manhattan after implementation of lane reconfigurations,<br />
dedicated left-turn bays, pedestrian plazas, pedestrian<br />
refuge islands and other improvements.<br />
• Delivery companies’ vehicles saw travel times improve<br />
130% from a pilot of off-hour deliveries, based on a<br />
comparison of evening and midday travel speeds.<br />
• Traffic delay fell by 70% for northbound vehicles<br />
coming off the Pulaski Bridge turning right onto Jackson<br />
Avenue in Queens after lane reconfigurations and signal<br />
timing changes.<br />
• Parking duration fell by 20% in Park Slope, Brooklyn due<br />
to the PARK Smart peak rate pricing pilot, enabling more<br />
drivers to find metered spaces and reducing overall traffic<br />
volumes on the neighborhood’s main commercial avenues.<br />
These results underscore the value of<br />
strengthening transit, biking and walking<br />
to address mobility, environmental<br />
quality and quality of life goals.<br />
<strong>Sustainable</strong> <strong>Streets</strong> <strong>Index</strong> <strong>2010</strong><br />
9