2010 Sustainable Streets Index - NYC.gov
2010 Sustainable Streets Index - NYC.gov
2010 Sustainable Streets Index - NYC.gov

Create successful ePaper yourself
Turn your PDF publications into a flip-book with our unique Google optimized e-Paper software.
Pedestrian safety and connectivity improved at<br />
Jackson Avenue and the Pulaski Bridge with the<br />
installation of signal-protected crosswalks, pedestrian<br />
refuge islands and upgraded crosswalk markings.<br />
Other traffic changes included converting 49th Avenue from a<br />
two-way to a one-way eastbound street from the intersection<br />
of the Pulaski Bridge exit and the 11th Street service road to<br />
11th Place. This modification eliminates vehicular conflict<br />
since all traffic from the service road is directed onto 49th<br />
Avenue instead of merging with bridge traffic to make a right<br />
turn at Jackson Avenue. Also, the left turn from southbound<br />
11th Street to eastbound Jackson Avenue was prohibited,<br />
as a more efficient route was already available by using 47th<br />
Road two blocks to the north.<br />
Following the project’s completion and observation during<br />
the summer of 2009, minor adjustments were made to<br />
several signals and markings. The overall changes have<br />
improved pedestrian safety and connectivity, supported<br />
new economic development and residential growth,<br />
clarified paths and movements for motorists, and expanded<br />
landscaped area of the intersection.<br />
Analysis of the New York City Police Department (NYPD)<br />
crash data shows there were no statistically significant<br />
changes in the number of crashes involving injuries in the<br />
project area, although crash rates after implementation<br />
were lower than the average for the three prior years. In<br />
17 months since changes were installed, there have been<br />
no bicycle or pedestrian injuries, compared with 18 such<br />
injuries in the 10 years prior.<br />
Crashes with Injuries at Jackson Avenue and Pulaski Bridge<br />
Before* (three previous years)<br />
After<br />
Total Crashes with Injuries 9 6 5 5.6<br />
Number of Crashes with Injuries to:<br />
Motor Vehicle Occupants 8 4 5 5.6<br />
Pedestrians 0 1 0 0<br />
Bicyclists 1 1 0 0<br />
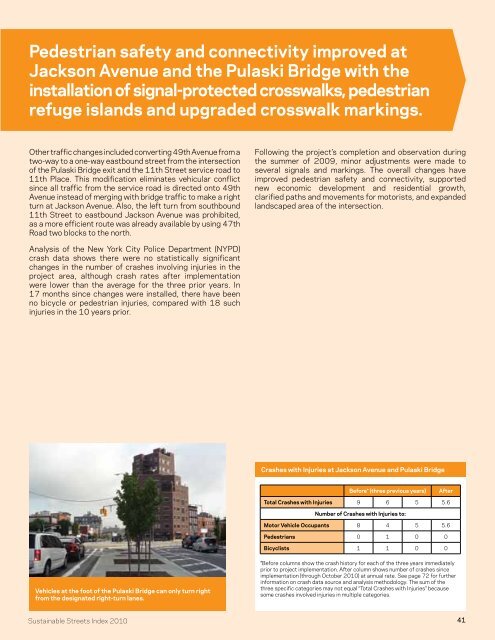
Vehicles at the foot of the Pulaski Bridge can only turn right<br />
from the designated right-turn lanes.<br />
*Before columns show the crash history for each of the three years immediately<br />
prior to project implementation. After column shows number of crashes since<br />
implementation (through October <strong>2010</strong>) at annual rate. See page 72 for further<br />
information on crash data source and analysis methodology. The sum of the<br />
three specific categories may not equal “Total Crashes with Injuries” because<br />
some crashes involved injuries in multiple categories.<br />
<strong>Sustainable</strong> <strong>Streets</strong> <strong>Index</strong> <strong>2010</strong><br />
41