A Guide to Conservation Agriculture in Zimbabwe - Canadian ...
A Guide to Conservation Agriculture in Zimbabwe - Canadian ...
A Guide to Conservation Agriculture in Zimbabwe - Canadian ...

Create successful ePaper yourself
Turn your PDF publications into a flip-book with our unique Google optimized e-Paper software.
section ONE<br />
Promot<strong>in</strong>g <strong>Conservation</strong> <strong>Agriculture</strong> Among Farmers<br />
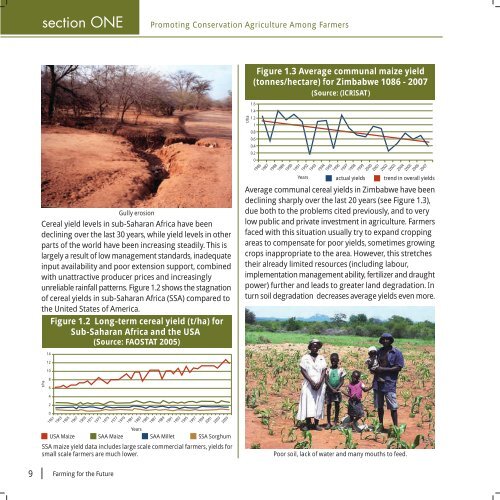
Figure 1.3 Average communal maize yield<br />
(<strong>to</strong>nnes/hectare) for <strong>Zimbabwe</strong> 1086 - 2007<br />
(Source: (ICRISAT)<br />
Gully erosion<br />
Cereal yield levels <strong>in</strong> sub-Saharan Africa have been<br />
decl<strong>in</strong><strong>in</strong>g over the last 30 years, while yield levels <strong>in</strong> other<br />
parts of the world have been <strong>in</strong>creas<strong>in</strong>g steadily. This is<br />
largely a result of low management standards, <strong>in</strong>adequate<br />
<strong>in</strong>put availability and poor extension support, comb<strong>in</strong>ed<br />
with unattractive producer prices and <strong>in</strong>creas<strong>in</strong>gly<br />
unreliable ra<strong>in</strong>fall patterns. Figure 1.2 shows the stagnation<br />
of cereal yields <strong>in</strong> sub-Saharan Africa (SSA) compared <strong>to</strong><br />
the United States of America.<br />
Figure 1.2 Long-term cereal yield (t/ha) for<br />
Sub-Saharan Africa and the USA<br />
(Source: FAOSTAT 2005)<br />
t/ha<br />
1.6<br />
1.4<br />
1.2<br />
1<br />
0.8<br />
0.6<br />
0.4<br />
0.2<br />
0<br />
1986<br />
1987<br />
1988<br />
1989<br />
1990<br />
1991<br />
Years<br />
1992<br />
1993<br />
1994<br />
1995<br />
1996<br />
actual yields<br />
1997<br />
1998<br />
1999<br />
2000<br />
2001<br />
2002<br />
2003<br />
2004<br />
2005<br />
2006<br />
2007<br />
trend <strong>in</strong> overall yields<br />
Average communal cereal yields <strong>in</strong> <strong>Zimbabwe</strong> have been<br />
decl<strong>in</strong><strong>in</strong>g sharply over the last 20 years (see Figure 1.3),<br />
due both <strong>to</strong> the problems cited previously, and <strong>to</strong> very<br />
low public and private <strong>in</strong>vestment <strong>in</strong> agriculture. Farmers<br />
faced with this situation usually try <strong>to</strong> expand cropp<strong>in</strong>g<br />
areas <strong>to</strong> compensate for poor yields, sometimes grow<strong>in</strong>g<br />
crops <strong>in</strong>appropriate <strong>to</strong> the area. However, this stretches<br />
their already limited resources (<strong>in</strong>clud<strong>in</strong>g labour,<br />
implementation management ability, fertilizer and draught<br />
power) further and leads <strong>to</strong> greater land degradation. In<br />
turn soil degradation decreases average yields even more.<br />
14<br />
12<br />
10<br />
t/ha<br />
8<br />
6<br />
4<br />
2<br />
0<br />
1961<br />
1963<br />
1965<br />
1967<br />
1969<br />
1971<br />
1973<br />
1975<br />
1977<br />
1979<br />
1981<br />
1983<br />
1985<br />
1987<br />
1989<br />
1991<br />
1993<br />
1995<br />
1997<br />
1999<br />
2001<br />
2003<br />
2005<br />
Years<br />
USA Maize SAA Maize SAA Millet SSA Sorghum<br />
SSA maize yield data <strong>in</strong>cludes large scale commercial farmers, yields for<br />
small scale farmers are much lower.<br />
Poor soil, lack of water and many mouths <strong>to</strong> feed.<br />
9 Farm<strong>in</strong>g for the Future