Walking and Cycling International Literature Review - Department of ...
Walking and Cycling International Literature Review - Department of ...
Walking and Cycling International Literature Review - Department of ...

Create successful ePaper yourself
Turn your PDF publications into a flip-book with our unique Google optimized e-Paper software.
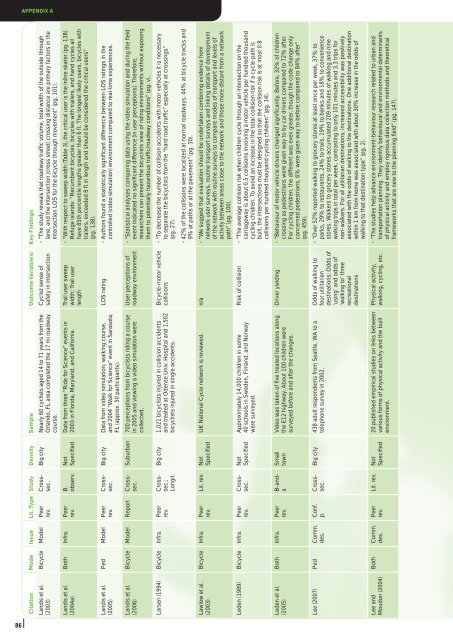
APPENDIX A<br />
Citation Mode Issue Lit. Type Study Density Sample Outcome Variable(s) Key Findings<br />
L<strong>and</strong>is et al.<br />
(2003)<br />
Bicycle Model Peer<br />
rev.<br />
Big city Nearly 60 cyclists aged 14 to 71 years from the<br />
Orl<strong>and</strong>o, FL area completed the 17 mi roadway<br />
course.<br />
Cyclist sense <strong>of</strong><br />
safety in intersection<br />
• “The study reveals that roadway traffic volume, total width <strong>of</strong> the outside through<br />
lane, <strong>and</strong> the intersection (cross street) crossing distance are primary factors in the<br />
Intersection LOS for the bicycle through movement” (pg. 101).<br />
L<strong>and</strong>is et al.<br />
(2004a)<br />
Both Infra. Peer<br />
rev.<br />
B.<br />
observ.<br />
Not<br />
Specified<br />
Data from three “Ride for Science” events in<br />
2003 in Florida, Maryl<strong>and</strong>, <strong>and</strong> California.<br />
Trail user sweep<br />
width; Trail user<br />
length<br />
• “With respect to sweep width (Table 3), the critical user is the inline skater (pg. 138).<br />
Refuge isl<strong>and</strong>s: “Recumbent bicycles, bicycles with trailers, <strong>and</strong> h<strong>and</strong> cycles all<br />
have 85th percentile lengths greater than 6 ft. The longest likely users, bicycles with<br />
trailers, exceeded 8 ft in length <strong>and</strong> should be considered the critical users”<br />
(pg. 138).<br />
L<strong>and</strong>is et al.<br />
(2005)<br />
Ped Model Peer<br />
rev.<br />
Crosssec.<br />
Crosssec.<br />
Big city Data from video simulation, walking course,<br />
<strong>and</strong> 2004 “Walk for Science” event in Sarasota,<br />
FL (approx. 50 participants).<br />
LOS rating • Authors found a statistically significant difference between LOS ratings in the<br />
controlled (video simulation) environment compared to real-time experiences.<br />
L<strong>and</strong>is et al.<br />
(2006)<br />
Suburban 700 perceptions from bicyclists riding a course<br />
in 2005 <strong>and</strong> viewing a video simulation were<br />
collected.<br />
User perceptions <strong>of</strong><br />
roadway environment<br />
• “Statistical analyses comparing data using the video simulation <strong>and</strong> during the field<br />
event indicated no significant difference [in user perceptions]. Therefore,<br />
researchers can present the bicyclists view <strong>of</strong> riding environments without exposing<br />
them to potentially hazardous traffic/roadway conditions” (pg. v).<br />
Larsen (1994) Bicycle Infra. Peer<br />
rev.<br />
Bicycle Model Report Crosssec.<br />
Crosssec.;<br />
Longit.<br />
Big city 1,021 bicyclists injured in collision accidents<br />
<strong>and</strong> treated at Odense Univ. Hospital <strong>and</strong> 1,502<br />
bicyclists injured in single accidents.<br />
Bicycle-motor vehicle<br />
collisions<br />
• “To decrease the number <strong>of</strong> collision accidents with motor vehicles it is necessary<br />
to separate the bicyclists from the “hard road traffic” especially at crossings”<br />
(pg. 27).<br />
• 42% <strong>of</strong> the collisions were localized at normal roadways, 44% at bicycle tracks <strong>and</strong><br />
9% at paths or at the pavement” (pg. 30).<br />
Lawlow et al.<br />
(2003)<br />
Bicycle Infra. Peer<br />
rev.<br />
Lit. rev. Not<br />
Specified<br />
UK National Cycle network is reviewed. n/a • “We suggest that evaluation should be undertaken combining evidence from<br />
network user surveys, routine transport surveys <strong>and</strong> linking details <strong>of</strong> development<br />
<strong>of</strong> the network with routine surveys to compare modes <strong>of</strong> transport <strong>and</strong> levels <strong>of</strong><br />
activity between areas close to the network <strong>and</strong> those more distant from a network<br />
path” (pg. 100).<br />
Leden (1989) Bicycle Infra. Peer<br />
rev.<br />
Not<br />
Specified<br />
Approximately 14,000 children in some<br />
40 schools in Sweden, Finl<strong>and</strong>, <strong>and</strong> Norway<br />
were surveyed.<br />
Risk <strong>of</strong> collision • “The average collision risk when children cycle through an intersection on the<br />
carriageway is about 0.5 collisions involving a motor vehicle per hundred thous<strong>and</strong><br />
cycling children. To avoid an increase in the total collision risk if a cycle-path is<br />
built, the intersections must be designed so that the collision risk is at most 0.8<br />
collisions per hundred thous<strong>and</strong> cycling children” (pg. 14).<br />
Leden et al.<br />
(2005)<br />
Both Infra. Peer<br />
rev.<br />
Small<br />
town<br />
Video was taken <strong>of</strong> five treated locations along<br />
the E12 highway. About 100 children were<br />
surveyed before <strong>and</strong> after the changes.<br />
Driver yielding • “Behaviour <strong>of</strong> motor vehicle drivers changed significantly. Before, 32% <strong>of</strong> children<br />
crossing as pedestrians were given way to by car drivers compared to 72% after.<br />
For cycling children, the different was even greater, though the code change only<br />
concerned pedestrians, 6% were given way to before compared to 84% after”<br />
(pg. 459).<br />
Lee (2007) Ped Comm.<br />
des.<br />
Conf.<br />
p.<br />
Crosssec.<br />
B-<strong>and</strong>a<br />
Crosssec.<br />
Big city 438 adult respondents from Seattle, WA to a<br />
telephone survey in 2002.<br />
Odds <strong>of</strong> walking to<br />
four utilitarian<br />
destinations; Odds <strong>of</strong><br />
‘using’ <strong>and</strong> odds <strong>of</strong><br />
‘walking to’ three<br />
recreational<br />
destinations<br />
• “Over 52% reported walking to grocery stores at least once per week, 37% to<br />
parks, 29% to restaurants, 24% to trails, 19% to banks <strong>and</strong> 18% to convenience<br />
stores. Walkers to grocery stores accumulated 209 minutes <strong>of</strong> walking <strong>and</strong> nine<br />
walking trips in total per week, contrasting to only 101 minutes <strong>and</strong> 3.3 trips for<br />
non-walkers. For all utilitarian destinations, increased accessibility was positively<br />
associated with the odds <strong>of</strong> walking to the destinations. One additional destination<br />
within 1 km from home was associated with about 30% increase in the odds <strong>of</strong><br />
walking to that destination type” (pg. 2).<br />
Lee <strong>and</strong><br />
Moudon (2004)<br />
Both Comm.<br />
des.<br />
Peer<br />
rev.<br />
Lit. rev. Not<br />
Specified<br />
20 published empirical studies on links between<br />
various forms <strong>of</strong> physical activity <strong>and</strong> the built<br />
environment.<br />
Physical activity,<br />
walking, cycling, etc.<br />
• “The studies help advance environment-behaviour research related to urban <strong>and</strong><br />
transportation planning. They identify behavioural <strong>and</strong> environmental determinants<br />
<strong>of</strong> physical activity <strong>and</strong> employ rigorous data collection methods <strong>and</strong> theoretical<br />
frameworks that are new to the planning field” (pg. 147).<br />
86