IPET Report 3 Vol VIII
IPET Report 3 Vol VIII
IPET Report 3 Vol VIII
You also want an ePaper? Increase the reach of your titles
YUMPU automatically turns print PDFs into web optimized ePapers that Google loves.
Probabilistic Risk Model<br />
Risk associated with the hurricane protection system is quantified through a regional<br />
hurricane rate (λ) and the probability P(C > c) with which a consequence measure (C) exceeds<br />
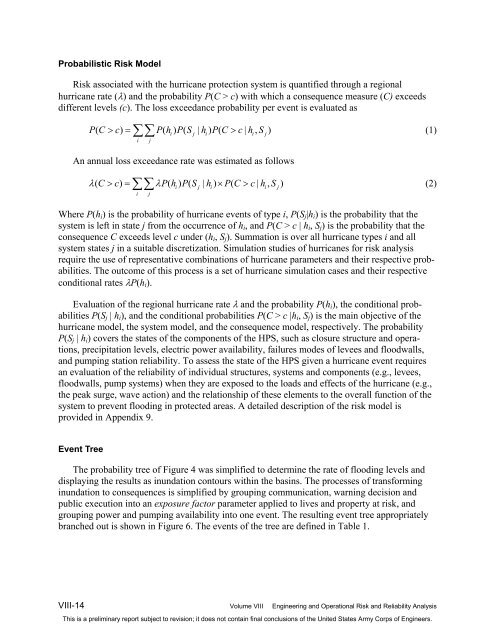
different levels (c). The loss exceedance probability per event is evaluated as<br />
PC ( > c) = ∑∑ Ph ( i) PS ( j | hi) PC ( > c| hi, Sj)<br />
(1)<br />
i j<br />
An annual loss exceedance rate was estimated as follows<br />
λ( C > c) = ∑∑ λP(<br />
hi) P( Sj | hi) × P( C > c| hi, Sj)<br />
(2)<br />
i j<br />
Where P(hi) is the probability of hurricane events of type i, P(Sj|hi) is the probability that the<br />
system is left in state j from the occurrence of hi, and P(C > c | hi, Sj) is the probability that the<br />
consequence C exceeds level c under (hi, Sj). Summation is over all hurricane types i and all<br />
system states j in a suitable discretization. Simulation studies of hurricanes for risk analysis<br />
require the use of representative combinations of hurricane parameters and their respective probabilities.<br />
The outcome of this process is a set of hurricane simulation cases and their respective<br />
conditional rates λP(hi).<br />
Evaluation of the regional hurricane rate λ and the probability P(hi), the conditional probabilities<br />
P(Sj | hi), and the conditional probabilities P(C > c |hi, Sj) is the main objective of the<br />
hurricane model, the system model, and the consequence model, respectively. The probability<br />
P(Sj | hi) covers the states of the components of the HPS, such as closure structure and operations,<br />
precipitation levels, electric power availability, failures modes of levees and floodwalls,<br />
and pumping station reliability. To assess the state of the HPS given a hurricane event requires<br />
an evaluation of the reliability of individual structures, systems and components (e.g., levees,<br />
floodwalls, pump systems) when they are exposed to the loads and effects of the hurricane (e.g.,<br />
the peak surge, wave action) and the relationship of these elements to the overall function of the<br />
system to prevent flooding in protected areas. A detailed description of the risk model is<br />
provided in Appendix 9.<br />
Event Tree<br />
The probability tree of Figure 4 was simplified to determine the rate of flooding levels and<br />
displaying the results as inundation contours within the basins. The processes of transforming<br />
inundation to consequences is simplified by grouping communication, warning decision and<br />
public execution into an exposure factor parameter applied to lives and property at risk, and<br />
grouping power and pumping availability into one event. The resulting event tree appropriately<br />
branched out is shown in Figure 6. The events of the tree are defined in Table 1.<br />
<strong>VIII</strong>-14 <strong>Vol</strong>ume <strong>VIII</strong> Engineering and Operational Risk and Reliability Analysis<br />
This is a preliminary report subject to revision; it does not contain final conclusions of the United States Army Corps of Engineers.


