IPET Report 3 Vol VIII
IPET Report 3 Vol VIII
IPET Report 3 Vol VIII

Create successful ePaper yourself
Turn your PDF publications into a flip-book with our unique Google optimized e-Paper software.
The spatial pattern of surge and waves depends primarily on R max, X and θ. Since the effect<br />
of these parameters at a given geographic location is generally non-monotonic, interpolation<br />
involving these parameters would not produce accurate results. In addition, these parameters<br />
interact among themselves. Hence, all combinations of R max, X and θ in Table 6 must be run<br />
using the MR model. The use of only 3 levels of R max in Table 6 reduces the computational<br />
effort in the MR runs.<br />
The LR runs have shown that, for given R max, X and θ, the water level at each geographical<br />
location depends smoothly on ΔP , V, and B. Therefore a smaller number of levels of these<br />
parameters were considered and water levels calculated for the other levels through<br />
interpolation. This has led to the MR run plan in Table 7.<br />
One may reduce the number of MR runs even further. From the LR runs, it was determined<br />
that the multiplicative effect of Holland’s B on the surge depends mildly onΔP and V. Therefore<br />
there is no need to run different values of B with each combination of ΔP and V. This produces<br />
the MR plan in Table 8, which comprises two sub-factorials of the levels in Table 7, with a total<br />
of only 1155 runs.<br />
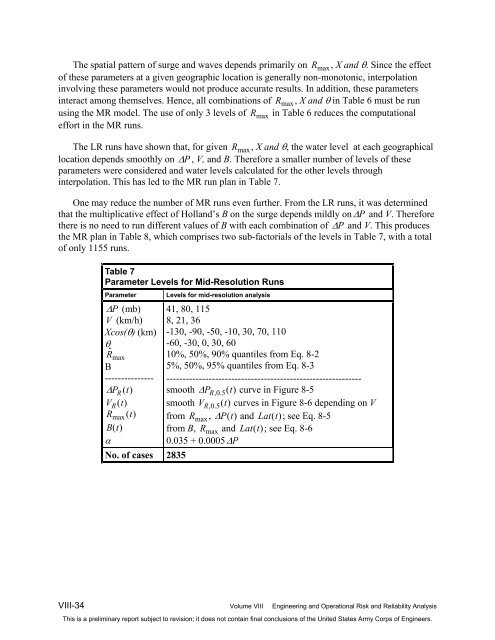
Table 7<br />
Parameter Levels for Mid-Resolution Runs<br />
Parameter Levels for mid-resolution analysis<br />
ΔP (mb)<br />
V (km/h)<br />
Xcos(θ) (km)<br />
θ ��<br />
R max<br />
B<br />
---------------<br />
ΔP R (t)<br />
V R(t)<br />
R max (t)<br />
B(t)<br />
α<br />
No. of cases 2835<br />
41, 80, 115<br />
8, 21, 36<br />
-130, -90, -50, -10, 30, 70, 110<br />
-60, -30, 0, 30, 60<br />
10%, 50%, 90% quantiles from Eq. 8-2<br />
5%, 50%, 95% quantiles from Eq. 8-3<br />
------------------------------------------------------------<br />
smooth ΔP R,0.5(t) curve in Figure 8-5<br />
smooth V R,0.5(t) curves in Figure 8-6 depending on V<br />
from R max, ΔP(t) and Lat(t); see Eq. 8-5<br />
from B, R max and Lat(t); see Eq. 8-6<br />
0.035 + 0.0005ΔP<br />
<strong>VIII</strong>-34 <strong>Vol</strong>ume <strong>VIII</strong> Engineering and Operational Risk and Reliability Analysis<br />
This is a preliminary report subject to revision; it does not contain final conclusions of the United States Army Corps of Engineers.