IPET Report 3 Vol VIII
IPET Report 3 Vol VIII
IPET Report 3 Vol VIII

Create successful ePaper yourself
Turn your PDF publications into a flip-book with our unique Google optimized e-Paper software.
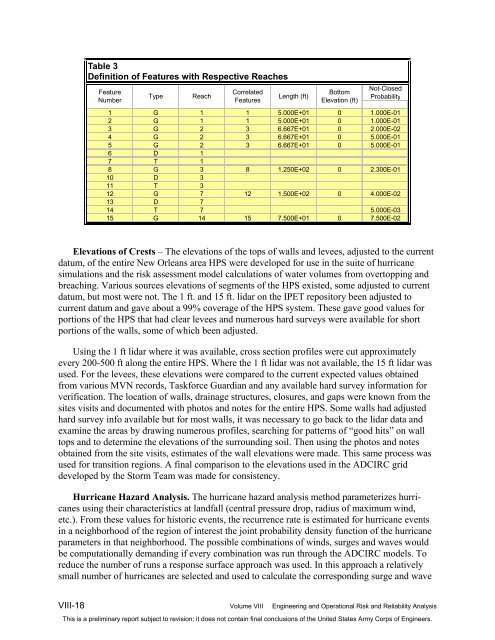
Table 3<br />
Definition of Features with Respective Reaches<br />
Feature<br />
Number<br />
Correlated<br />
Type Reach Length (ft)<br />
Features<br />
Bottom<br />
Elevation (ft)<br />
Not-Closed<br />
Probability<br />
1 G 1 1 5.000E+01 0 1.000E-01<br />
2 G 1 1 5.000E+01 0 1.000E-01<br />
3 G 2 3 6.667E+01 0 2.000E-02<br />
4 G 2 3 6.667E+01 0 5.000E-01<br />
5 G 2 3 6.667E+01 0 5.000E-01<br />
6 D 1<br />
7 T 1<br />
8 G 3 8 1.250E+02 0 2.300E-01<br />
10 D 3<br />
11 T 3<br />
12 G 7 12 1.500E+02 0 4.000E-02<br />
13 D 7<br />
14 T 7 5.000E-03<br />
15 G 14 15 7.500E+01 0 7.500E-02<br />
Elevations of Crests – The elevations of the tops of walls and levees, adjusted to the current<br />
datum, of the entire New Orleans area HPS were developed for use in the suite of hurricane<br />
simulations and the risk assessment model calculations of water volumes from overtopping and<br />
breaching. Various sources elevations of segments of the HPS existed, some adjusted to current<br />
datum, but most were not. The 1 ft. and 15 ft. lidar on the <strong>IPET</strong> repository been adjusted to<br />
current datum and gave about a 99% coverage of the HPS system. These gave good values for<br />
portions of the HPS that had clear levees and numerous hard surveys were available for short<br />
portions of the walls, some of which been adjusted.<br />
Using the 1 ft lidar where it was available, cross section profiles were cut approximately<br />
every 200-500 ft along the entire HPS. Where the 1 ft lidar was not available, the 15 ft lidar was<br />
used. For the levees, these elevations were compared to the current expected values obtained<br />
from various MVN records, Taskforce Guardian and any available hard survey information for<br />
verification. The location of walls, drainage structures, closures, and gaps were known from the<br />
sites visits and documented with photos and notes for the entire HPS. Some walls had adjusted<br />
hard survey info available but for most walls, it was necessary to go back to the lidar data and<br />
examine the areas by drawing numerous profiles, searching for patterns of “good hits” on wall<br />
tops and to determine the elevations of the surrounding soil. Then using the photos and notes<br />
obtained from the site visits, estimates of the wall elevations were made. This same process was<br />
used for transition regions. A final comparison to the elevations used in the ADCIRC grid<br />
developed by the Storm Team was made for consistency.<br />
Hurricane Hazard Analysis. The hurricane hazard analysis method parameterizes hurricanes<br />
using their characteristics at landfall (central pressure drop, radius of maximum wind,<br />
etc.). From these values for historic events, the recurrence rate is estimated for hurricane events<br />
in a neighborhood of the region of interest the joint probability density function of the hurricane<br />
parameters in that neighborhood. The possible combinations of winds, surges and waves would<br />
be computationally demanding if every combination was run through the ADCIRC models. To<br />
reduce the number of runs a response surface approach was used. In this approach a relatively<br />
small number of hurricanes are selected and used to calculate the corresponding surge and wave<br />
<strong>VIII</strong>-18 <strong>Vol</strong>ume <strong>VIII</strong> Engineering and Operational Risk and Reliability Analysis<br />
This is a preliminary report subject to revision; it does not contain final conclusions of the United States Army Corps of Engineers.