Tackling educational inequality - CentreForum
Tackling educational inequality - CentreForum
Tackling educational inequality - CentreForum

You also want an ePaper? Increase the reach of your titles
YUMPU automatically turns print PDFs into web optimized ePapers that Google loves.
<strong>Tackling</strong> <strong>educational</strong> <strong>inequality</strong><br />
1.2 EXAMINING THE ‘TAIL’<br />
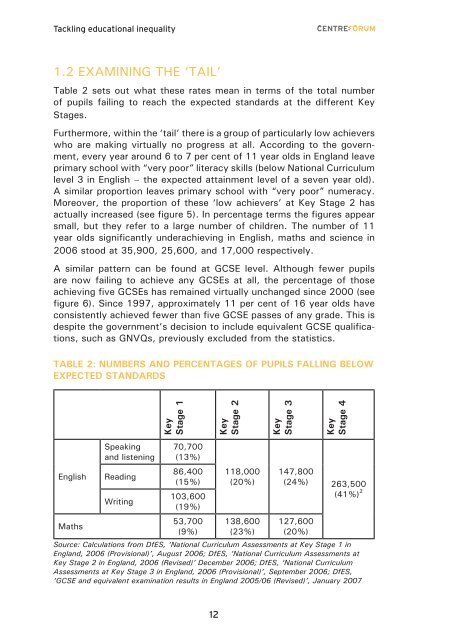
Table 2 sets out what these rates mean in terms of the total number<br />
of pupils failing to reach the expected standards at the different Key<br />
Stages.<br />
Furthermore, within the ‘tail’ there is a group of particularly low achievers<br />
who are making virtually no progress at all. According to the government,<br />
every year around 6 to 7 per cent of 11 year olds in England leave<br />
primary school with “very poor” literacy skills (below National Curriculum<br />
level 3 in English – the expected attainment level of a seven year old).<br />
A similar proportion leaves primary school with “very poor” numeracy.<br />
Moreover, the proportion of these ‘low achievers’ at Key Stage 2 has<br />
actually increased (see figure 5). In percentage terms the figures appear<br />
small, but they refer to a large number of children. The number of 11<br />
year olds significantly underachieving in English, maths and science in<br />
2006 stood at 35,900, 25,600, and 17,000 respectively.<br />
A similar pattern can be found at GCSE level. Although fewer pupils<br />
are now failing to achieve any GCSEs at all, the percentage of those<br />
achieving five GCSEs has remained virtually unchanged since 2000 (see<br />
figure 6). Since 1997, approximately 11 per cent of 16 year olds have<br />
consistently achieved fewer than five GCSE passes of any grade. This is<br />
despite the government’s decision to include equivalent GCSE qualifications,<br />
such as GNVQs, previously excluded from the statistics.<br />
Table 2: Numbers and percentages of pupils falling below<br />
expected standards<br />
Key<br />
Stage 1<br />
Key<br />
Stage 2<br />
Key<br />
Stage 3<br />
Key<br />
Stage 4<br />
English<br />
Maths<br />
Speaking<br />
and listening<br />
Reading<br />
Writing<br />
70,700<br />
(13%)<br />
86,400<br />
(15%)<br />
103,600<br />
(19%)<br />
53,700<br />
(9%)<br />
118,000<br />
(20%)<br />
138,600<br />
(23%)<br />
147,800<br />
(24%) 263,500<br />
(41%) 2<br />
127,600<br />
(20%)<br />
Source: Calculations from DfES, ‘National Curriculum Assessments at Key Stage 1 in<br />
England, 2006 (Provisional)’, August 2006; DfES, ‘National Curriculum Assessments at<br />
Key Stage 2 in England, 2006 (Revised)’ December 2006; DfES, ‘National Curriculum<br />
Assessments at Key Stage 3 in England, 2006 (Provisional)’, September 2006; DfES,<br />
‘GCSE and equivalent examination results in England 2005/06 (Revised)’, January 2007<br />
12