Tackling educational inequality - CentreForum
Tackling educational inequality - CentreForum
Tackling educational inequality - CentreForum

You also want an ePaper? Increase the reach of your titles
YUMPU automatically turns print PDFs into web optimized ePapers that Google loves.
<strong>Tackling</strong> <strong>educational</strong> <strong>inequality</strong><br />
2.2 PUPIL LEVEL VARIABLES AT THE SCHOOL<br />
LEVEL<br />
All of these risk factors, when aggregated at the school level, impact on<br />
school performance. The more children there are in a school who display<br />
one or more of these characteristics, the more likely it is that the school<br />
will be categorised as underperforming.<br />
Deprivation<br />
There is a strong relationship between the eligibility of the pupil intake<br />
for free school meals and overall school performance. A recent National<br />
Audit Office report found that schools with a high proportion of pupils<br />
eligible for FSM were on average 2.7 times more likely than a school<br />
with a low proportion to be in an Ofsted category. The school level<br />
correlation between deprivation and attainment is shown for London<br />
schools below. The effect of deprivation appears to be stronger at<br />
secondary than primary school.<br />
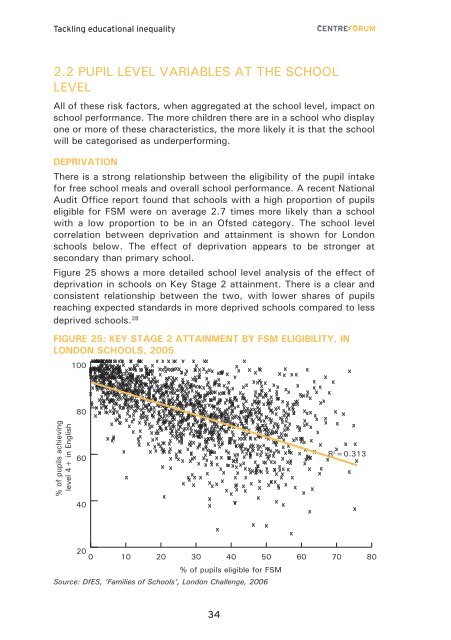
Figure 25 shows a more detailed school level analysis of the effect of<br />
deprivation in schools on Key Stage 2 attainment. There is a clear and<br />
consistent relationship between the two, with lower shares of pupils<br />
reaching expected standards in more deprived schools compared to less<br />
deprived schools. 28<br />
Figure 25: Key Stage 2 attainment by FSM eligibility, in<br />
London schools, 2005<br />
100<br />
80<br />
% of pupils achieving<br />
level 4+ in English<br />
60<br />
40<br />
R 2 =0.313<br />
20<br />
0 10 20 30 40 50 60 70 80<br />
% of pupils eligible for FSM<br />
Source: DfES, ‘Families of Schools’, London Challenge, 2006<br />
34