Tackling educational inequality - CentreForum
Tackling educational inequality - CentreForum
Tackling educational inequality - CentreForum

You also want an ePaper? Increase the reach of your titles
YUMPU automatically turns print PDFs into web optimized ePapers that Google loves.
<strong>Tackling</strong> <strong>educational</strong> <strong>inequality</strong><br />
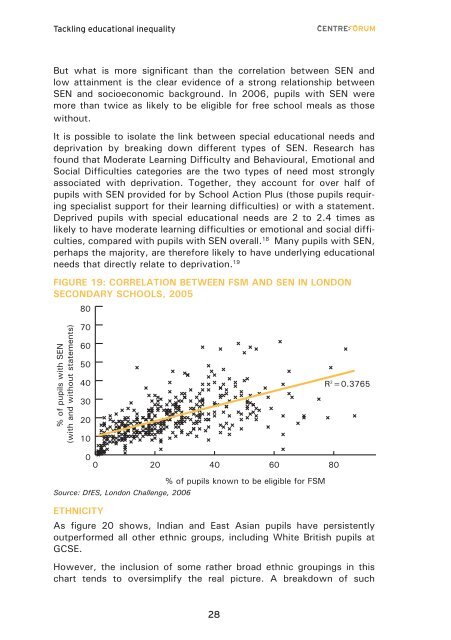
But what is more significant than the correlation between SEN and<br />
low attainment is the clear evidence of a strong relationship between<br />
SEN and socioeconomic background. In 2006, pupils with SEN were<br />
more than twice as likely to be eligible for free school meals as those<br />
without.<br />
It is possible to isolate the link between special <strong>educational</strong> needs and<br />
deprivation by breaking down different types of SEN. Research has<br />
found that Moderate Learning Difficulty and Behavioural, Emotional and<br />
Social Difficulties categories are the two types of need most strongly<br />
associated with deprivation. Together, they account for over half of<br />
pupils with SEN provided for by School Action Plus (those pupils requiring<br />
specialist support for their learning difficulties) or with a statement.<br />
Deprived pupils with special <strong>educational</strong> needs are 2 to 2.4 times as<br />
likely to have moderate learning difficulties or emotional and social difficulties,<br />
compared with pupils with SEN overall. 18 Many pupils with SEN,<br />
perhaps the majority, are therefore likely to have underlying <strong>educational</strong><br />
needs that directly relate to deprivation. 19<br />
Figure 19: Correlation between FSM and SEN in London<br />
secondary schools, 2005<br />
80<br />
% of pupils with SEN<br />
(with and without statements)<br />
70<br />
60<br />
50<br />
40<br />
30<br />
20<br />
10<br />
R 2 =0.3765<br />
0<br />
0 20 40 60 80 100<br />
Source: DfES, London Challenge, 2006<br />
% of pupils known to be eligible for FSM<br />
Ethnicity<br />
As figure 20 shows, Indian and East Asian pupils have persistently<br />
outperformed all other ethnic groups, including White British pupils at<br />
GCSE.<br />
However, the inclusion of some rather broad ethnic groupings in this<br />
chart tends to oversimplify the real picture. A breakdown of such<br />
28