UNIVERSITY OF CALIFORNIA Los Angeles - Users - UCLA
UNIVERSITY OF CALIFORNIA Los Angeles - Users - UCLA
UNIVERSITY OF CALIFORNIA Los Angeles - Users - UCLA

Create successful ePaper yourself
Turn your PDF publications into a flip-book with our unique Google optimized e-Paper software.
With new digital technologies for mapping, now, there is a lot of maps<br />
we can see though internet as almost real-time. As the new digital<br />
technologies spread out, like Pickles mentions in his book, “Perhaps we<br />
should place emphasizes on the worlds that are being produced in the<br />
digital transition, the conceptions of history with which they work, and<br />
the forms of socio-political life to which they contribute." 32 New<br />
technologies for maps and mapping have an impact on contemporary<br />
urban society and public practices. 33 The following is a quote by Board,<br />
explaining about represented and generalized maps and models:<br />
[I]t is comparatively easy to visualize maps as representational; models of real<br />
world, but it is important to realize that they are also conceptual models<br />
containing the essence of some generalization about reality. In that role, maps<br />
are useful analytical tools which help investigators to see the real world in a<br />
new light, or even to allow them an entirely new view of reality. 34<br />
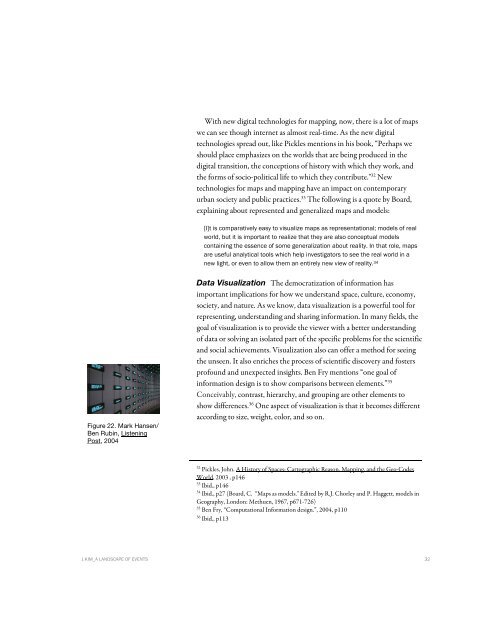
Figure 22. Mark Hansen/<br />
Ben Rubin, Listening<br />
Post, 2004<br />
Data Visualization The democratization of information has<br />
important implications for how we understand space, culture, economy,<br />
society, and nature. As we know, data visualization is a powerful tool for<br />
representing, understanding and sharing information. In many fields, the<br />
goal of visualization is to provide the viewer with a better understanding<br />
of data or solving an isolated part of the specific problems for the scientific<br />
and social achievements. Visualization also can offer a method for seeing<br />
the unseen. It also enriches the process of scientific discovery and fosters<br />
profound and unexpected insights. Ben Fry mentions “one goal of<br />
information design is to show comparisons between elements.” 35<br />
Conceivably, contrast, hierarchy, and grouping are other elements to<br />
show differences. 36 One aspect of visualization is that it becomes different<br />
according to size, weight, color, and so on.<br />
32<br />
Pickles, John. A History of Spaces: Cartographic Reason, Mapping, and the Geo-Codes<br />
World, 2003 , p146<br />
33<br />
Ibid., p146<br />
34<br />
Ibid., p27 (Board, C. “Maps as models." Edited by R.J. Chorley and P. Haggett, models in<br />
Geography, London: Methuen, 1967, p671-726)<br />
35<br />
Ben Fry, “Computational Information design.”, 2004, p110<br />
36<br />
Ibid., p113<br />
J.KIM_A LANDSCAPE <strong>OF</strong> EVENTS 32