UNIVERSITY OF CALIFORNIA Los Angeles - Users - UCLA
UNIVERSITY OF CALIFORNIA Los Angeles - Users - UCLA
UNIVERSITY OF CALIFORNIA Los Angeles - Users - UCLA

Create successful ePaper yourself
Turn your PDF publications into a flip-book with our unique Google optimized e-Paper software.
data collection and visualization can be unlimited, and there are many<br />
possibilities to recall individual subjectivity. I had an opportunity to visit<br />
both InfoVis07 and InfoVis08 and found certain differences across the<br />
two conferences. At InfoVis08, there was more research about socialrelated<br />
information visualizations than scientific visualizations, as well as<br />
more information on perception, design, and interaction issues. Beyond<br />
scientific visualization, information visualization, particularly social<br />
related data sets, has begun to draw attention.<br />
The democratization of information gives the public access to more<br />
data. For example, during and after the U.S. election, people could track<br />
the amount of donations to the candidates and the voting rate at almost<br />
real time. In addition, the public can generate information themselves and<br />
share it. Many Eyes, a public web site “where users may upload data, create<br />
interactive visualizations, and carry on discussion” 39 is an example to<br />
explain data collecting/sharing platform operated by the public.<br />
Following is a description about the webpage:<br />
[T]he goal of the site is to support collaboration around visualizations at a large<br />
scale by fostering a social style of data analysis in which visualizations not only<br />
serve as a discovery tool for individuals but also as a medium to spur discussion<br />
among users. 40<br />
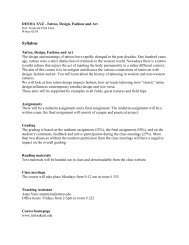
Figure 25. Many Eyes: “ a cleverly used stacked graph that shows relative differences in<br />
the type of postings on two online link aggregators, a world map showing the average<br />
account balance per capita, a bubble chart showing the size of the endowments of<br />
different US universities, and a tag cloud showing two word occurrences in the work of<br />
Yeats” 41<br />
39<br />
Viégas, Fernanda and B. Martin Wattenberg., al.,”Many Eyes: A Site for Visualization at<br />
Internet Scale’, 2007, p1121<br />
40<br />
Ibid. , p1121<br />
41<br />
Ibid. , p1124<br />
J.KIM_A LANDSCAPE <strong>OF</strong> EVENTS 34