UNIVERSITY OF CALIFORNIA Los Angeles - Users - UCLA
UNIVERSITY OF CALIFORNIA Los Angeles - Users - UCLA
UNIVERSITY OF CALIFORNIA Los Angeles - Users - UCLA
You also want an ePaper? Increase the reach of your titles
YUMPU automatically turns print PDFs into web optimized ePapers that Google loves.
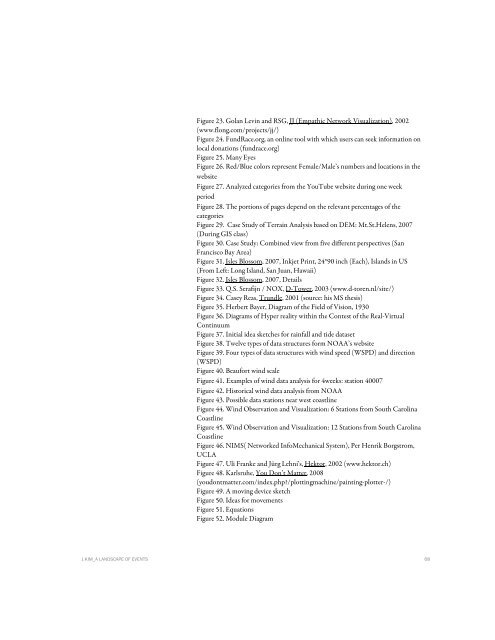
Figure 23. Golan Levin and RSG, JJ (Empathic Network Visualization), 2002<br />
(www.flong.com/projects/jj/)<br />
Figure 24. FundRace.org, an online tool with which users can seek information on<br />
local donations (fundrace.org)<br />
Figure 25. Many Eyes<br />
Figure 26. Red/Blue colors represent Female/Male’s numbers and locations in the<br />
website<br />
Figure 27. Analyzed categories from the YouTube website during one week<br />
period<br />
Figure 28. The portions of pages depend on the relevant percentages of the<br />
categories<br />
Figure 29. Case Study of Terrain Analysis based on DEM: Mt.St.Helens, 2007<br />
(During GIS class)<br />
Figure 30. Case Study: Combined view from five different perspectives (San<br />
Francisco Bay Area)<br />
Figure 31. Isles Blossom, 2007, Inkjet Print, 24*90 inch (Each), Islands in US<br />
(From Left: Long Island, San Juan, Hawaii)<br />
Figure 32. Isles Blossom, 2007, Details<br />
Figure 33. Q.S. Serafijn / NOX, D-Tower, 2003 (www.d-toren.nl/site/)<br />
Figure 34. Casey Reas, Trundle, 2001 (source: his MS thesis)<br />
Figure 35. Herbert Bayer, Diagram of the Field of Vision, 1930<br />
Figure 36. Diagrams of Hyper reality within the Contest of the Real-Virtual<br />
Continuum<br />
Figure 37. Initial idea sketches for rainfall and tide dataset<br />
Figure 38. Twelve types of data structures form NOAA’s website<br />
Figure 39. Four types of data structures with wind speed (WSPD) and direction<br />
(WSPD)<br />
Figure 40. Beaufort wind scale<br />
Figure 41. Examples of wind data analysis for 4weeks: station 40007<br />
Figure 42. Historical wind data analysis from NOAA<br />
Figure 43. Possible data stations near west coastline<br />
Figure 44. Wind Observation and Visualization: 6 Stations from South Carolina<br />
Coastline<br />
Figure 45. Wind Observation and Visualization: 12 Stations from South Carolina<br />
Coastline<br />
Figure 46. NIMS( Networked InfoMechanical System), Per Henrik Borgstrom,<br />
<strong>UCLA</strong><br />
Figure 47. Uli Franke and Jürg Lehni's, Hektor, 2002 (www.hektor.ch)<br />
Figure 48. Karlsruhe, You Don’t Matter, 2008<br />
(youdontmatter.com/index.php/plottingmachine/painting-plotter-/)<br />
Figure 49. A moving device sketch<br />
Figure 50. Ideas for movements<br />
Figure 51. Equations<br />
Figure 52. Module Diagram<br />
J.KIM_A LANDSCAPE <strong>OF</strong> EVENTS 68


