

Get set for a liquidity rally - the DBS Vickers Securities Equities ...
Get set for a liquidity rally - the DBS Vickers Securities Equities ...
Get set for a liquidity rally - the DBS Vickers Securities Equities ...

Create successful ePaper yourself
Turn your PDF publications into a flip-book with our unique Google optimized e-Paper software.
Regional ETF Focus<br />
<strong>Get</strong> <strong>set</strong> <strong>for</strong> a <strong>liquidity</strong> <strong>rally</strong><br />
India (Underweight) (Joanne Goh, joannegohsc@dbs.com)<br />
Near term outlook<br />
We are less negative on India compared to <strong>the</strong> last quarter.<br />
Growth seems to be losing steam but we believe it is<br />
normalizing after <strong>the</strong> scorching pace in <strong>the</strong> previous quarter,<br />
notwithstanding <strong>the</strong> higher inflation and rates hikes that<br />
could also possibly dampen demand.<br />
The re<strong>for</strong>m agenda supports a longer-term positive outlook.<br />
It is also enough to support <strong>the</strong> 8% GDP growth target as<br />
well as alleviating <strong>the</strong> high budget deficit and inflation<br />
concerns in <strong>the</strong> near term.<br />
While strong nominal GDP growth could be positive <strong>for</strong><br />
earnings growth in India, we are cognizant of higher<br />
operating costs eating into profits especially after recent fuel<br />
and wage hikes. Inflation at its extreme may also snap<br />
consumer demand and hurt top line growth, in our view.<br />
Valuation in India is expensive and earnings expectations<br />
barely changed throughout <strong>the</strong> year. We suspect Sensex will<br />
continue to rise and thus valuations as well as risk <strong>for</strong> <strong>the</strong><br />
market.<br />
We maintain Underweight on India on valuation grounds.<br />
Drivers:<br />
• The economy is primarily driven by domestic<br />
consumption. Long term infrastructure development and<br />
<strong>the</strong> need to improve living conditions (reduce slum areas,<br />
improve education and reduce poverty) imply long-term<br />
potential growth of 7.5%. The growth rate may be<br />
understated considering <strong>the</strong> huge population and <strong>the</strong><br />
government's recent re<strong>for</strong>m ef<strong>for</strong>ts.<br />
• Post re-election of <strong>the</strong> ruling UPA government last year,<br />
<strong>the</strong> government is expected to step up its re<strong>for</strong>m ef<strong>for</strong>ts<br />
and better quality growth can be achieved.<br />
• We believe growth can surprise on <strong>the</strong> upside following<br />
<strong>the</strong> 2010/11 budget, which is thought to be wellbalanced.<br />
Government <strong>for</strong>ecasts 9% growth this year<br />
and double-digit growth rates in <strong>the</strong> coming years.<br />
• Relaxation in FDI rules and capital flows should encourage<br />
more investor flows into India. Stock market re<strong>for</strong>ms like<br />
privatization and increase in <strong>for</strong>eign ownership will<br />
improve market efficiency.<br />
• A strong domestic savers' pool contributes to <strong>the</strong> longterm<br />
growth potential of <strong>the</strong> market.<br />
Risks:<br />
• India valuations trade towards <strong>the</strong> higher end of <strong>the</strong><br />
range and do not provide enough cushion should risk<br />
aversion persists. The market is more volatile than most<br />
Asian markets.<br />
• Supply constraints as a result of under-investment will<br />
continue to challenge <strong>the</strong> inflation outlook in our view.<br />
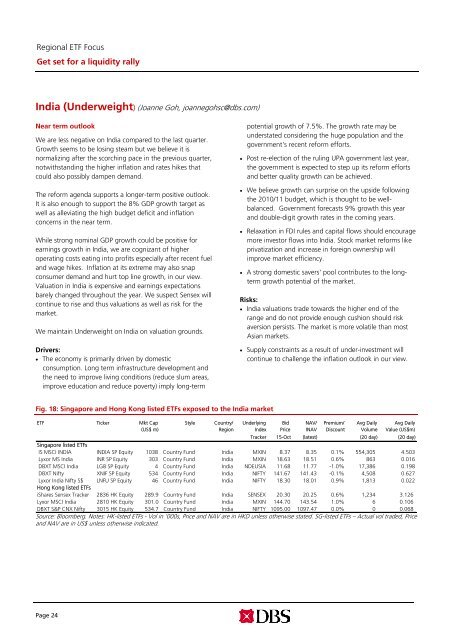
Fig. 18: Singapore and Hong Kong listed ETFs exposed to <strong>the</strong> India market<br />
ETF Ticker Mkt Cap Style Country/ Underlying Bid NAV/ Premium/ Avg Daily Avg Daily<br />
(US$ m) Region Index Price INAV Discount Volume Value (US$m)<br />
Tracker 15-Oct (latest) (20 day) (20 day)<br />
Singapore listed ETFs<br />
IS MSCI INDIA INDIA SP Equity 1038 Country Fund India MXIN 8.37 8.35 0.1% 554,305 4.503<br />
Lyxor MS India INR SP Equity 303 Country Fund India MXIN 18.63 18.51 0.6% 863 0.016<br />
DBXT MSCI India LG8 SP Equity 4 Country Fund India NDEUSIA 11.68 11.77 -1.0% 17,386 0.198<br />
DBXT Nifty XNIF SP Equity 534 Country Fund India NIFTY 141.67 141.43 -0.1% 4,508 0.627<br />
Lyxor India Nifty S$ LNFU SP Equity 46 Country Fund India NIFTY 18.30 18.01 0.9% 1,813 0.022<br />
Hong Kong listed ETFs<br />
iShares Sensex Tracker 2836 HK Equity 289.9 Country Fund India SENSEX 20.30 20.25 0.6% 1,234 3.126<br />
Lyxor MSCI India 2810 HK Equity 301.0 Country Fund India MXIN 144.70 143.54 1.0% 6 0.106<br />
DBXT S&P CNX Nifty 3015 HK Equity 534.7 Country Fund India NIFTY 1095.00 1097.47 0.0% 0 0.068<br />
Source: Bloomberg. Notes: HK-listed ETFs - Vol in ‘000s, Price and NAV are in HKD unless o<strong>the</strong>rwise stated. SG-listed ETFs – Actual vol traded, Price<br />
and NAV are in US$ unless o<strong>the</strong>rwise indicated.<br />
Page 24


