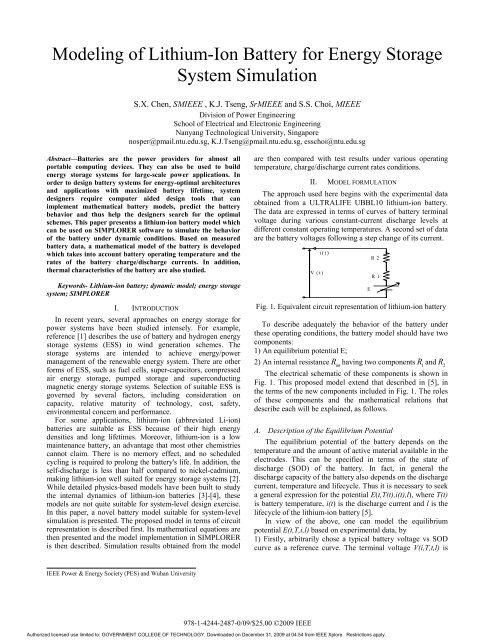
Modeling of Lithium-Ion Battery for Energy Storage System Simulation
Modeling of Lithium-Ion Battery for Energy Storage System Simulation
Modeling of Lithium-Ion Battery for Energy Storage System Simulation

Create successful ePaper yourself
Turn your PDF publications into a flip-book with our unique Google optimized e-Paper software.
<strong>Modeling</strong> <strong>of</strong> <strong>Lithium</strong>-<strong>Ion</strong> <strong>Battery</strong> <strong>for</strong> <strong>Energy</strong> <strong>Storage</strong><br />
<strong>System</strong> <strong>Simulation</strong><br />
S.X. Chen, SMIEEE , K.J. Tseng, SrMIEEE and S.S. Choi, MIEEE<br />
Division <strong>of</strong> Power Engineering<br />
School <strong>of</strong> Electrical and Electronic Engineering<br />
Nanyang Technological University, Singapore<br />
nosper@pmail.ntu.edu.sg, K.J.Tseng@pmail.ntu.edu.sg, esschoi@ntu.edu.sg<br />
Abstract—Batteries are the power providers <strong>for</strong> almost all<br />
portable computing devices. They can also be used to build<br />
energy storage systems <strong>for</strong> large-scale power applications. In<br />
order to design battery systems <strong>for</strong> energy-optimal architectures<br />
and applications with maximized battery lifetime, system<br />
designers require computer aided design tools that can<br />
implement mathematical battery models, predict the battery<br />
behavior and thus help the designers search <strong>for</strong> the optimal<br />
schemes. This paper presentss a lithium-ion battery model which<br />
can be used on SIMPLORER s<strong>of</strong>tware to simulate the behavior<br />
<strong>of</strong> the battery under dynamic conditions. Based on measured<br />
battery data, a mathematical model <strong>of</strong> the battery is developed<br />
which takes into account battery operating temperature and the<br />
rates <strong>of</strong> the battery charge/discharge currents. In addition,<br />
thermal characteristics <strong>of</strong> the battery are also studied.<br />
Keywords- <strong>Lithium</strong>-ion battery; dynamic model; energy storage<br />
system; SIMPLORER<br />
I. INTRODUCTION<br />
In recent years, several approaches on energy storage <strong>for</strong><br />
power systems have been studied intensely. For example,<br />
reference [1] describes the use <strong>of</strong> battery and hydrogen energy<br />
storage systems (ESS) in wind generation schemes. The<br />
storage systems are intended to achieve energy/power<br />
management <strong>of</strong> the renewable energy system. There are other<br />
<strong>for</strong>ms <strong>of</strong> ESS, such as fuel cells, super-capacitors, compressed<br />
air energy storage, pumped storage and superconducting<br />
magnetic energy storage systems. Selection <strong>of</strong> suitable ESS is<br />
governed by several factors, including consideration on<br />
capacity, relative maturity <strong>of</strong> technology, cost, safety,<br />
environmental concern and per<strong>for</strong>mance.<br />
For some applications, lithium-ion (abbreviated Li-ion)<br />
batteries are suitable as ESS because <strong>of</strong> their high energy<br />
densities and long lifetimes. Moreover, lithium-ion is a low<br />
maintenance battery, an advantage that most other chemistries<br />
cannot claim. There is no memory effect, and no scheduled<br />
cycling is required to prolong the battery's life. In addition, the<br />
self-discharge is less than half compared to nickel-cadmium,<br />
making lithium-ion well suited <strong>for</strong> energy storage systems [2].<br />
While detailed physics-based models have been built to study<br />
the internal dynamics <strong>of</strong> lithium-ion batteries [3]-[4], these<br />
models are not quite suitable <strong>for</strong> system-level design exercise.<br />
In this paper, a novel battery model suitable <strong>for</strong> system-level<br />
simulation is presented. The proposed model in terms <strong>of</strong> circuit<br />
representation is described first. Its mathematical equations are<br />
then presented and the model implementation in SIMPLORER<br />
is then described. <strong>Simulation</strong> results obtained from the model<br />
IEEE Power & <strong>Energy</strong> Society (PES) and Wuhan University<br />
978-1-4244-2487-0/09/$25.00 ©2009 IEEE<br />
are then compared with test results under various operating<br />
temperature, charge/discharge current rates conditions.<br />
II. MODEL FORMULATION<br />
The approach used here begins with the experimental data<br />
obtained from a ULTRALIFE UBBL10 lithium-ion battery.<br />
The data are expressed in terms <strong>of</strong> curves <strong>of</strong> battery terminal<br />
voltage during various constant-current discharge levels at<br />
different constant operating temperatures. A second set <strong>of</strong> data<br />
are the battery voltages following a step change <strong>of</strong> its current.<br />
V (t)<br />
i(t)<br />
Fig. 1. Equivalent circuit representation <strong>of</strong> lithium-ion battery<br />
To describe adequately the behavior <strong>of</strong> the battery under<br />
these operating conditions, the battery model should have two<br />
components:<br />
1) An equilibrium potential E;<br />
2) An internal resistance R having two components int<br />
1 R and 2 R<br />
The electrical schematic <strong>of</strong> these components is shown in<br />
Fig. 1. This proposed model extend that described in [5], in<br />
the terms <strong>of</strong> the new components included in Fig. 1. The roles<br />
<strong>of</strong> these components and the mathematical relations that<br />
describe each will be explained, as follows.<br />
A. Description <strong>of</strong> the Equilibrium Potential<br />
The equilibrium potential <strong>of</strong> the battery depends on the<br />
temperature and the amount <strong>of</strong> active material available in the<br />
electrodes. This can be specified in terms <strong>of</strong> the state <strong>of</strong><br />
discharge (SOD) <strong>of</strong> the battery. In fact, in general the<br />
discharge capacity <strong>of</strong> the battery also depends on the discharge<br />
current, temperature and lifecycle. Thus it is necessary to seek<br />
a general expression <strong>for</strong> the potential E(t,T(t),i(t),l), where T(t)<br />
is battery temperature, i(t) is the discharge current and l is the<br />
lifecycle <strong>of</strong> the lithium-ion battery [5].<br />
In view <strong>of</strong> the above, one can model the equilibrium<br />
potential E(t,T,i,l) based on experimental data, by<br />
1) Firstly, arbitrarily chose a typical battery voltage vs SOD<br />
curve as a reference curve. The terminal voltage V(i,T,t,l) is<br />
Authorized licensed use limited to: GOVERNMENT COLLEGE OF TECHNOLOGY. Downloaded on December 31, 2009 at 04:54 from IEEE Xplore. Restrictions apply.<br />
E<br />
R2<br />
R1
then explained in terms <strong>of</strong> the battery SOD in a n th order<br />
polynomial. Also, from Fig. 1, the equilibrium potential<br />
E(t,T,i,l) is also seen as a function <strong>of</strong> V(i,T,t,l) and current i(t).<br />
These relationships are expressed as (1) and (2).<br />
2) Secondly, the discharge rate and temperature corresponding<br />
to the reference curve are treated as the reference discharge<br />
rate and temperature.<br />
There<strong>for</strong>e in view <strong>of</strong> the above, expressions <strong>for</strong> E, V(i,T,t,l),<br />
SOD and Rint are<br />
Eit [ ( ), T( t), tl , ] = vit [ ( ), T( t), tl , ] + R i( t)<br />
(1)<br />
n<br />
�<br />
int r<br />
v[ i( t), T( t), t, l] = c SOD [ i( t), T( t), t, l]<br />
(2)<br />
k<br />
k = 0<br />
k<br />
t<br />
1<br />
SOD[(), i t T (), t t, l] = � i() t dt<br />
(3)<br />
Q 0<br />
R = R + R<br />
(4)<br />
int 1 2<br />
Where ck is the coefficient <strong>of</strong> the k th -order term in the<br />
polynomial representation <strong>of</strong> the reference curve and Qr is the<br />
battery capacity referred to the cut<strong>of</strong>f voltage <strong>for</strong> the reference<br />
curve. For k = 0, E = c0 is the open-circuit voltage at the<br />
beginning <strong>of</strong> discharge at the reference temperature <strong>of</strong> the<br />
reference curve.<br />
B. Description <strong>of</strong> the Internal Resistance<br />
Normally, the internal resistance Rint will increase with the<br />
state <strong>of</strong> discharge. In this model, Rint has two components R1<br />
and R2. R1 is defined as the internal resistance <strong>of</strong> the lithiumion<br />
battery at SOD=0. It depends on the discharge condition,<br />
i.e. temperature, current level and lifecycle. R2 is the increase<br />
in Rint as SOD increases. R2 can also be affected by the<br />
temperature. However, it is proposed that an n th -order<br />
polynomial is used instead to describe the relationship<br />
between R2 and SOD. A correction factor �(T) will then be<br />
used later to compensate <strong>for</strong> variation <strong>of</strong> R2 with T.<br />
Based on the above, R can be defined as a function <strong>of</strong><br />
1<br />
discharge current, temperature and lifecycle, as follows,<br />
R = f( i( t), T( t), l)<br />
(5)<br />
1<br />
Take derivative on both sides <strong>of</strong> (5),<br />
δ f δ f δ f<br />
∂ R = ∂ i+ ∂ T + ∂l<br />
(6)<br />
1<br />
δi δT δl<br />
R1 can be calculated by dividing the initial voltage drop<br />
(shown in Fig. 2) by the discharge current i(t) at SOD=0. From<br />
T<br />
1 n<br />
the experimental data, [ ∂R ∂R<br />
]<br />
1 1<br />
1 1 1<br />
�∂i ∂T ∂l<br />
�<br />
�<br />
�<br />
�<br />
� n<br />
�∂i �<br />
n<br />
∂T �<br />
� can be easily calculated.<br />
�<br />
n<br />
∂l<br />
�<br />
�<br />
Expressed in matrix <strong>for</strong>m,<br />
1 1<br />
�∂R � �∂i � � �<br />
� = �<br />
� � �<br />
n<br />
n<br />
�∂R �<br />
� � i 1 � �∂ 1<br />
∂T �<br />
n<br />
∂T 1<br />
∂l<br />
�<br />
��δ<br />
f<br />
�<br />
���<br />
δi n<br />
∂l<br />
�<br />
�<br />
δ f<br />
δT δ f �<br />
δl<br />
��<br />
1 T<br />
� and<br />
(7)<br />
17<br />
V<br />
16.5<br />
16<br />
15.5<br />
15<br />
0 0.1 0.2<br />
SOD<br />
T=25� I=2 A<br />
Fig. 2 Determination <strong>of</strong> the voltage drop at SOD=0 <strong>for</strong><br />
different discharge condition<br />
Then using least-square method to obtain the values<br />
δ f δ f δ f<br />
<strong>of</strong> , ,<br />
δiδT δ l<br />
. Then R1 can be obtained as<br />
δ f δ f δ f<br />
R = ( i− i ) + ( T − T ) + ( l − l ) + R (8)<br />
1 ref ref ref 1_ref<br />
δi δT δl<br />
where, iref, Tref, lref are the discharge rate, temperature and<br />
lifecycle <strong>of</strong> the reference curve. R1_ref is the internal resistance<br />
<strong>of</strong> the reference curve at SOD=0.<br />
Returning to R2, in general, R2 can be defined as a function<br />
<strong>of</strong> SOD and temperature, as follows:<br />
R = g( T( t), SOD)<br />
(9)<br />
2<br />
Firstly choose another temperature discharge curve which<br />
is <strong>of</strong> the same discharge rate (the reference discharge rate).<br />
Then define i*R2_ref as the voltage drop (the difference between<br />
this curve and reference curve) at the same SOD, as <strong>for</strong><br />
example shown in Fig. 3. The selection <strong>of</strong> the SOD point can<br />
be arbitrarily because as shown subsequently, it does not cause<br />
significant difference to the final simulation result. Normally,<br />
selection <strong>of</strong> the SOD point at the middle <strong>of</strong> these curves yields<br />
higher overall accuracy. An n th -order polynomial can be used<br />
to fit to that relationship between R2_ref and SOD. The same<br />
order polynomial as that with the potential E is recommended,<br />
again to yield higher accuracy. A correction term �(T) is used<br />
to compensate <strong>for</strong> the variation <strong>of</strong> R2 at different discharge<br />
condition. This is illustrated as follows.<br />
The method to determine R2 is illustrated in Fig. 3, where<br />
experimental data from the ULTRALIFE UBBL10 lithium-ion<br />
battery is used. The reference curve and another curve at -20�<br />
are chosen to calculate R2_ref, which is shown in Fig. 4. Then,<br />
n<br />
k<br />
R = � r * SOD [ i( t), t]<br />
(10)<br />
2_ref<br />
k<br />
k = 0<br />
Fig. 3. Determination <strong>of</strong> the R2 <strong>for</strong> discharge condition at<br />
different temperatures.<br />
Authorized licensed use limited to: GOVERNMENT COLLEGE OF TECHNOLOGY. Downloaded on December 31, 2009 at 04:54 from IEEE Xplore. Restrictions apply.
In (10), rk is the coefficient <strong>of</strong> the kth order term in the<br />
polynomial representation <strong>of</strong> R2_ref. SOD selected is less than<br />
the SOD level at the termination <strong>of</strong> discharge. The terminal<br />
SOD chosen in this paper is 0.7. Then the correction term is<br />
i* R ( T)<br />
2<br />
α ( T ) =<br />
(11)<br />
i* R2_ref<br />
From (9)-(11), R2 <strong>of</strong> the internal resistance can be expressed as<br />
n<br />
k<br />
R = α ( T) * r * SOD [ i( t), t]<br />
(12)<br />
2 � k<br />
k = 0<br />
Fig. 4. R2_ref <strong>for</strong> the lithium-ion battery based on the 25�and -<br />
20� curves.<br />
C. Description <strong>of</strong> the Thermal Characteristics<br />
Since E is temperature dependent, temperature must be<br />
calculated dynamically so that it is available <strong>for</strong> computation <strong>of</strong><br />
E during each time step [6]. The temperature change <strong>of</strong> the<br />
battery is governed by the thermal energy balance [7] described<br />
by�<br />
dT () t<br />
2<br />
m* c * = i() t *( R + R ) −h A[ T() t −T<br />
] (13)<br />
p 1 2 c a<br />
dt<br />
In (13), m is the battery mass (in kg), cp is the specific heat<br />
(J/kg/K), hc is the heat transfer coefficient (W/m 2 ), A is the<br />
battery external surface area (m 2 ), Tc is the ambient<br />
temperature.<br />
The heat power terms include resistive heating and heat<br />
exchange to the surroundings. Heat generation due to entropy<br />
change or phase change, changes in the heat capacity and<br />
mixing have all been ignored here because from [5], it has been<br />
concluded that such omission will not cause significant loss <strong>of</strong><br />
model accuracy.<br />
D. Implementation based on the VHDL model in<br />
SIMPLORER<br />
Equations (1)-(4), (8), (12) and (13) provide complete<br />
description <strong>of</strong> the battery. From the derived mathematical<br />
model, the model can be simulated using VHDL-AMS method<br />
in SIMPLORER [8]. Un<strong>for</strong>tunately, lifecycle has not been<br />
considered in the battery model implementation since there is<br />
insufficient experimental data at the time <strong>of</strong> the writing <strong>of</strong> this<br />
paper.<br />
III. COMPARISON OF SIMULATION AND TEST RESULTS<br />
A. Discharge Characteristics<br />
A dynamic model <strong>of</strong> the ULTRALIFE UBBL10 lithiumion<br />
battery on the methodology given above was constructed<br />
<strong>for</strong> use in the SIMPLORER s<strong>of</strong>tware. The parameters are<br />
given in TABLE 1.<br />
The rate dependence <strong>of</strong> potential was validated by testing<br />
the Ultralife UBBL10 lithium-ion VHDL model. The initial<br />
SOD is set to 0. The battery is maintained at room temperature<br />
(25° C) by setting a large cooling coefficient (hc = 100 W/m 2<br />
K). This simulates the idealized constant-temperature case.<br />
Comparison <strong>of</strong> the simulation and test results <strong>of</strong> discharge<br />
currents at 1 A and 4 A are shown in Fig. 5. As can be seen<br />
from the figure, a most satisfactory match between the model<br />
and test data has been obtained <strong>for</strong> the reference curve (2A)<br />
and while good agreement has also been obtained <strong>for</strong> all other<br />
discharge rates.<br />
TABLE I. SPECIFICATIONS OF LITHIUM BATTERY TESTED IN THIS PAPER<br />
Model Tested UltraLife UBBL10<br />
Type <strong>of</strong> <strong>Battery</strong><br />
Cylindrical 18650 Li-ion cells<br />
assembly<br />
Operating Temperature -32°C to 60°C<br />
<strong>Storage</strong> Temperature<br />
Range<br />
-32°C to 60°C<br />
Voltage 16.33 V<br />
Capacity 6.2 Ah<br />
Heat capacity 925(J/kg/K)<br />
Fig. 5. <strong>Simulation</strong> and test data at different current levels <strong>for</strong><br />
the Ultralife UBBL10 lithium-ion batter<br />
The simulation data were processed to obtain the relation<br />
between the voltage and the SOD. The results are compared<br />
with the test data, as shown in Fig. 6. Again excellent match<br />
was achieved <strong>for</strong> the operating temperatures <strong>of</strong> -30� and 60<br />
�.<br />
������� <strong>Simulation</strong> and test data at different temperature levels<br />
<strong>for</strong> the Ultralife UBBL10 lithium-ion battery<br />
Authorized licensed use limited to: GOVERNMENT COLLEGE OF TECHNOLOGY. Downloaded on December 31, 2009 at 04:54 from IEEE Xplore. Restrictions apply.
B. Charge Characteristics<br />
In this part <strong>of</strong> the study, the Ultralife UBBL10 lithium-ion<br />
battery was charged by a constant current 0.8A until the<br />
battery voltage reached 16.33V. Then the charging mode<br />
changed to constant voltage and the charge current eventually<br />
decayed to zero. This charging procedure is common, as can<br />
be seen in [9].<br />
Fig. 7 shows the voltage increases during the charging<br />
operation. When the voltage reaches the maximum value <strong>of</strong><br />
16.34 V, it remains at this value. That is reasonable <strong>for</strong> the<br />
lithium-ion battery studied.<br />
Fig. 7. Charging <strong>of</strong> the Ultralife UBBL10 lithium-ion battery:<br />
comparison between simulation and test results<br />
C. Thermal Characteristics<br />
In this part, the model is used to study how heat sink can<br />
affect battery operation. Using the same lithium-ion battery<br />
model written in VHDL-AMS with the initial SOD <strong>of</strong> the<br />
battery set to 0 and the load set to draw a constant current <strong>of</strong> 2<br />
A, the heat transfer coefficient was varied.<br />
Fig. 8 shows the simulation results <strong>of</strong> the battery<br />
temperature during discharge under different cooling<br />
conditions. Notice that the final temperatures are 28.2°C<br />
(301.2°K) and 33.5°C (306.5°K) respectively <strong>for</strong> the constant<br />
cooling coefficients <strong>of</strong> 5 W/m 2 K and 1 W/m 2 K. The battery<br />
temperature is nearly equaled to the ambient (25°C) <strong>for</strong> very<br />
large cooling coefficients (hc = 100 W/m 2 K). From the<br />
simulation results, it can be concluded that the battery<br />
temperature increases faster when the constant cooling<br />
coefficient is lower.<br />
Fig. 8. <strong>Simulation</strong> results <strong>of</strong> battery temperature during<br />
discharge (2A, 25� ambient) <strong>for</strong> different cooling conditions<br />
IV. CONCLUSIONS<br />
A model <strong>of</strong> a lithium-ion battery suitable <strong>for</strong> energy storage<br />
application has been shown. The model was <strong>for</strong>mulated in a<br />
general sense, but specifically <strong>for</strong> use in the SIMPLORER<br />
s<strong>of</strong>tware. The method accounts <strong>for</strong> current rate- and<br />
temperature- dependence <strong>of</strong> the capacity and thermal<br />
dependence <strong>of</strong> the equilibrium potential. The modeling<br />
procedure, based on the experimental data, allows the model<br />
to have both good accuracy and the flexibility to represent<br />
other types <strong>of</strong> batteries. The mathematical description <strong>of</strong> the<br />
battery has been coded to a VHDL-AMS model in the<br />
SIMPLORER s<strong>of</strong>tware.<br />
The battery model is shown to per<strong>for</strong>m satisfactorily, up to<br />
the cut<strong>of</strong>f voltage. It is governed by the k th order term in the<br />
polynomial representation <strong>of</strong> the reference curve. <strong>Simulation</strong><br />
results <strong>of</strong> the battery model agree well with the experimental<br />
data <strong>of</strong> an Ultralife UBBL10 lithium-ion battery in all static<br />
characteristics. This is because the internal resistance was<br />
defined based on the experimental data. It has two components<br />
R1 and R2. R1 is the initial resistance <strong>of</strong> the lithium-ion battery.<br />
It depends on the different discharge condition <strong>of</strong><br />
temperatures, current levels and lifecycle. R2 is the increased<br />
resistance with the SOD.<br />
ACKNOWLEDGMENTS<br />
The authors would like to thank the technical staff <strong>of</strong> the Power<br />
Electronics and Drives Laboratory <strong>for</strong> the support given.<br />
Special thanks to Mdm Lee-Loh <strong>for</strong> her technical support in the<br />
equipment usage and s<strong>of</strong>tware installation. Special thanks also<br />
go to D.L.Yao and T.D. Nguyen.<br />
REFERENCES<br />
[1] T. E. Lipman, et al, “An Assessment <strong>of</strong> <strong>Battery</strong> and Hydrogen <strong>Energy</strong><br />
<strong>Storage</strong> <strong>System</strong>s Integrated with Wind <strong>Energy</strong> Resources in Cali<strong>for</strong>nia”,<br />
Cali<strong>for</strong>nia <strong>Energy</strong> Commission, PIER <strong>Energy</strong>-Related Environmental<br />
Research. CEC-500-2005-136, 2005<br />
[2] S.Megahed and W. Ebner, “<strong>Lithium</strong>-ion battery <strong>for</strong> electronic<br />
applications,” J. Power Sources, vol,54,pp. 155-162,1995.<br />
[3] M. Doyle, T. T. Fuller, and J. Newman, “<strong>Modeling</strong> <strong>of</strong> galvanostatic<br />
charge and dishcarge <strong>of</strong> the lithium/polymer/insertion cell,” J. Power<br />
Electrochem, Soc., vol. 140, p. 1526, 1993.<br />
[4] L. Song and J. W. Evans, “Electrochemical-thermal model <strong>of</strong> lithium<br />
polymer batteries,” J. Electrochem. Soc., vol. 147, no. 6, pp. 2086-2095,<br />
2000.<br />
[5] Lijun Gao, Shengyi Liu and Roger A. Dougal,2002, “Dynamic <strong>Lithium</strong>-<br />
<strong>Ion</strong> <strong>Battery</strong> Model <strong>for</strong> <strong>System</strong> simulation”, IEEE Trans. Comp. Package.<br />
Technology, Vol.25, No 3, Setember, pp.495-505.<br />
[6] V.H.Johnson, A. A. Pesaran, and T. Sack, 2002, “Temperaturedependent<br />
battery models <strong>for</strong> high-power lithium-ion batteries”, <strong>Battery</strong><br />
Thermal Manage Assessment.<br />
[7] D. Bernardi, E. Pawlikowski, and J. Newman, “A general energy<br />
balance <strong>for</strong> battery systems”, J. Electrochem. Soc., vol. 132, No. 1, pp.5-<br />
12, 1985.<br />
[8] Ans<strong>of</strong>t Corporation, “<strong>Simulation</strong> <strong>System</strong> SIMPLORER VHDL-AMS<br />
Tutorial”<br />
[9] Crompton, T. R. (Thomas Roy), “<strong>Battery</strong> Reference Book”, Ox<strong>for</strong>d,<br />
Newnes, 1999, 3rd Ed.<br />
Authorized licensed use limited to: GOVERNMENT COLLEGE OF TECHNOLOGY. Downloaded on December 31, 2009 at 04:54 from IEEE Xplore. Restrictions apply.