

Testing Distributional Dependence in the Becker-DeGroot-Marschak ...
Testing Distributional Dependence in the Becker-DeGroot-Marschak ...
Testing Distributional Dependence in the Becker-DeGroot-Marschak ...

Create successful ePaper yourself
Turn your PDF publications into a flip-book with our unique Google optimized e-Paper software.
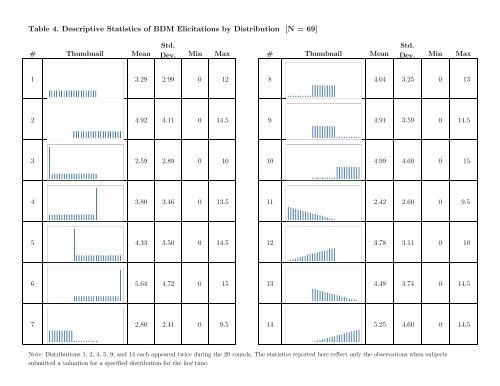
Table 4. Descriptive Statistics of BDM Elicitations by Distribution [N = 69]<br />
# Thumbnail Mean<br />
1<br />
2<br />
3<br />
4<br />
5<br />
6<br />
7<br />
Std.<br />
Dev. M<strong>in</strong> Max<br />
3.29 2.99 0 12<br />
4.92 4.11 0 14.5<br />
2.59 2.89 0 10<br />
3.80 3.46 0 13.5<br />
4.33 3.50 0 14.5<br />
5.64 4.72 0 15<br />
2.80 2.41 0 9.5<br />
# Thumbnail Mean<br />
Std.<br />
Dev. M<strong>in</strong> Max<br />
Note: Distributions 1, 2, 4, 5, 9, and 14 each appeared twice dur<strong>in</strong>g <strong>the</strong> 20 rounds. The statistics reported here reflect only <strong>the</strong> observations when subjects<br />
submitted a valuation for a specified distribution for <strong>the</strong> last time.<br />
8<br />
9<br />
10<br />
11<br />
12<br />
13<br />
14<br />
4.04 3.25 0 13<br />
4.91 3.59 0 14.5<br />
4.99 4.60 0 15<br />
2.42 2.60 0 9.5<br />
3.78 3.11 0 10<br />
4.48 3.74 0 14.5<br />
5.25 4.60 0 14.5