the numerical sea ice forecast in finland in the winter 1993-94 ...
the numerical sea ice forecast in finland in the winter 1993-94 ...
the numerical sea ice forecast in finland in the winter 1993-94 ...
- No tags were found...

Create successful ePaper yourself
Turn your PDF publications into a flip-book with our unique Google optimized e-Paper software.
6<br />
3.4. Statistical verification<br />
An objective verification procedure was used <strong>in</strong> order to check <strong>the</strong> <strong>forecast</strong> results and to make an<br />
objective assessment of <strong>the</strong> model. Root mean square error (RMSE) of <strong>ice</strong> thickness and mean error<br />
(ME) of <strong>the</strong> <strong>ice</strong> edge was estimated for trial and <strong>numerical</strong> <strong>forecast</strong>s. The real <strong>ice</strong> edge was taken from<br />
ERS-1 imagery and <strong>the</strong> <strong>forecast</strong>ed <strong>ice</strong> edge was def<strong>in</strong>ed as a 4 cm isol<strong>in</strong>e <strong>in</strong> <strong>the</strong> thickness field. In <strong>the</strong><br />
table 1 and figures 6-7 <strong>the</strong> statistical verification is given for February 23 - May 18 19<strong>94</strong>. The RMSE<br />
for <strong>ice</strong> thickness was 8 cm and ME for <strong>ice</strong> edge 6 km for a 24 h <strong>forecast</strong> dur<strong>in</strong>g <strong>the</strong> forcasted 85 days.<br />
4. CONCLUSIONS<br />
On comparation and verification of <strong>the</strong> <strong>numerical</strong> <strong>ice</strong> model ra<strong>the</strong>r satisfactory results can be seen.<br />
After all, this was <strong>the</strong> first time that <strong>the</strong> new Baltic Sea <strong>sea</strong> <strong>ice</strong> model was runn<strong>in</strong>g over such a long<br />
period. There is, however, a large amount of development to be done <strong>in</strong> <strong>the</strong> future. Most of all, <strong>the</strong><br />
<strong>forecast</strong><strong>in</strong>g period must be prolonged from 36 h <strong>in</strong>to >72 h. The next step Will be improv<strong>in</strong>g <strong>the</strong><br />
accuracy of <strong>the</strong> <strong>in</strong>itial <strong>ice</strong> field, and l<strong>in</strong>k<strong>in</strong>g <strong>the</strong> model <strong>in</strong>to a wea<strong>the</strong>r prediction model. Ano<strong>the</strong>r field<br />
Will be to perfect <strong>the</strong> <strong>forecast</strong><strong>in</strong>g results by us<strong>in</strong>g a coupled <strong>sea</strong> <strong>ice</strong> - ocean model.<br />
REFERENCES<br />
Grönvall, H. 1988: F<strong>in</strong>nish <strong>ice</strong> serv<strong>ice</strong>. - F<strong>in</strong>nish Mar<strong>in</strong>e Re<strong>sea</strong>rch No 256:95-110.<br />
Leppäranta, M. 198 1: An <strong>ice</strong> drift model for <strong>the</strong> Baltic Sea. - Tehus 33 (6):583-596.<br />
Se<strong>in</strong>ä, A. 19<strong>94</strong>: Extent of <strong>ice</strong>-cover 1961-1990 and restrictions to navigation 198 1 - 1990 along <strong>the</strong><br />
F<strong>in</strong>nish coast. - F<strong>in</strong>nish Mar<strong>in</strong>e Re<strong>sea</strong>rch No 262:3-34.<br />
Wu, Huid<strong>in</strong>g & Leppäranta, M. 1990: Experiments on <strong>numerical</strong> <strong>sea</strong> <strong>ice</strong> <strong>forecast</strong><strong>in</strong>g <strong>in</strong> <strong>the</strong> Bohai Sea.<br />
- Proc. on <strong>the</strong> IAHR Symposium on Ice, Espoo, F<strong>in</strong>land, Aug. 20-24 1990. Vol. 3: 173-186.<br />
Wu, Huid<strong>in</strong>g; Zhang, Zhanhai & Bai, Shan <strong>1993</strong>: On <strong>the</strong> operational <strong>numerical</strong> <strong>forecast</strong> of <strong>sea</strong> <strong>ice</strong> <strong>in</strong><br />
<strong>the</strong> Bohai Bay of Ch<strong>in</strong>a.<br />
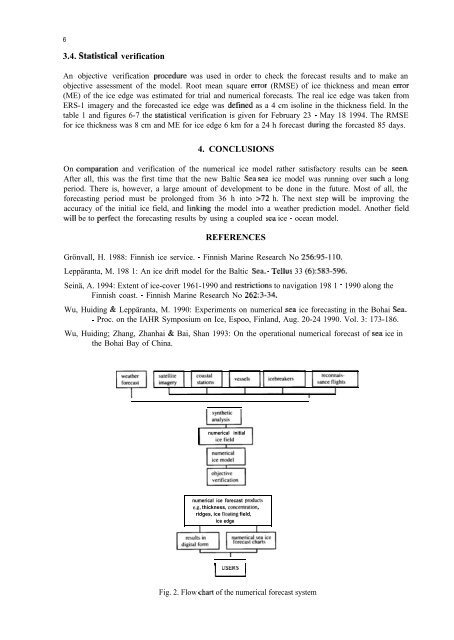
<strong>numerical</strong> <strong>in</strong>itial<br />
<strong>numerical</strong> <strong>ice</strong> <strong>forecast</strong> products<br />
e.g. thickness, toncentration,<br />
ridges, <strong>ice</strong> float<strong>in</strong>g field,<br />
<strong>ice</strong> edge<br />
I<br />
USERS<br />
I<br />
Fig. 2. Flow chart of <strong>the</strong> <strong>numerical</strong> <strong>forecast</strong> system