Dingee Reservoir Final Seismic Report - East Bay Municipal Utility ...
Dingee Reservoir Final Seismic Report - East Bay Municipal Utility ...
Dingee Reservoir Final Seismic Report - East Bay Municipal Utility ...
- No tags were found...

You also want an ePaper? Increase the reach of your titles
YUMPU automatically turns print PDFs into web optimized ePapers that Google loves.
Native Material<br />
The in-situ moisture contents of the native materials varied from 15.3% to 28.9%, with an<br />
average of 19.3% and standard deviation of 3.1%. In-place dry unit weights of the native<br />
materials ranged from 97.3 to 117.5 pcf, with an average of 109.9 pcf and standard deviation of<br />
5.0 pcf. The average void ratio and degree of saturation are 0.5 and 95.3 %, respectively.<br />
Sandstone Bedrock / Franciscan Assemblage<br />
The in-situ moisture contents of the Sandstone Bedrock / Franciscan Assemblage varied from<br />
15.2% to 34.6%, with an average of 27.4% and a standard deviation of 5.9%. In-place dry unit<br />
weights of the Formation ranged from 83.8 to 120.0 pcf, with an average of 97.1 pcf and a<br />
standard deviation of 10.2 pcf. The average void ratio and degree of saturation are 0.8 and 99%,<br />
respectively. Table 3 below summarizes these averaged properties.<br />
Table 3: Average of the Index Test Results<br />
MC %<br />
Total<br />
Density<br />
(PCF)<br />
Dry Density<br />
(PCF)<br />
Void Ratio<br />
Saturation<br />
(%)<br />
Specific<br />
Gravity<br />
Dam Fill 18.7 126.8 106.8 0.55 90.5 2.65<br />
Native Materials 21.2 127.3 105.0 0.60 94.7 2.70<br />
Sandstone<br />
Bedrock<br />
18.0 132.2 112.0 0.49 98.6 2.67<br />
Based upon review of the laboratory testing results, the native materials are expected to exhibit<br />
shear strength properties lower than the dam fill materials. Plates 8 through 11 show the<br />
variation of moisture content and total unit weight of the materials encountered in the borings<br />
XV-1 through XV-15.<br />
6.3 Liquefaction Potential/Loss of Shear Strength<br />
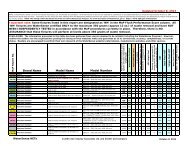
Plate 7 and Plate B-2 in Appendix B show the results of the Atterberg limits tests. Data points<br />
shown on this plate indicate that the materials fall under the CL (lean clay) and CH (fat clay)<br />
classification. Table B-2 in Appendix B includes results of the Atterberg limits tests and the insitu<br />
moisture content of the samples tested. The plasticity chart also shows three zones: A, B,<br />
and C. According to Seed (2003), soils in these zones are defined as follows:<br />
Zone A:<br />
Zone B:<br />
Zone C:<br />
Considered potentially susceptible to classic cyclically induced liquefaction.<br />
In some cases, can be susceptible to liquefaction (especially if their in-situ water<br />
content is greater than about 85 % of their liquid limit).<br />
Generally not susceptible to cyclically induced liquefaction.<br />
Table B-2 in Appendix B includes results of the Atterberg limits tests and the in-situ moisture<br />
content of the sample tested. Boring number, sample number, and elevation of the sample have<br />
also been provided. As the table indicates, of all the samples tested, none are susceptible to<br />
liquefaction.<br />
<strong>Seismic</strong> Stability Evaluation <strong>Report</strong><br />
<strong>Dingee</strong> <strong>Reservoir</strong> Dam<br />
13<br />
August 2008