Dingee Reservoir Final Seismic Report - East Bay Municipal Utility ...
Dingee Reservoir Final Seismic Report - East Bay Municipal Utility ...
Dingee Reservoir Final Seismic Report - East Bay Municipal Utility ...
- No tags were found...

Create successful ePaper yourself
Turn your PDF publications into a flip-book with our unique Google optimized e-Paper software.
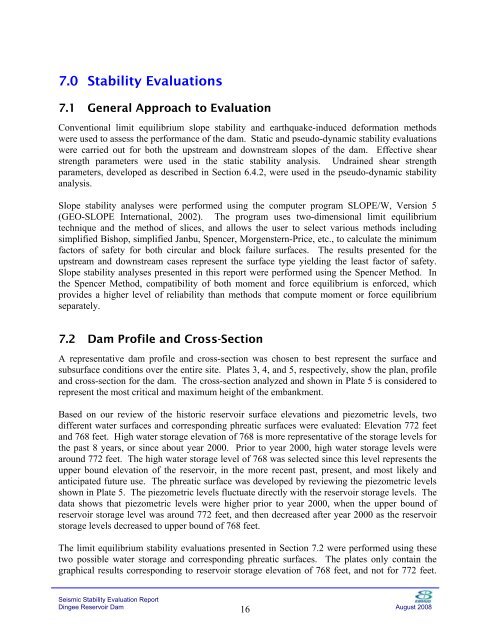
7.0 Stability Evaluations<br />
7.1 General Approach to Evaluation<br />
Conventional limit equilibrium slope stability and earthquake-induced deformation methods<br />
were used to assess the performance of the dam. Static and pseudo-dynamic stability evaluations<br />
were carried out for both the upstream and downstream slopes of the dam. Effective shear<br />
strength parameters were used in the static stability analysis. Undrained shear strength<br />
parameters, developed as described in Section 6.4.2, were used in the pseudo-dynamic stability<br />
analysis.<br />
Slope stability analyses were performed using the computer program SLOPE/W, Version 5<br />
(GEO-SLOPE International, 2002). The program uses two-dimensional limit equilibrium<br />
technique and the method of slices, and allows the user to select various methods including<br />
simplified Bishop, simplified Janbu, Spencer, Morgenstern-Price, etc., to calculate the minimum<br />
factors of safety for both circular and block failure surfaces. The results presented for the<br />
upstream and downstream cases represent the surface type yielding the least factor of safety.<br />
Slope stability analyses presented in this report were performed using the Spencer Method. In<br />
the Spencer Method, compatibility of both moment and force equilibrium is enforced, which<br />
provides a higher level of reliability than methods that compute moment or force equilibrium<br />
separately.<br />
7.2 Dam Profile and Cross-Section<br />
A representative dam profile and cross-section was chosen to best represent the surface and<br />
subsurface conditions over the entire site. Plates 3, 4, and 5, respectively, show the plan, profile<br />
and cross-section for the dam. The cross-section analyzed and shown in Plate 5 is considered to<br />
represent the most critical and maximum height of the embankment.<br />
Based on our review of the historic reservoir surface elevations and piezometric levels, two<br />
different water surfaces and corresponding phreatic surfaces were evaluated: Elevation 772 feet<br />
and 768 feet. High water storage elevation of 768 is more representative of the storage levels for<br />
the past 8 years, or since about year 2000. Prior to year 2000, high water storage levels were<br />
around 772 feet. The high water storage level of 768 was selected since this level represents the<br />
upper bound elevation of the reservoir, in the more recent past, present, and most likely and<br />
anticipated future use. The phreatic surface was developed by reviewing the piezometric levels<br />
shown in Plate 5. The piezometric levels fluctuate directly with the reservoir storage levels. The<br />
data shows that piezometric levels were higher prior to year 2000, when the upper bound of<br />
reservoir storage level was around 772 feet, and then decreased after year 2000 as the reservoir<br />
storage levels decreased to upper bound of 768 feet.<br />
The limit equilibrium stability evaluations presented in Section 7.2 were performed using these<br />
two possible water storage and corresponding phreatic surfaces. The plates only contain the<br />
graphical results corresponding to reservoir storage elevation of 768 feet, and not for 772 feet.<br />
<strong>Seismic</strong> Stability Evaluation <strong>Report</strong><br />
<strong>Dingee</strong> <strong>Reservoir</strong> Dam<br />
16<br />
August 2008