Dingee Reservoir Final Seismic Report - East Bay Municipal Utility ...
Dingee Reservoir Final Seismic Report - East Bay Municipal Utility ...
Dingee Reservoir Final Seismic Report - East Bay Municipal Utility ...
- No tags were found...

Create successful ePaper yourself
Turn your PDF publications into a flip-book with our unique Google optimized e-Paper software.
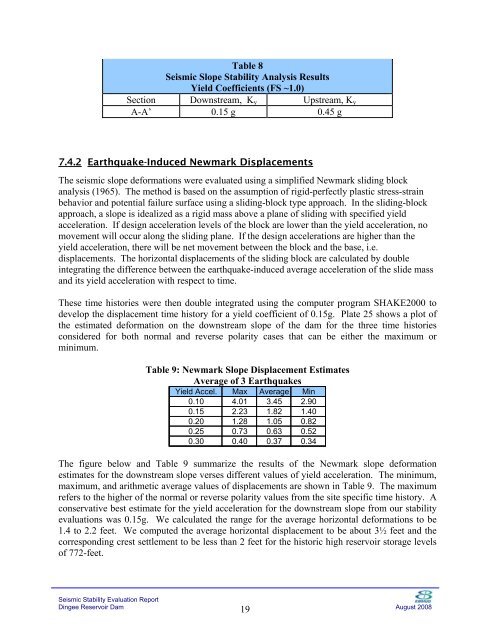
Table 8<br />
<strong>Seismic</strong> Slope Stability Analysis Results<br />
Yield Coefficients (FS ~1.0)<br />
Section Downstream, K y Upstream, K y<br />
A-A’ 0.15 g 0.45 g<br />
7.4.2 Earthquake-Induced Newmark Displacements<br />
The seismic slope deformations were evaluated using a simplified Newmark sliding block<br />
analysis (1965). The method is based on the assumption of rigid-perfectly plastic stress-strain<br />
behavior and potential failure surface using a sliding-block type approach. In the sliding-block<br />
approach, a slope is idealized as a rigid mass above a plane of sliding with specified yield<br />
acceleration. If design acceleration levels of the block are lower than the yield acceleration, no<br />
movement will occur along the sliding plane. If the design accelerations are higher than the<br />
yield acceleration, there will be net movement between the block and the base, i.e.<br />
displacements. The horizontal displacements of the sliding block are calculated by double<br />
integrating the difference between the earthquake-induced average acceleration of the slide mass<br />
and its yield acceleration with respect to time.<br />
These time histories were then double integrated using the computer program SHAKE2000 to<br />
develop the displacement time history for a yield coefficient of 0.15g. Plate 25 shows a plot of<br />
the estimated deformation on the downstream slope of the dam for the three time histories<br />
considered for both normal and reverse polarity cases that can be either the maximum or<br />
minimum.<br />
Table 9: Newmark Slope Displacement Estimates<br />
Average of 3 Earthquakes<br />
Yield Accel. Max Average Min<br />
0.10 4.01 3.45 2.90<br />
0.15 2.23 1.82 1.40<br />
0.20 1.28 1.05 0.82<br />
0.25 0.73 0.63 0.52<br />
0.30 0.40 0.37 0.34<br />
The figure below and Table 9 summarize the results of the Newmark slope deformation<br />
estimates for the downstream slope verses different values of yield acceleration. The minimum,<br />
maximum, and arithmetic average values of displacements are shown in Table 9. The maximum<br />
refers to the higher of the normal or reverse polarity values from the site specific time history. A<br />
conservative best estimate for the yield acceleration for the downstream slope from our stability<br />
evaluations was 0.15g. We calculated the range for the average horizontal deformations to be<br />
1.4 to 2.2 feet. We computed the average horizontal displacement to be about 3½ feet and the<br />
corresponding crest settlement to be less than 2 feet for the historic high reservoir storage levels<br />
of 772-feet.<br />
<strong>Seismic</strong> Stability Evaluation <strong>Report</strong><br />
<strong>Dingee</strong> <strong>Reservoir</strong> Dam<br />
19<br />
August 2008