ICICI Securities Limited Everest Kanto Cylinders (EVEKAN)
ICICI Securities Limited Everest Kanto Cylinders (EVEKAN)
ICICI Securities Limited Everest Kanto Cylinders (EVEKAN)

Create successful ePaper yourself
Turn your PDF publications into a flip-book with our unique Google optimized e-Paper software.
<strong>ICICI</strong> <strong>Securities</strong> <strong>Limited</strong><br />
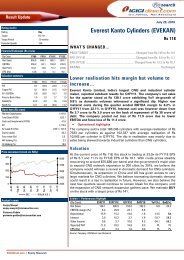
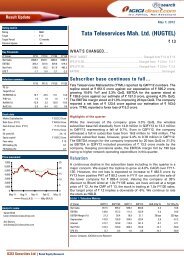
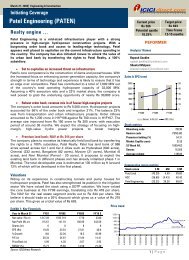
Exceptionally higher realization in Q2FY11 was on the back of<br />
special order received from the Indian Navy. The overall volume<br />
growth of the company has however been maintained.<br />
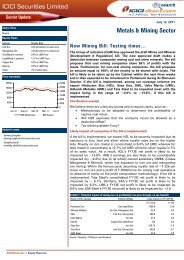
Demand from India and USA has declined, however, the demand<br />
growth in UAE (Dubai) and China has been robust projecting a<br />
brighter picture for the demand from these countries, going<br />
ahead.<br />
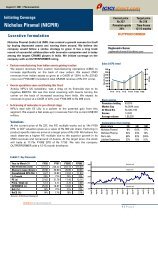
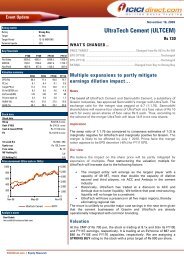
Though sales volume from India has improved, dip in realizations<br />
have pulled down the overall sales. However, the realizations from<br />
Dubai witnessed considerable improvement.<br />
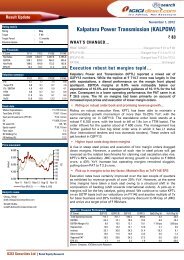
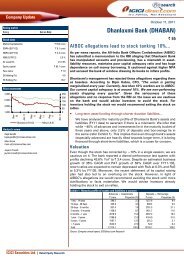
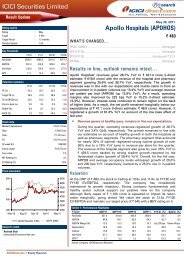
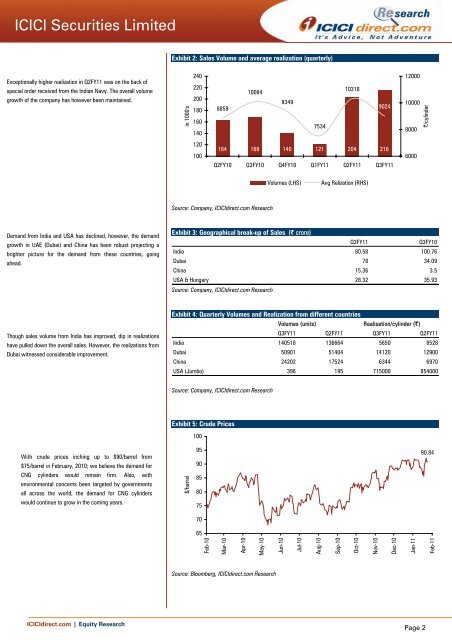
With crude prices inching up to $90/barrel from<br />
$75/barrel in February, 2010; we believe the demand for<br />
CNG cylinders would remain firm. Also, with<br />
environmental concerns been targeted by governments<br />
all across the world, the demand for CNG cylinders<br />
would continue to grow in the coming years.<br />
<strong>ICICI</strong>direct.com | Equity Research<br />
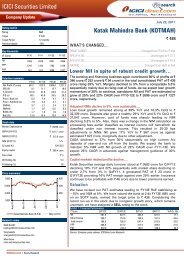
Exhibit 2: Sales Volume and average realization (quarterly)<br />
in 1000's<br />
240<br />
220<br />
200<br />
180<br />
160<br />
140<br />
120<br />
100<br />
8859<br />
10084<br />
9349<br />
7534<br />
10318<br />
9024<br />
164 168 140 121 204 216<br />
Q2FY10 Q3FY10 Q4FY10 Q1FY11 Q2FY11 Q3FY11<br />
Source: Company, <strong>ICICI</strong>direct.com Research<br />
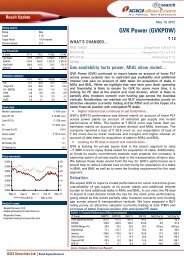
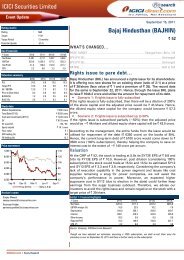
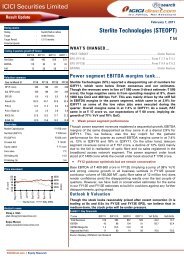
Exhibit 3: Geographical break-up of Sales (| crore)<br />
Volumes (LHS) Avg Relization (RHS)<br />
12000<br />
10000<br />
8000<br />
6000<br />
|/cylinder<br />
Q3FY11 Q3FY10<br />
India 80.58 100.76<br />
Dubai 78 34.09<br />
China 15.36 3.5<br />
USA & Hungary<br />
Source: Company, <strong>ICICI</strong>direct.com Research<br />
28.32 35.93<br />
Exhibit 4: Quarterly Volumes and Realization from different countries<br />
Volumes (units)<br />
Realisation/cylinder (|)<br />
Q3FY11 Q2FY11 Q3FY11 Q2FY11<br />
India 140518 136664 5650 8528<br />
Dubai 50901 51404 14120 12900<br />
China 24202 17524 6344 6970<br />
USA (Jumbo) 396 195 715000 854000<br />
Source: Company, <strong>ICICI</strong>direct.com Research<br />
Exhibit 5: Crude Prices<br />
$/barrel<br />
100<br />
95<br />
90<br />
85<br />
80<br />
75<br />
70<br />
65<br />
Feb-10<br />
Mar-10<br />
Apr-10<br />
May-10<br />
Source: Bloomberg, <strong>ICICI</strong>direct.com Research<br />
Jun-10<br />
Jul-10<br />
Aug-10<br />
Sep-10<br />
Oct-10<br />
Nov-10<br />
Dec-10<br />
Jan-11<br />
Page 2<br />
90.84<br />
Feb-11