Dhanlaxmi Bank (DHABAN)
Dhanlaxmi Bank (DHABAN)
Dhanlaxmi Bank (DHABAN)

Create successful ePaper yourself
Turn your PDF publications into a flip-book with our unique Google optimized e-Paper software.
Company Update<br />
Rating matrix<br />
Rating : Exit on Rally<br />
Stock data<br />
Market Capitalisation | 553 crore<br />
GNPA (Q1FY12) | 6.1 crore<br />
NNPA (Q1FY12) | 2.2 crore<br />
NIM (Q1FY12) 2.0 %<br />
52 week H/L 212 /55<br />
Equity capital | 85.1 crore<br />
Face value | 10<br />
DII Holding (%) 4.9<br />
FII Holding (%) 35.7<br />
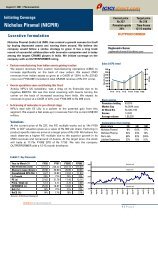
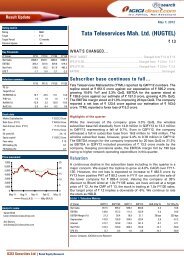
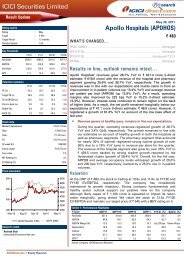
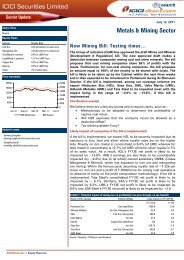
Price movement<br />
7,000<br />
5,000<br />
3,000<br />
1,000<br />
Nov-<br />
10<br />
Analyst’s name<br />
Jan-11<br />
Mar-<br />
11<br />
May-<br />
11<br />
Aug-<br />
11<br />
<strong>Dhanlaxmi</strong> (R.H.S) Nifty (L.H.S)<br />
Kajal Gandhi<br />
kajal.gandhi@icicisecurities.com<br />
Mani Arora<br />
mani.a@icicisecurities.com<br />
Jaymin Trivedi<br />
jaymin.trivedi@icicisecurities.com<br />
Oct-11<br />
250<br />
200<br />
150<br />
100<br />
50<br />
0<br />
ICICI Securities Ltd. | Retail Equity Research<br />
October 11, 2011<br />
<strong>Dhanlaxmi</strong> <strong>Bank</strong> (<strong>DHABAN</strong>)<br />
AIBOC allegations lead to stock tanking 10%...<br />
| 65<br />
As per news reports, the All-India <strong>Bank</strong> Officers Confederation (AIBOC)<br />
has submitted a memorandum to the RBI alleging that <strong>Dhanlaxmi</strong> <strong>Bank</strong><br />
has manipulated accounts and provisioning, has a mismatch in assetliability<br />
resources, maintains poor capital adequacy ratio and has huge<br />
dependence on call money borrowing. It cautioned against higher NPA<br />
and accused the bank of window dressing its books to inflate profits.<br />
<strong>Dhanlaxmi</strong>’s management has rejected these allegations regarding them<br />
as baseless. According to Bipin Kabra, CFO, “The union is getting<br />
marginalised every year. Currently, less than 10% workers are in AIBOC.<br />
Our current capital adequacy is at around 10%. We see non-performing<br />
assets dropping every quarter”. Given the seriousness of these<br />
allegations and no response from the RBI on the issue we are cautious<br />
on the bank and would advise investors to avoid the stock. For<br />
investors holding the stock we would recommend exiting the stock on<br />
rallies.<br />
� Long-term asset funding through shorter duration liabilities…<br />
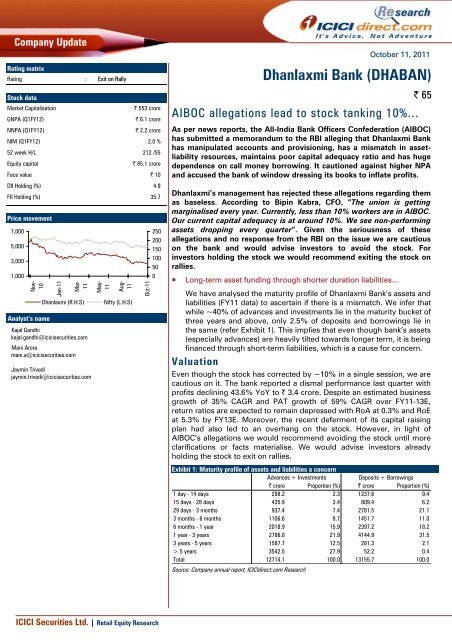
We have analysed the maturity profile of <strong>Dhanlaxmi</strong> <strong>Bank</strong>’s assets and<br />
liabilities (FY11 data) to ascertain if there is a mismatch. We infer that<br />
while ~40% of advances and investments lie in the maturity bucket of<br />
three years and above, only 2.5% of deposits and borrowings lie in<br />
the same (refer Exhibit 1). This implies that even though bank’s assets<br />
(especially advances) are heavily tilted towards longer term, it is being<br />
financed through short-term liabilities, which is a cause for concern.<br />
Valuation<br />
Even though the stock has corrected by ~10% in a single session, we are<br />
cautious on it. The bank reported a dismal performance last quarter with<br />
profits declining 43.6% YoY to | 3.4 crore. Despite an estimated business<br />
growth of 35% CAGR and PAT growth of 59% CAGR over FY11-13E,<br />
return ratios are expected to remain depressed with RoA at 0.3% and RoE<br />
at 5.3% by FY13E. Moreover, the recent deferment of its capital raising<br />
plan had also led to an overhang on the stock. However, in light of<br />
AIBOC’s allegations we would recommend avoiding the stock until more<br />
clarifications or facts materialise. We would advise investors already<br />
holding the stock to exit on rallies.<br />
Exhibit 1: Maturity profile of assets and liabilities a concern<br />
Advances + Investments Deposits + Borrowings<br />
| crore Proportion (%) | crore Proportion (%)<br />
1 day - 14 days 298.2 2.3 1237.6 9.4<br />
15 days - 28 days 435.9 3.4 809.4 6.2<br />
29 days - 3 months 937.4 7.4 2781.5 21.1<br />
3 months - 6 months 1106.6 8.7 1451.7 11.0<br />
6 months - 1 year 2018.9 15.9 2397.2 18.2<br />
1 year - 3 years 2786.8 21.9 4144.9 31.5<br />
3 years - 5 years 1587.7 12.5 281.3 2.1<br />
> 5 years 3542.5 27.9 52.2 0.4<br />
Total 12714.1 100.0 13155.7 100.0<br />
Source: Company annual report, ICICIdirect.com Research
ICICI Securities Ltd. | Retail Equity Research<br />
Exhibit 2: Balance Sheet<br />
| Crore FY09 FY10 FY11 FY12E FY13E<br />
Liabilities<br />
Capital 64.1 64.1 85.1 120.1 120.1<br />
Reserves and Surplus 360.4 376.0 759.5 1067.4 1123.4<br />
Networth 424.5 440.1 844.6 1187.6 1243.5<br />
Deposits 4968.8 7098.5 12529.6 16502.9 22767.1<br />
Borrowings 0.0 120.6 626.1 638.5 677.4<br />
Other Liabilities & Provisions 249.5 427.8 267.8 295.1 337.8<br />
Total 5642.8 8086.9 14268.2 18624.0 25025.8<br />
Assets<br />
Fixed Assets 46.2 79.5 134.4 80.2 173.3<br />
Investments 1567.4 2027.8 3639.7 4888.2 6651.8<br />
Advances 3196.1 5006.3 9065.2 12124.3 16526.6<br />
Other Assets 147.1 223.0 493.8 422.4 392.7<br />
Cash with RBI & call money 291.1 137.4 132.4 138.2 144.3<br />
Total 5642.8 8086.9 14268.2 18624.0 25025.8<br />
Source: Company annual report, ICICIdirect.com Research<br />
Exhibit 3: Profit and Loss Account<br />
| Crore FY09 FY10 FY11 FY12E FY13E<br />
Interest Earned 408.4 534.6 906.4 1423.6 2009.9<br />
Interest Expended 286.8 394.0 641.3 1012.9 1373.5<br />
Net Interest Income 121.6 140.5 265.1 410.7 636.4<br />
growth (%) 22.9 15.6 88.6 54.9 55.0<br />
Non Interest Income 79.4 91.0 146.8 154.8 185.7<br />
Net Income 201.0 231.5 411.9 565.5 822.1<br />
Operating expense 113.1 192.9 344.5 454.4 638.6<br />
Gross profit 87.9 38.6 67.4 111.1 183.6<br />
Provisions 8.2 10.9 27.7 66.6 90.9<br />
Taxes 22.2 4.4 13.7 9.6 27.8<br />
Net Profit 57.4 23.2 26.0 34.9 64.8<br />
growth (%) 101.8 -59.6 12.1 34.2 85.6<br />
Source: Company annual reports, ICICIdirect.com Research<br />
Exhibit 4: Key Financial Ratios<br />
FY10 FY11 FY12E FY13E<br />
Net Profit (| crore) 23.2 26.0 34.9 64.8<br />
EPS (|) 3.6 3.3 2.9 5.4<br />
Growth (%) -59.6 -15.6 -4.9 85.6<br />
P/E (x) 17.9 21.3 22.3 12.0<br />
ABV (|) 62.1 96.0 95.7 98.3<br />
Price / Book (x) 0.9 0.7 0.7 0.6<br />
Price / Adj Book (x) 1.0 0.7 0.7 0.7<br />
GNPA (%) 1.5 0.7 0.9 0.9<br />
NNPA (%) 0.8 0.3 0.3 0.4<br />
RoNA (%) 0.3 0.2 0.2 0.3<br />
RoE (%) 5.4 4.1 3.4 5.3<br />
Source: Company annual reports, ICICIdirect.com Research<br />
Page 2
ICICIdirect.com coverage universe (<strong>Bank</strong>ing)<br />
[[[[[<br />
Public Sector <strong>Bank</strong>s<br />
<strong>Bank</strong> of India<br />
NP (| Cr) EPS (|) PE (x) P/ABV (x) RoNA (%) RoE(%)<br />
Idirect Code BANIND CMP 326 FY11 2488.7 45.5 7.2 1.3 0.8 15.8<br />
Target 352 FY12E 2549.1 46.6 7.0 1.3 0.7 14.0<br />
Mcap (| Cr)<br />
<strong>Bank</strong> of Baroda<br />
17145 Upside (%) 8.0 FY13E 3364.3 61.5 5.3 1.1 0.8 16.9<br />
Idirect Code BANBAR CMP 742 FY11 4241.7 108.0 6.9 1.6 1.3 23.5<br />
Target 954 FY12E 4952.8 126.1 5.9 1.3 1.3 21.4<br />
Mcap (| Cr)<br />
Dena <strong>Bank</strong><br />
27122 Upside (%) 28.6 FY13E 5925.5 150.9 4.9 1.1 1.3 21.3<br />
Idirect Code DENBAN CMP 74 FY11 611.6 21.3 3.5 0.8 1.0 21.2<br />
Target 120 FY12E 726.4 25.3 2.9 0.7 0.9 18.6<br />
Mcap (| Cr) 2467 Upside (%) 62.2 FY13E 847.3 29.5 2.5 0.6 0.9 18.7<br />
Indian Overseas <strong>Bank</strong><br />
Idirect Code INDOVE CMP 95 FY11 1072.5 17.3 5.5 0.9 0.7 14.8<br />
Target 128 FY12E 1269.0 18.2 5.2 0.8 0.6 13.8<br />
Mcap (| Cr)<br />
IDBI <strong>Bank</strong><br />
5176 Upside (%) 34.7 FY13E 1655.4 23.7 4.0 0.7 0.7 15.2<br />
Idirect Code IDBI CMP 101 FY11 1650.3 18.4 5.5 1.1 0.7 15.8<br />
Target 160 FY12E 1972.0 20.0 5.0 1.0 0.7 14.7<br />
Mcap (| Cr)<br />
OBC<br />
9944 Upside (%) 58.4 FY13E 2367.2 24.0 4.2 0.8 0.8 15.6<br />
Idirect Code ORIBAN CMP 293 FY11 1502.9 45.3 6.5 1.1 0.9 14.5<br />
Target 410 FY12E 1707.4 51.5 5.7 0.9 1.0 17.9<br />
Mcap (| Cr) 8548 Upside (%) 39.9 FY13E 2178.5 58.5 5.0 0.8 1.0 14.5<br />
Punjab National <strong>Bank</strong><br />
Idirect Code PUNBAN CMP 952 FY11 4433.5 124.9 7.6 1.7 1.3 22.6<br />
Target 1050 FY12E 4942.9 156.0 6.1 1.4 1.2 21.0<br />
Mcap (| Cr)<br />
SBI<br />
30161 Upside (%) 10.3 FY13E 6157.9 194.4 4.9 1.1 1.3 21.8<br />
Idirect Code STABAN CMP 1765 FY11 82.7 130.2 13.6 2.1 0.7 12.6<br />
Target 2200 FY12E 95.3 139.1 12.7 1.8 0.7 13.0<br />
Mcap (| Bn)<br />
Syndicate <strong>Bank</strong><br />
112077 Upside (%) 24.6 FY13E 136.9 199.8 8.8 1.5 0.9 15.7<br />
Idirect Code SYNBN CMP 100 FY11 1047.9 18.3 5.5 1.0 0.7 16.5<br />
Target 124 FY12E 1277.2 22.3 4.5 0.9 0.8 17.0<br />
Mcap (| Cr) 5732 Upside (%) 24.0 FY13E 1612.3 28.1 3.6 0.8 0.8 19.3<br />
Union <strong>Bank</strong> of India<br />
Idirect Code UNIBAN CMP 241 FY11 2081.9 39.7 6.1 1.4 1.0 20.9<br />
Target 278 FY12E 2410.6 46.0 5.2 1.2 0.9 19.9<br />
Mcap (| Cr) 12636 Upside (%) 15.4 FY13E 2715.6 51.8 4.7 0.9 0.9 19.0<br />
Private Sector <strong>Bank</strong>s<br />
Axis <strong>Bank</strong><br />
Idirect Code UTIBAN CMP 1053 FY11 3388.5 83.0 12.7 2.3 1.7 20.1<br />
Target 1331 FY12E 4055.0 98.8 10.7 2.0 1.5 19.6<br />
Mcap (| Cr)<br />
City Union <strong>Bank</strong><br />
43230 Upside (%) 26.4 FY13E 4968.2 121.0 8.7 1.7 1.5 20.3<br />
Idirect Code CITUNI CMP 43 FY11 215.1 5.3 8.1 1.8 1.6 23.5<br />
Target 52 FY12E 285.7 6.7 6.4 1.4 1.7 24.2<br />
Mcap (| Cr)<br />
<strong>Dhanlaxmi</strong> <strong>Bank</strong><br />
1728 Upside (%) 20.4 FY13E 361.3 8.5 5.1 1.1 1.8 23.8<br />
Idirect Code <strong>DHABAN</strong> CMP 65 FY11 26.0 3.3 19.6 0.7 0.2 4.1<br />
Target - FY12E 35.3 2.9 22.1 0.6 0.2 3.2<br />
Mcap (| Cr)<br />
DCB<br />
553 Upside (%) - FY13E 65.8 5.5 11.9 0.6 0.3 4.7<br />
Idirect Code DCB CMP 39 FY11 21.4 1.1 36.4 1.5 0.3 3.9<br />
Target 60 FY12E 39.9 1.8 22.0 1.2 0.5 6.1<br />
Mcap (| Cr)<br />
Federal <strong>Bank</strong><br />
781 Upside (%) 53.8 FY13E 46.7 1.9 20.8 1.1 0.5 5.5<br />
Idirect Code FEDBAN CMP 369 FY11 587.1 34.3 10.8 1.3 1.5 13.5<br />
Target 472 FY12E 689.0 40.3 9.2 1.2 1.2 13.2<br />
Mcap (| Cr) 6308 Upside (%) 27.9 FY13E 865.9 50.6 7.3 1.2 1.3 15.8<br />
ICICI Securities Ltd. | Retail Equity Research<br />
Page 3
Continued…<br />
HDFC <strong>Bank</strong><br />
NP (| Cr) EPS (|) PE (x) P/ABV (x) RoNA (%) RoE(%)<br />
Idirect Code HDFBAN CMP 458 FY11 3926.4 16.9 27.1 4.2 1.6 16.7<br />
Target 532 FY12E 5074.3 21.8 21.0 3.8 1.7 18.7<br />
Mcap (| Cr)<br />
Kotak <strong>Bank</strong><br />
106435 Upside (%) 16.2 FY13E 6590.2 28.3 16.2 3.3 1.9 21.3<br />
Idirect Code KOTMAH CMP 453 FY11 818.3 11.1 40.5 5.0 1.9 14.5<br />
Target 436 FY12E 1006.0 13.7 33.0 4.4 1.9 13.9<br />
Mcap (| Cr)<br />
South Indian <strong>Bank</strong><br />
33380 Upside (%) -3.8 FY13E 1221.3 16.6 27.2 3.9 1.9 14.8<br />
Idirect Code SOUIN0 CMP 22 FY11 292.5 2.6 8.3 1.5 1.0 18.5<br />
Target 26 FY12E 352.3 2.4 9.1 1.1 1.0 15.3<br />
Mcap (| Cr)<br />
Yes <strong>Bank</strong><br />
2435 Upside (%) 20.6 FY13E 430.2 2.9 7.4 1.0 1.0 14.0<br />
Idirect Code YESBAN CMP 264 FY11 727.1 20.9 12.6 2.4 1.5 21.1<br />
Target 369 FY12E 921.0 25.3 10.4 1.9 1.3 20.6<br />
Mcap (| Cr) 9165 Upside (%) 39.8 FY13E 1306.4 34.1 7.7 1.5 1.5 21.6<br />
ICICI Securities Ltd. | Retail Equity Research<br />
Page 4
RATING RATIONALE<br />
ICICIdirect.com endeavours to provide objective opinions and recommendations. ICICIdirect.com assigns<br />
ratings to its stocks according to their notional target price vs. current market price and then categorises them<br />
as Strong Buy, Buy, Hold and Sell. The performance horizon is two years unless specified and the notional<br />
target price is defined as the analysts' valuation for a stock.<br />
Strong Buy: >15%/20% for large caps / midcaps, respectively;<br />
Buy: Between 10% and 15%/20% for large caps / midcaps, respectively;<br />
Hold: Up to +/-10%;<br />
Sell: -10% or more;<br />
Pankaj Pandey Head – Research pankaj.pandey@icicisecurities.com<br />
ANALYST CERTIFICATION<br />
ICICIdirect.com Research Desk,<br />
ICICI Securities Limited,<br />
1 st Floor, Akruti Trade Centre,<br />
Road No. 7, MIDC,<br />
Andheri (East)<br />
Mumbai – 400 093<br />
research@icicidirect.com<br />
We /I, Kajal Gandhi CA Mani Arora MBA Jaymin Trivedi MBA-CM research analysts, authors and the names subscribed to this report, hereby certify that all of the views expressed in this research report<br />
accurately reflect our personal views about any and all of the subject issuer(s) or securities. We also certify that no part of our compensation was, is, or will be directly or indirectly related to the specific<br />
recommendation(s) or view(s) in this report. Analysts aren't registered as research analysts by FINRA and might not be an associated person of the ICICI Securities Inc.<br />
Disclosures:<br />
ICICI Securities Limited (ICICI Securities) and its affiliates are a full-service, integrated investment banking, investment management and brokerage and financing group. We along with affiliates are leading<br />
underwriter of securities and participate in virtually all securities trading markets in India. We and our affiliates have investment banking and other business relationship with a significant percentage of<br />
companies covered by our Investment Research Department. Our research professionals provide important input into our investment banking and other business selection processes. ICICI Securities<br />
generally prohibits its analysts, persons reporting to analysts and their dependent family members from maintaining a financial interest in the securities or derivatives of any companies that the analysts<br />
cover.<br />
The information and opinions in this report have been prepared by ICICI Securities and are subject to change without any notice. The report and information contained herein is strictly confidential and<br />
meant solely for the selected recipient and may not be altered in any way, transmitted to, copied or distributed, in part or in whole, to any other person or to the media or reproduced in any form, without<br />
prior written consent of ICICI Securities. While we would endeavour to update the information herein on reasonable basis, ICICI Securities, its subsidiaries and associated companies, their directors and<br />
employees (“ICICI Securities and affiliates”) are under no obligation to update or keep the information current. Also, there may be regulatory, compliance or other reasons that may prevent ICICI Securities<br />
from doing so. Non-rated securities indicate that rating on a particular security has been suspended temporarily and such suspension is in compliance with applicable regulations and/or ICICI Securities<br />
policies, in circumstances where ICICI Securities is acting in an advisory capacity to this company, or in certain other circumstances.<br />
This report is based on information obtained from public sources and sources believed to be reliable, but no independent verification has been made nor is its accuracy or completeness guaranteed. This<br />
report and information herein is solely for informational purpose and may not be used or considered as an offer document or solicitation of offer to buy or sell or subscribe for securities or other financial<br />
instruments. Though disseminated to all the customers simultaneously, not all customers may receive this report at the same time. ICICI Securities will not treat recipients as customers by virtue of their<br />
receiving this report. Nothing in this report constitutes investment, legal, accounting and tax advice or a representation that any investment or strategy is suitable or appropriate to your specific<br />
circumstances. The securities discussed and opinions expressed in this report may not be suitable for all investors, who must make their own investment decisions, based on their own investment<br />
objectives, financial positions and needs of specific recipient. This may not be taken in substitution for the exercise of independent judgment by any recipient. The recipient should independently evaluate<br />
the investment risks. The value and return of investment may vary because of changes in interest rates, foreign exchange rates or any other reason. ICICI Securities and affiliates accept no liabilities for any<br />
loss or damage of any kind arising out of the use of this report. Past performance is not necessarily a guide to future performance. Investors are advised to see Risk Disclosure Document to understand the<br />
risks associated before investing in the securities markets. Actual results may differ materially from those set forth in projections. Forward-looking statements are not predictions and may be subject to<br />
change without notice.<br />
ICICI Securities and its affiliates might have managed or co-managed a public offering for the subject company in the preceding twelve months. ICICI Securities and affiliates might have received<br />
compensation from the companies mentioned in the report during the period preceding twelve months from the date of this report for services in respect of public offerings, corporate finance, investment<br />
banking or other advisory services in a merger or specific transaction. It is confirmed that Kajal Gandhi CA Mani Arora MBA Jaymin Trivedi MBA-CM research analysts and the authors of this report have<br />
not received any compensation from the companies mentioned in the report in the preceding twelve months. Our research professionals are paid in part based on the profitability of ICICI Securities, which<br />
include earnings from Investment <strong>Bank</strong>ing and other business.<br />
ICICI Securities or its subsidiaries collectively do not own 1% or more of the equity securities of the Company mentioned in the report as of the last day of the month preceding the publication of the<br />
research report.<br />
It is confirmed that Kajal Gandhi CA Mani Arora MBA Jaymin Trivedi MBA-CM research analysts and the authors of this report or any of their family members does not serve as an officer, director or<br />
advisory board member of the companies mentioned in the report.<br />
ICICI Securities may have issued other reports that are inconsistent with and reach different conclusion from the information presented in this report. ICICI Securities and affiliates may act upon or make use<br />
of information contained in the report prior to the publication thereof.<br />
This report is not directed or intended for distribution to, or use by, any person or entity who is a citizen or resident of or located in any locality, state, country or other jurisdiction, where such distribution,<br />
publication, availability or use would be contrary to law, regulation or which would subject ICICI Securities and affiliates to any registration or licensing requirement within such jurisdiction. The securities<br />
described herein may or may not be eligible for sale in all jurisdictions or to certain category of investors. Persons in whose possession this document may come are required to inform themselves of and<br />
to observe such restriction.<br />
ICICI Securities Ltd. | Retail Equity Research<br />
Page 5