ICICI Securities Limited Apollo Hospitals (APOHOS)
ICICI Securities Limited Apollo Hospitals (APOHOS)
ICICI Securities Limited Apollo Hospitals (APOHOS)

You also want an ePaper? Increase the reach of your titles
YUMPU automatically turns print PDFs into web optimized ePapers that Google loves.
<strong>ICICI</strong> <strong>Securities</strong> <strong>Limited</strong><br />
Result Update<br />
Rating matrix<br />
Rating : Buy<br />
Target : | 545<br />
Target Period : 12 months<br />
Potential Upside : 13%<br />
Key Financials<br />
FY10 FY11 FY12E FY13E<br />
Net Sales 2026.5 2605.3 3241.0 4077.3<br />
EBITDA 301.3 418.9 502.4 615.7<br />
Net Profit 130.0 174.0 251.0 277.3<br />
EPS 11.1 14.7 20.9 22.2<br />
Valuation summary<br />
FY10 FY11 FY12E FY13E<br />
PE (x) 43.3 32.7 23.0 21.7<br />
Target PE (x) 48.9 37.0 26.0 24.5<br />
EV to EBITDA (x) 22.5 16.2 13.5 11.0<br />
Price to book (x) 3.8 3.4 2.9 2.6<br />
RoNW (%) 6.9 8.7 12.5 10.5<br />
RoCE (%) 7.3 10.1 10.5 11.4<br />
Stock data<br />
Market Capitalisation |.6,011 Crore<br />
Debt |.958 Crore<br />
Cash |.178 Crore<br />
EV |.6,791 Crore<br />
52 week H/L 599/353<br />
Equity capital |.62.4 Crore<br />
Face value |.5<br />
MF Holding (%) 3.1<br />
FII Holding (%) 29.4<br />
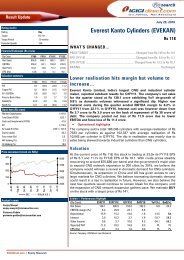
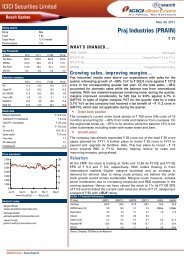
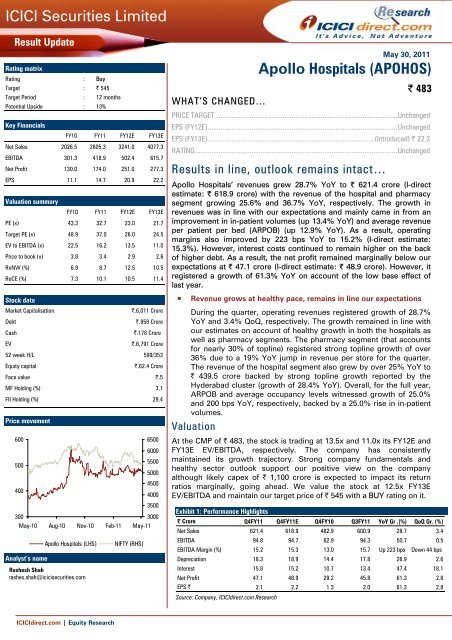
Price movement<br />
600<br />
6500<br />
6000<br />
500<br />
5500<br />
5000<br />
4500<br />
400<br />
4000<br />
3500<br />
300<br />
3000<br />
May-10 Aug-10 Nov-10 Feb-11 May-11<br />
Analyst’s name<br />
<strong>Apollo</strong> <strong>Hospitals</strong> (LHS) NIFTY (RHS)<br />
Rashesh Shah<br />
rashes.shah@icicisecurities.com<br />
<strong>ICICI</strong>direct.com | Equity Research<br />
WHAT’S CHANGED…<br />
May 30, 2011<br />
PRICE TARGET ....................................................................................................Unchanged<br />
EPS (FY12E)........................................................................................................Unchanged<br />
EPS (FY13E)........................................................................................... (Introduced) | 22.2<br />
RATING...............................................................................................................Unchanged<br />
Results in line, outlook remains intact…<br />
<strong>Apollo</strong> <strong>Hospitals</strong>’ revenues grew 28.7% YoY to | 621.4 crore (I-direct<br />
estimate: | 618.9 crore) with the revenue of the hospital and pharmacy<br />
segment growing 25.6% and 36.7% YoY, respectively. The growth in<br />
revenues was in line with our expectations and mainly came in from an<br />
improvement in in-patient volumes (up 13.4% YoY) and average revenue<br />
per patient per bed (ARPOB) (up 12.9% YoY). As a result, operating<br />
margins also improved by 223 bps YoY to 15.2% (I-direct estimate:<br />
15.3%). However, interest costs continued to remain higher on the back<br />
of higher debt. As a result, the net profit remained marginally below our<br />
expectations at | 47.1 crore (I-direct estimate: | 48.9 crore). However, it<br />
registered a growth of 61.3% YoY on account of the low base effect of<br />
last year.<br />
� Revenue grows at healthy pace, remains in line our expectations<br />
During the quarter, operating revenues registered growth of 28.7%<br />
YoY and 3.4% QoQ, respectively. The growth remained in line with<br />
our estimates on account of healthy growth in both the hospitals as<br />
well as pharmacy segments. The pharmacy segment (that accounts<br />
for nearly 30% of topline) registered strong topline growth of over<br />
36% due to a 19% YoY jump in revenue per store for the quarter.<br />
The revenue of the hospital segment also grew by over 25% YoY to<br />
| 439.5 crore backed by strong topline growth reported by the<br />
Hyderabad cluster (growth of 28.4% YoY). Overall, for the full year,<br />
ARPOB and average occupancy levels witnessed growth of 25.0%<br />
and 200 bps YoY, respectively, backed by a 25.0% rise in in-patient<br />
volumes.<br />
Valuation<br />
<strong>Apollo</strong> <strong>Hospitals</strong> (<strong>APOHOS</strong>)<br />
| 483<br />
At the CMP of | 483, the stock is trading at 13.5x and 11.0x its FY12E and<br />
FY13E EV/EBITDA, respectively. The company has consistently<br />
maintained its growth trajectory. Strong company fundamentals and<br />
healthy sector outlook support our positive view on the company<br />
although likely capex of | 1,100 crore is expected to impact its return<br />
ratios marginally, going ahead. We value the stock at 12.5x FY13E<br />
EV/EBITDA and maintain our target price of | 545 with a BUY rating on it.<br />
Exhibit 1: Performance Highlights<br />
| Crore Q4FY11 Q4FY11E Q4FY10 Q3FY11 YoY Gr .(%) QoQ Gr. (%)<br />
Net Sales 621.4 618.9 482.9 600.9 28.7 3.4<br />
EBITDA 94.8 94.7 62.9 94.3 50.7 0.5<br />
EBITDA Margin (%) 15.2 15.3 13.0 15.7 Up 223 bps Down 44 bps<br />
Depreciation 18.3 18.9 14.4 17.8 26.9 2.6<br />
Interest 15.8 15.2 10.7 13.4 47.4 18.1<br />
Net Profit 47.1 48.9 29.2 45.8 61.3 2.8<br />
EPS | 2.1 2.2 1.3 2.0 61.3 2.8<br />
Source: Company, <strong>ICICI</strong>direct.com Research
<strong>ICICI</strong> <strong>Securities</strong> <strong>Limited</strong><br />
The Chennai cluster reported lower growth of 20.4% in<br />
revenues on account of moderate growth of 8.5% in inpatient<br />
volumes. In Hyderabad, it reported growth of 25.1%<br />
in total revenues mainly backed by 13.4% and 26.9% rise in<br />
in-patient and outpatient volumes<br />
The revenue per store has increased by 19% YoY as<br />
against growth of 22.3% YoY reported in the last quarter<br />
We will continue to remain cautious until we see a<br />
sustainable operational turnaround of the pharmacy<br />
business that in the medium-term remains a key<br />
challenge for the company<br />
<strong>ICICI</strong>direct.com | Equity Research<br />
Exhibit 2: Hospital performance<br />
Particulars<br />
AHEL Standalone Chennai Cluster Hyderabad Cluster Others*<br />
(|. Cr) FY10 FY11 Growth FY10 FY11 Growth FY10 FY11 Growth FY10 FY11 Growth<br />
Inpatient volume 144,218 163,525 13.4 65,220 70,766 8.5 36,029 39,776 10.4 42,969 52,983 23.3<br />
Outpatent volume 386,490 490,379 26.9 198,997 226,373 13.8 84,799 113,413 33.7 102,694 150,593 46.6<br />
Inpatient ALOS (days) 5.15 5.04 -2.1 4.67 4.67 0.0 4.74 4.82 1.7 6.22 5.64 -9.3<br />
Occupancy (%) 73.0 75.0 200.0 75.0 82.0 700.0 70.0 65.0 -500.0 73.0 73.0 0.0<br />
ARPOB (Rs. Per day) 17,769 20,063 12.9 21,552 23,907 10.9 13,229 15,114 14.2 7,540 9,405 24.7<br />
Inpatient Revenue 11,122 13,899 25.0 5,129 6,176 20.4 1,925 2,471 28.4 1711 2349 37.3<br />
Outpatient Revenue 2,080 2,623 26.1 1441 1730 20.1 334 430 28.7 305.0 463 51.8<br />
Total Revenue 13,202 16,522 25.1 6570 7906 20.3 2,259 2,901 28.4 2016 2812 39.5<br />
Source: Company, <strong>ICICI</strong>direct.com Research<br />
* Others include Madurai, Mysore, Vishakhapatnam, Pune, Karur, Karimnagar, Bilaspur and Bhubaneshwar.<br />
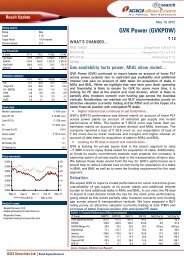
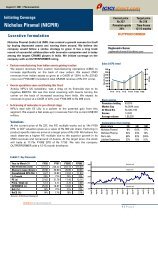
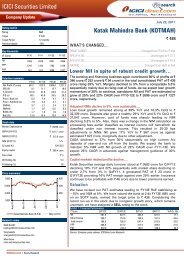
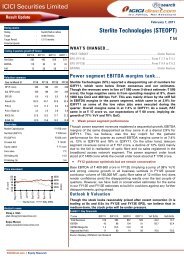
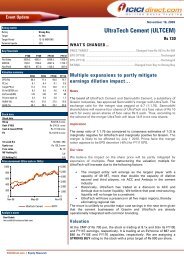
Pharmacy division performance improves during the quarter<br />
During the quarter, the pharmacy segment reported an operating profit of<br />
| 2.4 crore as against negative EBITDA reported last year on account of a<br />
19% YoY jump in revenue per store (i.e. | 15.2 lakh) and better cost<br />
control management. Overall, net revenues in this segment grew by over<br />
36% YoY to | 182.1 crore. There has been a net addition of 57 pharmacy<br />
outlets during the quarter. Despite the improved performance of the<br />
pharmacy segment in this quarter, we continue to remain cautious until<br />
we see a sustainable operational turnaround of the pharmacy business<br />
that in the medium term remains a key challenge for the company.<br />
Exhibit 3: No of pharmacy outlets<br />
Nos<br />
1400<br />
1200<br />
1000<br />
800<br />
600<br />
400<br />
200<br />
883<br />
1.1<br />
922<br />
1.1<br />
972<br />
1.2<br />
1,035 1,049 1,066<br />
1.3<br />
1.3<br />
1.3<br />
1110<br />
1.5<br />
1199<br />
1,142<br />
1.5<br />
1.5<br />
Q4FY09 Q1FY10 Q2FY10 Q3FY10 Q4FY10 Q1FY11 Q2FY11 Q3FY11 Q4FY11<br />
Source: Company, <strong>ICICI</strong>direct.com Research<br />
No of Stores (LHS) Revenue per store (RHS)<br />
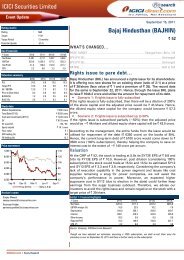
Exhibit 4: Trends in operating margins of pharmacy business<br />
|. crore<br />
190.0<br />
140.0<br />
90.0<br />
40.0<br />
-10.0<br />
99.5<br />
-4.6<br />
-4.6<br />
118.9<br />
-1.9 -2.1<br />
-2.2<br />
131.7<br />
-2.7<br />
133.6<br />
0.1<br />
139.5<br />
-2.0<br />
166.3<br />
1.8<br />
173.4<br />
0.3<br />
182.1<br />
0.2 3.0 0.5 2.4<br />
-2.8<br />
Q1FY10 Q2FY10 Q3FY10 Q4FY10 Q1FY11 Q2FY11 Q3FY11 Q4FY11<br />
Source: Company, <strong>ICICI</strong>direct.com Research<br />
Revenues EBITDA EBITDA margin (%)<br />
1<br />
2.0<br />
0.0<br />
-2.0<br />
-4.0<br />
-6.0<br />
-8.0<br />
1.6<br />
1.5<br />
1.4<br />
1.3<br />
1.2<br />
1.1<br />
1.0<br />
-10.0<br />
|. mn<br />
%<br />
Page 2
<strong>ICICI</strong> <strong>Securities</strong> <strong>Limited</strong><br />
The financial performance of associate /JVs continued to<br />
remain subdued in Q2FY11<br />
<strong>ICICI</strong>direct.com | Equity Research<br />
Performance of associate/JVs continues to remain subdued<br />
The performance of <strong>Apollo</strong> Health Street and <strong>Apollo</strong> Munich continued to<br />
remain subdued at the operating level. <strong>Apollo</strong> Health Street reported a<br />
42.2% YoY decline in net profits led by a subdued topline and higher<br />
interest burden. On the other hand, though <strong>Apollo</strong> Munich reported a<br />
strong growth in topline, its operating loss for the quarter continued to<br />
remain negative although it was lower compared to last year.<br />
Exhibit 5: Performance of JVs/associates<br />
<strong>Apollo</strong> Health Street* <strong>Apollo</strong> Munich Health Insurance**<br />
|. Crore FY10 FY11 Growth (%) FY10 FY11 Growth (%)<br />
Total Revenue 460.9 447.6 (2.9)<br />
70 164.7 135.3<br />
EBITDA 35.2 52 47.7 -92.1 -70.5 NA<br />
EBITDA Margins (%) 7.6 11.6 398bps NA NA NA<br />
PAT 8.3 4.8 (42.2)<br />
* Owns 39.38% of <strong>Apollo</strong> Healthstreet<br />
** Owns 11.01% of <strong>Apollo</strong> DKV Insurance<br />
Source: Company, <strong>ICICI</strong>direct.com Research<br />
Future expansion plans<br />
-89.7 -79.4 NA<br />
The company is adding over 2,400 beds over a period of three years. This<br />
involves a total capex of | 1100 crore. Since <strong>Apollo</strong> <strong>Hospitals</strong> is adding<br />
capacity mainly through the greenfield route, its return ratios are<br />
expected to get impacted marginally over the next one and half years as<br />
the full benefits of this capex would be available to the company only<br />
after FY13. The detailed schedule of its planned capex is mentioned<br />
herein.<br />
Exhibit 6: Capex plans<br />
Sr No Location Type* Beds<br />
Project cost**<br />
(| Crore)<br />
Amt spent (|<br />
Crore)<br />
Exp.<br />
Completion<br />
Owned projects<br />
1 Hyderabad - Internal Exp NA 100 122.5 122.5 May-11<br />
2 Hyderguda SS 175 44.3 34.0 June-11<br />
3 Nellore RH 200 66.7 9.4 Feb-13<br />
4 Ayanambakkam RH 200 70.0 9.8 Feb-13<br />
5 Nasik RH 125 52.0 6.9 Oct-12<br />
6 Chennai -Expansion NA 30 10.0 0.0 Sep-12<br />
7 Belapur SS 350 350.0 72.7 June-13<br />
8 Byculla SS 300 140.0 0.0 June-13<br />
9 Bilaspur - Expansion NA NA 8.0 0.0 Sep-12<br />
10 Vizag SS 300 115.0 8.0 June-13<br />
11 Trichy RH 200 65.5 14.0 Mar-13<br />
Owned projects<br />
12 MLCP - Car parking NA NA 8.3 1.2 Sep-12<br />
13 Thane SS 250 50.0 0.0 Mar-13<br />
14 Bangalore - Expansion NA 52 6.0 0.0 May-11<br />
15 New Delhi - Expansion NA 136 0.0 0.0 Sep-11<br />
Total 2418 1108.3 278.5<br />
Note<br />
* SS- Superspeciality, RH- Reach Hospital<br />
** Total project cost for JVs/Associates represents AHEL's share only<br />
Source: Company, <strong>ICICI</strong>direct.com Research<br />
Page 3
<strong>ICICI</strong> <strong>Securities</strong> <strong>Limited</strong><br />
<strong>ICICI</strong>direct.com Coverage Universe (<strong>Hospitals</strong>)<br />
<strong>Apollo</strong> <strong>Hospitals</strong> Sales (| crore) EPS (|) PE (x) EV/E (x) RoNW (%) RoCE (%)<br />
Idirect Code <strong>APOHOS</strong> CMP 483 FY11 2605.4 14.7 32.8 16.2 7.9 9.4<br />
<strong>ICICI</strong>direct.com | Equity Research<br />
Target 545 FY12E 3241.1 21.0 23.0 13.5 11.3 11.0<br />
Mcap (| crore) 6,010.5 Upside (%) 12.8% FY13E 4077.2 22.2 21.7 11.0<br />
Fortis Health Sales (| crore) EPS (|) PE (x) EV/E (x) RoNW (%) RoCE (%)<br />
Idirect Code FORHEA CMP 161 FY10 937.9 2.2 67.1 38.8 3.3 1.4<br />
Target 165 FY11E 1457.2 2.8 52.9 25.6 3.6 1.9<br />
Mcap (| crore) 5,954.4 Upside (%) 2.5% FY12E 1843.9 4.7 31.6 20.0 6.0 3.8<br />
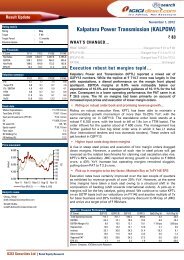
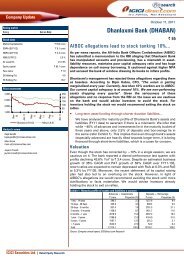
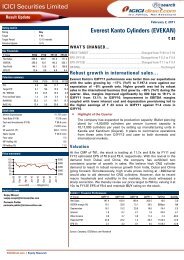
Exhibit 7: Recommendation History<br />
600<br />
550<br />
500<br />
450<br />
400<br />
350<br />
300<br />
May-10<br />
ADD, TP |.405<br />
Jun-10<br />
Jul-10<br />
Aug-10<br />
Sep-10<br />
Source: Company, <strong>ICICI</strong>direct.com Research<br />
ADD, TP |.440<br />
Oct-10<br />
Nov-10<br />
BUY, TP |.610<br />
Dec-10<br />
<strong>Apollo</strong> <strong>Hospitals</strong> (LHS)<br />
Jan-11<br />
Feb-11<br />
BUY, TP |.545<br />
Mar-11<br />
Apr-11<br />
May-11<br />
Page 4
<strong>ICICI</strong> <strong>Securities</strong> <strong>Limited</strong><br />
RATING RATIONALE<br />
<strong>ICICI</strong>direct.com endeavours to provide objective opinions and recommendations. <strong>ICICI</strong>direct.com assigns<br />
ratings to its stocks according to their notional target price vs. current market price and then categorises them<br />
as Strong Buy, Buy, Hold and Sell. The performance horizon is two years unless specified and the notional<br />
target price is defined as the analysts' valuation for a stock.<br />
Strong Buy: >15%/20% for large caps / midcaps, respectively;<br />
Buy: Between 10% and 15%/20% for large caps / midcaps, respectively;<br />
Hold: Up to +/-10%;<br />
Sell: -10% or more;<br />
ANALYST CERTIFICATION<br />
<strong>ICICI</strong>direct.com | Equity Research<br />
Pankaj Pandey Head – Research<br />
<strong>ICICI</strong>direct.com Research Desk,<br />
<strong>ICICI</strong> <strong>Securities</strong> <strong>Limited</strong>,<br />
7 th Floor, Akruti Centre Point,<br />
MIDC Main Road, Marol Naka,<br />
Andheri (East)<br />
Mumbai – 400 093<br />
research@icicidirect.com<br />
pankaj.pandey@icicisecurities.com<br />
We /I, Rashesh Shah CA research analysts, authors and the names subscribed to this report, hereby certify that all of the views expressed in this research report accurately reflect our personal views about<br />
any and all of the subject issuer(s) or securities. We also certify that no part of our compensation was, is, or will be directly or indirectly related to the specific recommendation(s) or view(s) in this report.<br />
Analysts aren't registered as research analysts by FINRA and might not be an associated person of the <strong>ICICI</strong> <strong>Securities</strong> Inc.<br />
Disclosures:<br />
<strong>ICICI</strong> <strong>Securities</strong> <strong>Limited</strong> (<strong>ICICI</strong> <strong>Securities</strong>) and its affiliates are a full-service, integrated investment banking, investment management and brokerage and financing group. We along with affiliates are leading<br />
underwriter of securities and participate in virtually all securities trading markets in India. We and our affiliates have investment banking and other business relationship with a significant percentage of<br />
companies covered by our Investment Research Department. Our research professionals provide important input into our investment banking and other business selection processes. <strong>ICICI</strong> <strong>Securities</strong><br />
generally prohibits its analysts, persons reporting to analysts and their dependent family members from maintaining a financial interest in the securities or derivatives of any companies that the analysts<br />
cover.<br />
The information and opinions in this report have been prepared by <strong>ICICI</strong> <strong>Securities</strong> and are subject to change without any notice. The report and information contained herein is strictly confidential and<br />
meant solely for the selected recipient and may not be altered in any way, transmitted to, copied or distributed, in part or in whole, to any other person or to the media or reproduced in any form, without<br />
prior written consent of <strong>ICICI</strong> <strong>Securities</strong>. While we would endeavour to update the information herein on reasonable basis, <strong>ICICI</strong> <strong>Securities</strong>, its subsidiaries and associated companies, their directors and<br />
employees (“<strong>ICICI</strong> <strong>Securities</strong> and affiliates”) are under no obligation to update or keep the information current. Also, there may be regulatory, compliance or other reasons that may prevent <strong>ICICI</strong> <strong>Securities</strong><br />
from doing so. Non-rated securities indicate that rating on a particular security has been suspended temporarily and such suspension is in compliance with applicable regulations and/or <strong>ICICI</strong> <strong>Securities</strong><br />
policies, in circumstances where <strong>ICICI</strong> <strong>Securities</strong> is acting in an advisory capacity to this company, or in certain other circumstances.<br />
This report is based on information obtained from public sources and sources believed to be reliable, but no independent verification has been made nor is its accuracy or completeness guaranteed. This<br />
report and information herein is solely for informational purpose and may not be used or considered as an offer document or solicitation of offer to buy or sell or subscribe for securities or other financial<br />
instruments. Though disseminated to all the customers simultaneously, not all customers may receive this report at the same time. <strong>ICICI</strong> <strong>Securities</strong> will not treat recipients as customers by virtue of their<br />
receiving this report. Nothing in this report constitutes investment, legal, accounting and tax advice or a representation that any investment or strategy is suitable or appropriate to your specific<br />
circumstances. The securities discussed and opinions expressed in this report may not be suitable for all investors, who must make their own investment decisions, based on their own investment<br />
objectives, financial positions and needs of specific recipient. This may not be taken in substitution for the exercise of independent judgment by any recipient. The recipient should independently evaluate<br />
the investment risks. The value and return of investment may vary because of changes in interest rates, foreign exchange rates or any other reason. <strong>ICICI</strong> <strong>Securities</strong> and affiliates accept no liabilities for any<br />
loss or damage of any kind arising out of the use of this report. Past performance is not necessarily a guide to future performance. Investors are advised to see Risk Disclosure Document to understand the<br />
risks associated before investing in the securities markets. Actual results may differ materially from those set forth in projections. Forward-looking statements are not predictions and may be subject to<br />
change without notice.<br />
<strong>ICICI</strong> <strong>Securities</strong> and its affiliates might have managed or co-managed a public offering for the subject company in the preceding twelve months. <strong>ICICI</strong> <strong>Securities</strong> and affiliates might have received<br />
compensation from the companies mentioned in the report during the period preceding twelve months from the date of this report for services in respect of public offerings, corporate finance, investment<br />
banking or other advisory services in a merger or specific transaction. <strong>ICICI</strong> <strong>Securities</strong> and affiliates expect to receive compensation from the companies mentioned in the report within a period of three<br />
months following the date of publication of the research report for services in respect of public offerings, corporate finance, investment banking or other advisory services in a merger or specific<br />
transaction. It is confirmed that Rashesh Shah Rashesh Shah CA,research analysts and the authors of this report have not received any compensation from the companies mentioned in the report<br />
in the preceding twelve months. Our research professionals are paid in part based on the profitability of <strong>ICICI</strong> <strong>Securities</strong>, which include earnings from Investment Banking and other business.<br />
<strong>ICICI</strong> <strong>Securities</strong> or its subsidiaries collectively do not own 1% or more of the equity securities of the Company mentioned in the report as of the last day of the month preceding the publication of the<br />
research report.<br />
It is confirmed that Rashesh Shah Rashesh Shah CA research analysts and the authors of this report or any of their family members does not serve as an officer, director or advisory board member of the<br />
companies mentioned in the report.<br />
<strong>ICICI</strong> <strong>Securities</strong> may have issued other reports that are inconsistent with and reach different conclusion from the information presented in this report. <strong>ICICI</strong> <strong>Securities</strong> and affiliates may act upon or make use<br />
of information contained in the report prior to the publication thereof.<br />
This report is not directed or intended for distribution to, or use by, any person or entity who is a citizen or resident of or located in any locality, state, country or other jurisdiction, where such distribution,<br />
publication, availability or use would be contrary to law, regulation or which would subject <strong>ICICI</strong> <strong>Securities</strong> and affiliates to any registration or licensing requirement within such jurisdiction. The securities<br />
described herein may or may not be eligible for sale in all jurisdictions or to certain category of investors. Persons in whose possession this document may come are required to inform themselves of and<br />
to observe such restriction.<br />
Page 5