ICICI Securities Limited Sterlite Technologies (STEOPT)
ICICI Securities Limited Sterlite Technologies (STEOPT)
ICICI Securities Limited Sterlite Technologies (STEOPT)

Create successful ePaper yourself
Turn your PDF publications into a flip-book with our unique Google optimized e-Paper software.
<strong>ICICI</strong> <strong>Securities</strong> <strong>Limited</strong><br />
Result Update<br />
Rating matrix<br />
Rating : Switch/Sell on rallies<br />
Target : Under Review<br />
Target Period : 12-15 months<br />
Potential Upside : -<br />
Trailing 4 quarters growth (| Crore)<br />
Q4FY10 Q1FY11 Q2FY11 Q3FY11<br />
Net Sales 662 492 509 579<br />
EBITDA 110 83 91 43<br />
PAT 72 56 58 17<br />
Valuation summary<br />
Year to March 31 FY10 FY11E FY12E FY13E<br />
NP (| crore) 246 168 241 320<br />
Adj. NP(| crore) 246 168 241 320<br />
EPS (|) 6.9 4.5 6.5 8.6<br />
Growth (%) 152.3 -34.7 43.0 32.4<br />
P/E (x) 12.4 11.2 9.2 9.2<br />
Price / Book (x) 3.3 2.5 2.0 2.0<br />
ROCE (%) 27.8 16.2 17.7 21.3<br />
RoNA (%)<br />
Stock data<br />
32.0 15.8 18.2 19.9<br />
Market Capitalisation | 1970 crore<br />
Net Debt (Q3FY11) | 490crore<br />
EV (Q3FY11) |2420 crore<br />
52 week H/L | 124/51<br />
Equity capital | 71 crore<br />
Face value | 2<br />
DII Holding (%) 14.0<br />
FII Holding (%) 5.6<br />
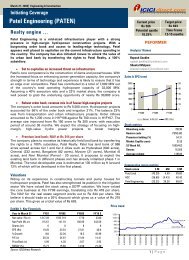
Price movement<br />
(| crore) .<br />
135<br />
115<br />
95<br />
75<br />
55<br />
35<br />
May-10<br />
Jun-10<br />
Analyst’s name<br />
Jul-10<br />
Sep-10<br />
Chirag J. Shah<br />
shah.chirag@icicisecurities.com<br />
Oct-10<br />
Dec-10<br />
<strong>ICICI</strong>direct.com | Equity Research<br />
Jan-11<br />
<strong>Sterlite</strong> Tech Nifty (RHS)<br />
Sanjay Manyal<br />
sanjay.manyal@icicisecurities.com<br />
8000<br />
6000<br />
4000<br />
2000<br />
0<br />
(Index) .<br />
WHAT’S CHANGED…<br />
February 1, 2011<br />
<strong>Sterlite</strong> <strong>Technologies</strong> (<strong>STEOPT</strong>)<br />
PRICE TARGET ..........................................................................................Under Review<br />
EPS (FY11E) ..................................................................................... From | 7.7 to | 4.1<br />
EPS (FY12E) ...................................................................................... From | 9.4 to | 6.2<br />
RATING .....................................................................................................Under Review<br />
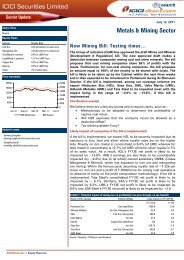
Power segment EBITDA margins tank…<br />
<strong>Sterlite</strong> <strong>Technologies</strong> (STL) reported a disappointing set of numbers for<br />
Q3FY11, which were below Street consensus and our estimates.<br />
Though the revenues were in line at | 580 crore (I-direct estimate: | 595<br />
crore), the huge negative came in from operating margins at 8%, down<br />
1000 bps QoQ and 460 bps YoY. This was mainly driven by the stiff fall<br />
in EBITDA margins in the power segment, which came in at 2.9% for<br />
Q3FY11 as some of the low value jobs were executed during the<br />
quarter. Overall margins came in at 7.4% in Q3FY11. As a result, PAT<br />
came in at | 17 crore vs. our expectations of | 60 crore, implying degrowth<br />
of 77% YoY and 70% QoQ.<br />
� Weak power segment performance<br />
Though power segment revenues registered a sequential growth, EBITDA<br />
margins of the same disappointed as they came in at a dismal 2.9% for<br />
Q3FY11. This, we believe, was the key culprit for the pathetic<br />
performance for the quarter as overall EBITDA margins came in at 7.4%<br />
vs. 12% in Q3FY10 and 18% in Q2FY11. On the other hand, telecom<br />
segment revenues came in at | 157 crore, a decline of 12% QoQ mainly<br />
due to the fall in realisation of optic fibre and no sales registered in the<br />
broadband access network segment. The power segment order book<br />
stood at | 1400 crore while the overall order book stood at | 1700 crore.<br />
� FY12 guidance optimistic but we remain conservative<br />
| 54<br />
Base EBITDA of | 400-500 crore in FY12E (implying a jump of 38% YoY)<br />
and strong volume growth in all business verticals in FY12E (power<br />
conductor volume of 160,000 MT, optic fibre sales of 12 million km) does<br />
render confidence amid the disappointing results over the last couple of<br />
quarters. However, we have built in conservative estimates for the same<br />
in our FY12E and FY13E estimates to build in cushions against any further<br />
disappointments, going ahead.<br />
Outlook & Valuation<br />
Though the stock looks reasonably priced after recent correction (it is<br />
trading at 8x and 6.5x its FY12E and FY13E EPS), we believe that in<br />
medium-term, the stock price will be under pressure.<br />
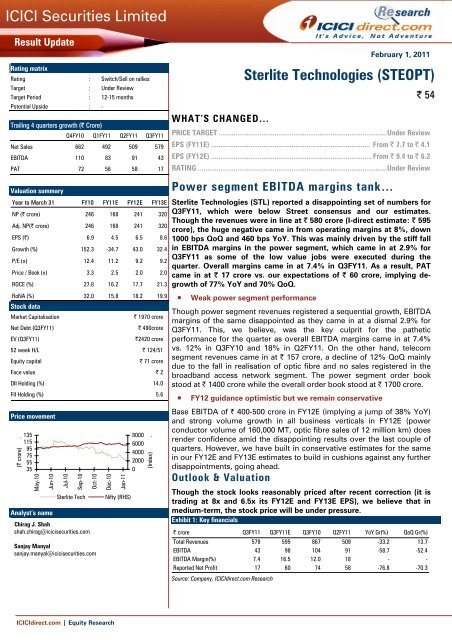
Exhibit 1: Key financials<br />
| crore Q3FY11 Q3FY11E Q3FY10 Q2FY11 YoY Gr(%) QoQ Gr(%)<br />
Total Revenues 579 595 867 509 -33.2 13.7<br />
EBITDA 43 98 104 91 -58.7 -52.4<br />
EBITDA Margin(%) 7.4 16.5 12.0 18 - -<br />
Reported Net Profit 17 60 74 58 -76.8 -70.3<br />
Source: Company, <strong>ICICI</strong>direct.com Research
<strong>ICICI</strong> <strong>Securities</strong> <strong>Limited</strong><br />
<strong>ICICI</strong>direct.com | Equity Research<br />
A negative surprise for the quarter came in the form of dismal power<br />
segment margins, which came in as low as 2.9% vs. our double digit<br />
expectations. The correction in the stock price over the last couple of<br />
months has more than factored in the negatives given the guidance of<br />
the management for FY12E. However, at the same time, we expect the<br />
stock to languish in the near to medium term.<br />
Though the stock looks reasonably priced after the recent correction (it<br />
is trading at 8x and 6.5x its FY12E and FY13E EPS), we believe that in<br />
the medium-term, the stock price will be under pressure owing to the<br />
dismal Q3FY11 performance, volatility in earnings QoQ and highly<br />
volatile market conditions. Hence, we are tempering down our<br />
expectations and advising investors to switch/sell on rallies. We feel<br />
that there are better opportunities available given the broader<br />
correction in the markets particularly large caps and quality midcaps.<br />
Page 2
<strong>ICICI</strong> <strong>Securities</strong> <strong>Limited</strong><br />
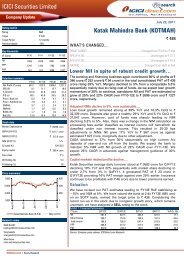
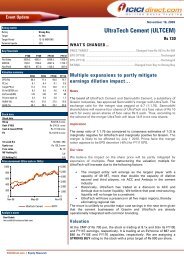
The order book of STL stood at | 1700 crore in Q3FY11.<br />
Of the total order book, the power transmission<br />
business order book was at | 1,400 crore<br />
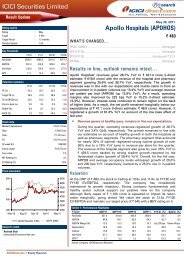
Revenues grew at a moderate rate of -33% YoY and 14%<br />
QoQ to | 579 crore in Q3FY11. The telecom segment<br />
disappointed in terms of revenues due to the fall in<br />
realisations from the optic fibre segment<br />
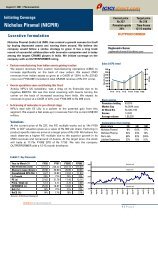
Power transmission revenues grew 28% QoQ whereas<br />
telecom segment revenues de-grew 12% QoQ due to the<br />
fall in optic fibre realisations and no sales in the<br />
broadband access network segment<br />
<strong>ICICI</strong>direct.com | Equity Research<br />
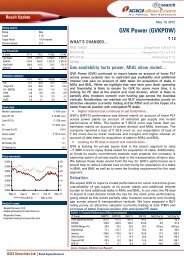
Exhibit 2: Trend of order book<br />
(| crore) .<br />
3,000<br />
2,250<br />
1,500<br />
750<br />
0<br />
1,320<br />
Q2FY09<br />
1,415 1,370<br />
Q3FY09<br />
Q4FY09<br />
Source: Company, <strong>ICICI</strong>direct.com Research<br />
Exhibit 3: Trend of revenues<br />
(| crore) .<br />
1,000<br />
750<br />
500<br />
250<br />
0<br />
666 642<br />
578<br />
1,600<br />
Q1FY10<br />
436<br />
1,725<br />
Q2FY10<br />
466<br />
2,150<br />
Q3FY10<br />
867<br />
2,400<br />
Q4FY10<br />
662<br />
2,600<br />
Q1FY11<br />
492<br />
2,200<br />
Q2FY11<br />
509<br />
1,700<br />
Q2FY09 Q3FY09 Q4FY09 Q1FY10 Q2FY10 Q3FY10 Q4FY10 Q1FY11 Q2FY11 Q3FY11<br />
Source: Company, <strong>ICICI</strong>direct.com Research<br />
Exhibit 4: Trend of segment-wise sales<br />
(| crore) .<br />
600<br />
450<br />
300<br />
150<br />
0<br />
388<br />
278<br />
Q2FY09<br />
427<br />
215<br />
Q3FY09<br />
401<br />
177<br />
Q4FY09<br />
Source: Company, <strong>ICICI</strong>direct.com Research<br />
296<br />
329<br />
140 136<br />
Q1FY10<br />
Q2FY10<br />
419<br />
448<br />
Q3FY10<br />
Power Telecom<br />
480<br />
182<br />
Q4FY10<br />
340 330<br />
152<br />
Q1FY11<br />
Q2FY11<br />
579<br />
422<br />
179 157<br />
Q2FY11<br />
Q3FY11<br />
Page 3
<strong>ICICI</strong> <strong>Securities</strong> <strong>Limited</strong><br />
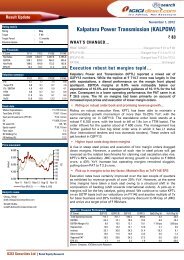
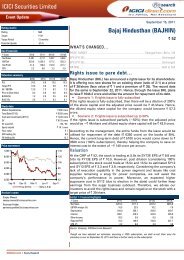
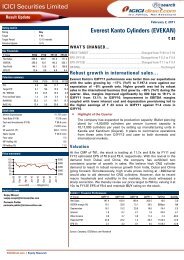
EBITDA margins have declined 460 bps YoY in Q3FY11 due<br />
to execution of low margin orders in the power segment,<br />
which pulled the overall margins to 7.4% in Q3FY11<br />
<strong>ICICI</strong>direct.com | Equity Research<br />
Exhibit 5: Trend of EBITDA margin<br />
(%)<br />
35<br />
30<br />
25<br />
20<br />
15<br />
10<br />
5<br />
0<br />
Q2FY09 Q3FY09 Q4FY09 Q1FY10 Q2FY10 Q3FY10 Q4FY10 Q1FY11 Q2FY11 Q3FY11<br />
Source: Company, <strong>ICICI</strong>direct.com Research<br />
Estimate changes<br />
Power Telecom Overall<br />
Though the management has given a robust FY12 guidance, we have<br />
built in conservative estimates for FY12E and FY13E given the huge<br />
volatility and disappointment in earnings over the last couple of<br />
quarterly results. We have revised our FY11E and FY12E sales volume<br />
assumptions for both the power transmission and telecom products &<br />
solution businesses. We expect the volumes in the power division to<br />
grow at a CAGR of 18% over FY11E-FY13E. We also expect volumes in<br />
the telecom segment to grow at a CAGR of 36% over FY11E-FY13 given<br />
that new capacity addition will come into play.<br />
Due to disappointing EBITDA margins in Q3FY11, we have revised down<br />
our estimates. We have reduced our FY11E-12E revenue estimates by<br />
16% and 14%, respectively, and our FY11E-12E PAT estimates by 41%<br />
and 31%, respectively (Note: our earlier and current estimates are lower<br />
than consensus estimates).<br />
Exhibit 6: Changes in earning estimates<br />
FY11E FY12E<br />
(| crore) New Old % change New Old % change<br />
Sales 2,171 2602 16.6 2,727 3174 14.1<br />
EBITDA 299 433 30.8 393 513 23.4<br />
PAT 168 286 41.3 241 350 31.0<br />
Source: Company, <strong>ICICI</strong>direct.com Research<br />
Page 4
<strong>ICICI</strong> <strong>Securities</strong> <strong>Limited</strong><br />
<strong>ICICI</strong>direct.com | Equity Research<br />
Exhibit 7: Financial Summary<br />
Year to March 31 FY09 FY10 FY11E FY12E FY13E<br />
NP (| crore) 91 246 168 241 320<br />
Adj. NP(| crore) 91 246 168 241 320<br />
EPS (|) 2.7 6.9 4.5 6.5 8.6<br />
Growth (%) 152.3 -34.7 43.0 32.4<br />
P/E (x) 20.2 12.4 11.2 9.2 9.2<br />
Price / Book (x) 2.9 3.3 2.5 2.0 2.0<br />
ROCE (%) 16.5 27.8 16.2 17.7 21.3<br />
RoNA (%) 15.3 32.0 15.8 18.2 19.9<br />
Source: Company, <strong>ICICI</strong>direct.com Research<br />
Given the weak performance over the past few quarters, we have tried to<br />
construct the valuation matrix depending on the various business and<br />
market driven parameters. We expect the stock to trade between our<br />
projections of Bear case and Base Case target prices .i.e. between | 45<br />
and | 75 per share in the medium term. For this reason we recommend<br />
the investors to switch/sell on rallies as there are relatively better<br />
opportunities present in large and quality mid caps after the recent<br />
correction/volatility in the markets.<br />
Exhibit 8: Valuation Scenarios<br />
Bear Case Base Case Bull Case<br />
Order Inflows Weak In line Hihger than expected<br />
Expansion in margins Tepid Normative High<br />
Disocutning of earnings FY11E EPS FY12E EPS FY13E EPS<br />
P/E mulitple accretion (x) 10 12 13<br />
EPS for respective years(| 4.5 6.5 8.6<br />
Target Price (|)<br />
Source: Company, <strong>ICICI</strong>direct.com Research<br />
45.2 74.3 111.2<br />
Page 5
<strong>ICICI</strong> <strong>Securities</strong> <strong>Limited</strong><br />
<strong>ICICI</strong>direct.com coverage universe (Capital Goods)<br />
BHEL<br />
NP (| Cr) EPS (|) PE (x) P/BV (x) RoCE (%) RoE(%)<br />
THERMA CMP 2200 FY10 4311 88.2 25.0 6.9 37.5 29.2<br />
Target 2641 FY11E 5155 105.4 20.9 5.7 39.3 29.9<br />
Mcap (| Cr) 110514 Upside (%) 20.0 FY12E 6504 133.0 16.5 4.6 36.3 27.3<br />
Thermax<br />
NP (| Cr) EPS (|) PE (x) P/BV (x) RoCE (%) RoE(%)<br />
Idirect Code THERMA CMP 677 FY10 141 11.9 57.0 7.7 34.2 14.1<br />
Target 730 FY11E 363 33.2 20.4 6.0 43.3 31.2<br />
Mcap (| Cr) 7901 Upside (%) 7.8 FY12E 518 39.5 17.1 5.0 45.3 35.3<br />
BGR Energy<br />
NP (| Cr) EPS (|) PE (x) P/ABV (x) RoCE (%) RoE(%)<br />
Idirect Code BGRENE CMP 560 FY10 201.0 27.9 20.1 7.9 23.0 31.8<br />
Target UR FY11E 304.8 42.3 13.2 5.9 25.2 36.9<br />
Mcap (| Cr) 4032 Upside (%) - FY12E 372.0 52.7 10.6 4.5 23.6 33.8<br />
Hindustan Dorr Oliver<br />
NP (| Cr) EPS (|) PE (x) P/BV (x) RoCE (%) RoE(%)<br />
Idirect Code HINDOR CMP 90 FY10 56 7.7 11.7 2.9 38.6 27.8<br />
Target UR FY11E 79 11.0 8.2 2.2 36.0 30.4<br />
Mcap (| Cr) 648 Upside (%) - FY12E 106 14.7 6.1 1.7 36.2 31.0<br />
<strong>Sterlite</strong> <strong>Technologies</strong><br />
NP (| Cr) EPS (|) PE (x) P/BV (x) RoCE (%) RoE(%)<br />
Idirect Code <strong>STEOPT</strong> CMP 54 FY10 246 7.0 7.7 2.1 27.8 32.0<br />
Target UR FY11E 170 4.8 11.2 1.6 24.5 26.1<br />
Mcap (| Cr) 1917 Upside (%) - FY12E 241 6.8 7.9 1.2 23.0 24.1<br />
Source: Company, <strong>ICICI</strong>direct.com Research<br />
<strong>ICICI</strong>direct.com | Equity Research<br />
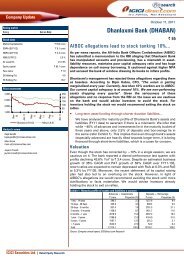
Exhibit 9: Recommendation History<br />
140<br />
120<br />
100<br />
80<br />
60<br />
40<br />
20<br />
0<br />
May-10<br />
May-10<br />
Jun-10<br />
Initiaing Coverage: CMP-|95<br />
TP: |125 (Strong Buy)<br />
Jun-10<br />
Jun-10<br />
Jul-10<br />
Jul-10<br />
Source: Company, <strong>ICICI</strong>direct.com Research<br />
Aug-10<br />
Aug-10<br />
Sep-10<br />
Sep-10<br />
Oct-10<br />
Oct-10<br />
Q3FY11: CMP-|<br />
54<br />
Nov-10<br />
Nov-10<br />
Nov-10<br />
Dec-10<br />
Dec-10<br />
Jan-11<br />
Jan-11<br />
Page 6
<strong>ICICI</strong> <strong>Securities</strong> <strong>Limited</strong><br />
RATING RATIONALE<br />
<strong>ICICI</strong>direct.com endeavours to provide objective opinions and recommendations. <strong>ICICI</strong>direct.com assigns<br />
ratings to its stocks according to their notional target price vs. current market price and then categorises them<br />
as Strong Buy, Buy, Add, Reduce and Sell. The performance horizon is two years unless specified and the<br />
notional target price is defined as the analysts' valuation for a stock.<br />
Strong Buy: 20% or more;<br />
Buy: Between 10% and 20%;<br />
Add: Up to 10%;<br />
Reduce: Up to -10%<br />
Sell: -10% or more;<br />
ANALYST CERTIFICATION<br />
<strong>ICICI</strong>direct.com | Equity Research<br />
Pankaj Pandey Head – Research pankaj.pandey@icicisecurities.com<br />
<strong>ICICI</strong>direct.com Research Desk,<br />
<strong>ICICI</strong> <strong>Securities</strong> <strong>Limited</strong>,<br />
7 th Floor, Akruti Centre Point,<br />
MIDC Main Road, Marol Naka,<br />
Andheri (East)<br />
Mumbai – 400 093<br />
research@icicidirect.com<br />
We /I, Chirag Shah PGDBM, Sanjay Manyal MBA research analysts, authors and the names subscribed to this report, hereby certify that all of the views expressed in this research report accurately reflect<br />
our personal views about any and all of the subject issuer(s) or securities. We also certify that no part of our compensation was, is, or will be directly or indirectly related to the specific recommendation(s)<br />
or view(s) in this report. Analysts aren't registered as research analysts by FINRA and might not be an associated person of the <strong>ICICI</strong> <strong>Securities</strong> Inc.<br />
Disclosures:<br />
<strong>ICICI</strong> <strong>Securities</strong> <strong>Limited</strong> (<strong>ICICI</strong> <strong>Securities</strong>) and its affiliates are a full-service, integrated investment banking, investment management and brokerage and financing group. We along with affiliates are leading<br />
underwriter of securities and participate in virtually all securities trading markets in India. We and our affiliates have investment banking and other business relationship with a significant percentage of<br />
companies covered by our Investment Research Department. Our research professionals provide important input into our investment banking and other business selection processes. <strong>ICICI</strong> <strong>Securities</strong><br />
generally prohibits its analysts, persons reporting to analysts and their dependent family members from maintaining a financial interest in the securities or derivatives of any companies that the analysts<br />
cover.<br />
The information and opinions in this report have been prepared by <strong>ICICI</strong> <strong>Securities</strong> and are subject to change without any notice. The report and information contained herein is strictly confidential and<br />
meant solely for the selected recipient and may not be altered in any way, transmitted to, copied or distributed, in part or in whole, to any other person or to the media or reproduced in any form, without<br />
prior written consent of <strong>ICICI</strong> <strong>Securities</strong>. While we would endeavour to update the information herein on reasonable basis, <strong>ICICI</strong> <strong>Securities</strong>, its subsidiaries and associated companies, their directors and<br />
employees (“<strong>ICICI</strong> <strong>Securities</strong> and affiliates”) are under no obligation to update or keep the information current. Also, there may be regulatory, compliance or other reasons that may prevent <strong>ICICI</strong> <strong>Securities</strong><br />
from doing so. Non-rated securities indicate that rating on a particular security has been suspended temporarily and such suspension is in compliance with applicable regulations and/or <strong>ICICI</strong> <strong>Securities</strong><br />
policies, in circumstances where <strong>ICICI</strong> <strong>Securities</strong> is acting in an advisory capacity to this company, or in certain other circumstances.<br />
This report is based on information obtained from public sources and sources believed to be reliable, but no independent verification has been made nor is its accuracy or completeness guaranteed. This<br />
report and information herein is solely for informational purpose and may not be used or considered as an offer document or solicitation of offer to buy or sell or subscribe for securities or other financial<br />
instruments. Though disseminated to all the customers simultaneously, not all customers may receive this report at the same time. <strong>ICICI</strong> <strong>Securities</strong> will not treat recipients as customers by virtue of their<br />
receiving this report. Nothing in this report constitutes investment, legal, accounting and tax advice or a representation that any investment or strategy is suitable or appropriate to your specific<br />
circumstances. The securities discussed and opinions expressed in this report may not be suitable for all investors, who must make their own investment decisions, based on their own investment<br />
objectives, financial positions and needs of specific recipient. This may not be taken in substitution for the exercise of independent judgment by any recipient. The recipient should independently evaluate<br />
the investment risks. The value and return of investment may vary because of changes in interest rates, foreign exchange rates or any other reason. <strong>ICICI</strong> <strong>Securities</strong> and affiliates accept no liabilities for any<br />
loss or damage of any kind arising out of the use of this report. Past performance is not necessarily a guide to future performance. Investors are advised to see Risk Disclosure Document to understand the<br />
risks associated before investing in the securities markets. Actual results may differ materially from those set forth in projections. Forward-looking statements are not predictions and may be subject to<br />
change without notice.<br />
<strong>ICICI</strong> <strong>Securities</strong> and its affiliates might have managed or co-managed a public offering for the subject company in the preceding twelve months. <strong>ICICI</strong> <strong>Securities</strong> and affiliates might have received<br />
compensation from the companies mentioned in the report during the period preceding twelve months from the date of this report for services in respect of public offerings, corporate finance, investment<br />
banking or other advisory services in a merger or specific transaction. <strong>ICICI</strong> <strong>Securities</strong> and affiliates expect to receive compensation from the companies mentioned in the report within a period of three<br />
months following the date of publication of the research report for services in respect of public offerings, corporate finance, investment banking or other advisory services in a merger or specific<br />
transaction. It is confirmed that , Chirag Shah PGDBM, Sanjay Manyal MBA research analysts and the authors of this report have not received any compensation from the companies mentioned in the<br />
report in the preceding twelve months. Our research professionals are paid in part based on the profitability of <strong>ICICI</strong> <strong>Securities</strong>, which include earnings from Investment Banking and other business.<br />
<strong>ICICI</strong> <strong>Securities</strong> or its subsidiaries collectively do not own 1% or more of the equity securities of the Company mentioned in the report as of the last day of the month preceding the publication of the<br />
research report.<br />
It is confirmed that , Chirag Shah PGDBM, Sanjay Manyal MBA research analysts and the authors of this report or any of their family members does not serve as an officer, director or advisory board<br />
member of the companies mentioned in the report.<br />
<strong>ICICI</strong> <strong>Securities</strong> may have issued other reports that are inconsistent with and reach different conclusion from the information presented in this report. <strong>ICICI</strong> <strong>Securities</strong> and affiliates may act upon or make use<br />
of information contained in the report prior to the publication thereof.<br />
This report is not directed or intended for distribution to, or use by, any person or entity who is a citizen or resident of or located in any locality, state, country or other jurisdiction, where such distribution,<br />
publication, availability or use would be contrary to law, regulation or which would subject <strong>ICICI</strong> <strong>Securities</strong> and affiliates to any registration or licensing requirement within such jurisdiction. The securities<br />
described herein may or may not be eligible for sale in all jurisdictions or to certain category of investors. Persons in whose possession this document may come are required to inform themselves of and<br />
to observe such restriction.<br />
Page 7