himani.singh@icicidir ect.com Nicholas Piramal (NICPIR) Lucrative ...
himani.singh@icicidir ect.com Nicholas Piramal (NICPIR) Lucrative ...
himani.singh@icicidir ect.com Nicholas Piramal (NICPIR) Lucrative ...

You also want an ePaper? Increase the reach of your titles
YUMPU automatically turns print PDFs into web optimized ePapers that Google loves.
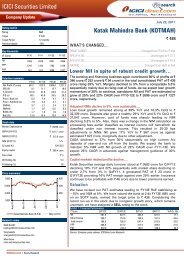
August 27, 2007 | Pharmaceuticals<br />
Initiating Coverage<br />
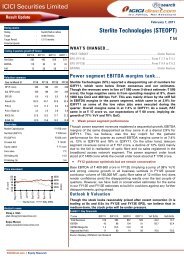
<strong>Nicholas</strong> <strong>Piramal</strong> (<strong>NICPIR</strong>)<br />
<strong>Lucrative</strong> formulation<br />
<strong>Nicholas</strong> <strong>Piramal</strong> (India) Ltd (NPIL) has created a growth canvass for itself<br />
by buying depressed assets and turning them around. We believe the<br />
<strong>com</strong>pany would follow a similar strategy to grow. It has a long track<br />
record of successful collaboration with innovator <strong>com</strong>panies and is today<br />
among the largest CRAMS players in India. We initiate coverage on the<br />
<strong>com</strong>pany with an OUTPERFORMER rating.<br />
Custom manufacturing from Indian assets gaining traction<br />
We exp<strong>ect</strong> revenues from custom manufacturing operations (CMO) to<br />
increase significantly on the back of new orders. We exp<strong>ect</strong> CMO<br />
revenues from Indian assets to grow at a CAGR of 130% to Rs 237.83<br />
crore over FY06-09E (included in total CRAMS revenue of Rs 911 crore).<br />
Raghvendra Kumar<br />
raghvendra.kumar@icicidir<strong>ect</strong>.<strong>com</strong><br />
<strong>himani</strong>.<strong>singh@icicidir</strong><br />
<strong>ect</strong>.<strong>com</strong><br />
Avecia operations seen contributing this fiscal<br />
Avecia, NPIL’s UK subsidiary, was a drag on its financials due to its<br />
negative EBIDTA. We see this trend reversing with Avecia turning the<br />
corner on the back of increased sourcing from India. We exp<strong>ect</strong> its<br />
revenues to grow at a CAGR of 42% over FY06-09E to Rs 289 crore.<br />
In-licensing of molecules in pre-clinical stage<br />
NPIL’s deal with Eli Lilly is a pointer to the potential gain from this<br />
segment. We exp<strong>ect</strong> a fast scale-up in revenues from the current US$100<br />
million.<br />
Valuations<br />
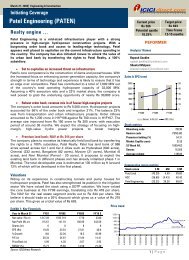
At the current price of Rs 237, the P/E multiple works out to 14x FY09<br />
EPS. A DCF valuation gives us a value of Rs 362 per share. Factoring in<br />
product-specific risks we arrive at a target price of Rs 318. We believe the<br />
stock deserves a higher P/E multiple due to the superior growth in its<br />
CMO revenues and turnaround of Avecia. At the target price, the stock<br />
will trade at 17.73x FY09E EPS of Rs 17.93. We rate the <strong>com</strong>pany<br />
OUTPERFORMER with a 12-15 month timeframe.<br />
Exhibit 1: Key Financials<br />
Year to March 31 FY06 FY07 FY08E FY09E<br />
Net Profit (Rs crore) 131.12 228.33 283.18 375.60<br />
Shares in issue (Crore) 20.90 20.90 20.90 20.90<br />
Consolidated EPS (Rs) 6.27 10.83 13.52 17.93<br />
% Growth -20% 73% 25% 33%<br />
PE (x) 37.62 21.79 17.46 13.16<br />
Price / Book (x) 5.13 4.71 3.70 3.00<br />
EV/EBIDTA (x) 25.93 16.57 12.02 9.62<br />
RoE (%) 14% 22% 21% 23%<br />
RoCE (%) 14% 17% 18% 21%<br />
Source: ICICIdir<strong>ect</strong> Research<br />
ICICIdir<strong>ect</strong> | Equity Research<br />
375<br />
325<br />
275<br />
225<br />
175<br />
Aug-06<br />
Sep-06<br />
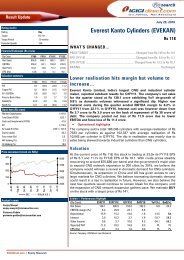
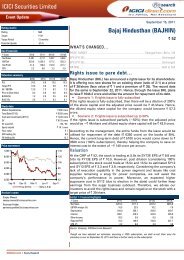
Sales & EPS trend<br />
Sales (Rs, Crore)<br />
3500<br />
3000<br />
2500<br />
2000<br />
1500<br />
1000<br />
500<br />
0<br />
Current Potential Potential price upside upside 13% Target 13% price<br />
Rs 237 Potential Time frame upside 12 13% Rs 318<br />
Time frame 12<br />
Potential upside Time Frame<br />
34% Potential Time frame upside 12-15 12 13% months<br />
Potential Time frame Time<br />
Time frame<br />
upside 12 frame months 12<br />
12 months<br />
13%<br />
OUTPERFORMER<br />
FY '04 FY '05 FY '06 FY '07E FY '08E FY09E<br />
Stock metrics<br />
Promoters holding 49.97%<br />
Market Cap Rs 5044 crore<br />
52 Week H/L Rs 320 /195<br />
Sensex 14,842<br />
Average volume 1,56,320<br />
Comparative return metrics<br />
Stock return 3M 6M 12M<br />
<strong>Nicholas</strong> <strong>Piramal</strong> -8% 0.6% 17%<br />
Dishman Pharma 34% 33% 73%<br />
Divi’s Lab 68% 83% 246%<br />
Jubilant Organosys 23% 18% 51%<br />
Oct-06<br />
Nov-06<br />
Dec-06<br />
Jan-07<br />
Feb-07<br />
Absolute sell<br />
Target price<br />
Absolute buy<br />
Mar-07<br />
Apr-07<br />
1 | P age<br />
May-07<br />
Jun-07<br />
20<br />
15<br />
10<br />
5<br />
0<br />
EPS (Rs)<br />
Jul-07<br />
Aug-07
COMPANY BACKGROUND<br />
<strong>Nicholas</strong> <strong>Piramal</strong> (India) Ltd (NPIL) is one of the<br />
country’s largest pharmaceutical <strong>com</strong>panies. The<br />
<strong>com</strong>pany is currently ranked 4th in the Indian market<br />
with a diverse product portfolio spanning nine<br />
therapeutic areas. The <strong>com</strong>pany has R&D capabilities in<br />
custom chemical synthesis, process innovation, NDDS<br />
and basic research. It has world-class US FDAapproved<br />
formulations and API facilities. NPIL has a<br />
long track record of successful collaboration with<br />
innovator <strong>com</strong>panies. Since 2003, the <strong>com</strong>pany has<br />
made significant investments to be<strong>com</strong>e a global<br />
contract manufacturing organization (CMO) for large<br />
and medium-sized innovator <strong>com</strong>panies. NPIL has a<br />
track record of buying depressed assets (See Exhibit 2)<br />
and turning them around. It bought loss making Avecia<br />
in 2005 and Pfizer’s Morpeth facility in 2006. NPIL<br />
provides CMO from assets in India (Pithampur in<br />
Madhya Pradesh and Digwal near Hyderabad) and<br />
abroad. The Avecia and Morpeth facilities in UK also<br />
provide CMO. The acquisition of Morpeth plant from<br />
Pfizer helped the <strong>com</strong>pany to secure an order worth<br />
US$350 million spread over 5 years.<br />
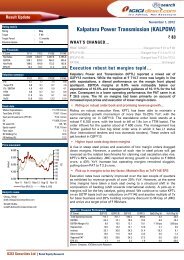
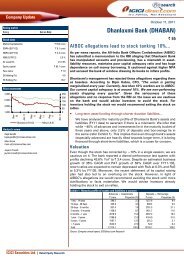
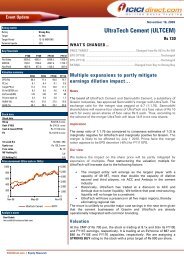
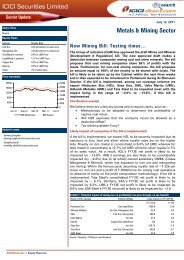
Exhibit 3: Business Model<br />
Shareholding pattern<br />
Shareholder Percentage holding (%)<br />
Promoters 49.97<br />
Institutional investors 23.39<br />
Other investors 26.64<br />
General public 11.50<br />
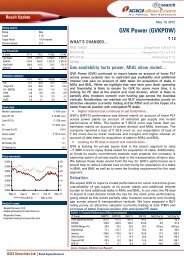
Exhibit 2: Chronology of NPIL’s buyouts<br />
<strong>Nicholas</strong> <strong>Piramal</strong>: Rs 2472 crore in FY07<br />
Domestic: Rs 1407 crore (57%) Overseas: Rs 1065 crore (43%)<br />
Formulation: Rs 1174 crore (83%)<br />
Contract Mfg: Rs 8 crore (0.5%)<br />
Path Labs: Rs 69.50 crore (5%)<br />
Others: Rs 81 crore (6%)<br />
Year Acquired <strong>com</strong>pany Rationale<br />
1988 <strong>Nicholas</strong><br />
Laboratories<br />
Pharma s<strong>ect</strong>or entry<br />
1993 Roche Products<br />
Portfolio expansion,<br />
access to new products<br />
1996 Boehringer<br />
Mannheim India<br />
New business line -<br />
Diagnostics<br />
2000 Rhone Poulenc India<br />
Size; Portfolio expansion<br />
with new therapy areas<br />
2002<br />
ICI India - Pharma<br />
business<br />
Strong presence in<br />
Cardiovascular therapy<br />
area<br />
2003<br />
Sarabhai <strong>Piramal</strong><br />
Pharmaceuticals<br />
Therapy area leadership<br />
in CNS, pain management<br />
& respiratory<br />
2005<br />
Rhodia, UK,<br />
Inhalation<br />
Anesthetics<br />
Entry into niche, global<br />
branded generics market<br />
Expansion of global<br />
2005 Avecia, UK<br />
footprint, new capabilities<br />
& technologies<br />
Manufacturing Key relationship with<br />
2006 facility of Pfizer in Pfizer, world class facility<br />
UK<br />
of patented products<br />
PDS: Rs 146 crore (14%)<br />
PMS: Rs 665 crore (62%)<br />
MMBB: Rs 227 crore (21%)<br />
Others: Rs 27 crore (3%)<br />
2 | P age
INVESTMENT RATIONALE<br />
Emerging as a leading global CMO player<br />
Since its foray into the custom manufacturing operations (CMO) in 2003, NPIL<br />
has been rapidly scaling up its capabilities. The acquisition of Avecia<br />
Pharmaceuticals in December 2005 and Pfizer’s Morepeth facility in the UK in<br />
June 2006 has put the <strong>com</strong>pany at the top of the league among Indian contract<br />
manufacturers. NPIL is uniquely positioned to address outsourcing<br />
opportunities for large MNCs through its close association with innovators,<br />
capabilities to provide entire bouquet of services and non-infringing business<br />
model.<br />
NPIL provides contract-manufacturing services from its facilities both in India<br />
as well as overseas. The newly acquired Avecia and Morpeth facilities are used<br />
for CMO. For CMO contracted to Indian assets, the <strong>com</strong>pany is sitting on an<br />
order book which can generate peak sales of US$105 million per annum with<br />
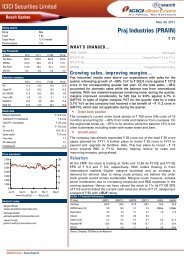
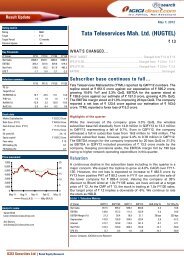
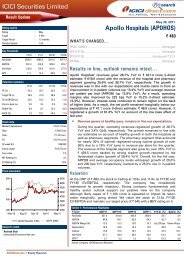
EBIDTA margin of 25%. We exp<strong>ect</strong> consolidated revenues from CMO to grow<br />
at a CAGR of 105% over FY06-09E to Rs 911 crore in FY09E from Rs 106 crore<br />
in FY06 on the back of acquisition of Morpeth operations and new contracts.<br />
This would add to the bottom line more aggressively as Avecia, which was a<br />
drag on the bottom line, turned around in Q407.<br />
Exhibit 4: CMO revenues to grow at a CAGR of 105%<br />
Sales (Rs crore)<br />
1000<br />
800<br />
600<br />
400<br />
200<br />
0<br />
Source: Company, ICICIdir<strong>ect</strong> Research<br />
FY06 FY07 FY08E FY09E<br />
NPIL also uses part of the capacity of its units at Pithampur (Madhya Pradesh)<br />
and Digwal (near Hyderabad) for CMO. The <strong>com</strong>pany has the opportunity to<br />
increasing production at the Morpeth facility, which is operating at only 50%<br />
capacity and at an EBIDTA of 15%. We are confident that NPIL would exploit<br />
Morpeth’s distribution network to boost utilization of surplus capacity.<br />
3 | P age
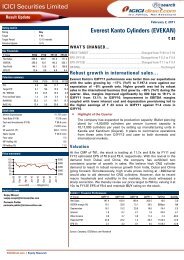
CMO from Indian assets gathering momentum<br />
Custom manufacturing operations from Indian assets are gathering<br />
momentum and the <strong>com</strong>pany is likely to rake in Rs 237.83 crore over FY06-<br />
09E on account of more contracts. The <strong>com</strong>pany is sitting on an order<br />
book, which can generate peak sales of US$105 million per annum at an<br />
EBIDTA margin of 25%.<br />
Exhibit 5: CMO from Indian assets rising<br />
Sales (Rs Crore)<br />
70<br />
60<br />
50<br />
40<br />
30<br />
20<br />
10<br />
0<br />
Q2FY06<br />
Q3FY06<br />
Q4FY06<br />
Q1FY07<br />
Q2FY07<br />
Source: Company, ICICIdir<strong>ect</strong> Research<br />
Q3FY07<br />
Q4FY07<br />
Avecia operations turned around in Q4FY07E<br />
NPIL had acquired the loss-making Avecia in Europe for UK£9.5 million<br />
pound to consolidate its contract manufacturing business. Avecia’s<br />
operations have now reached an infl<strong>ect</strong>ion point due to increased sales<br />
and enhanced sourcing from Indian assets. We exp<strong>ect</strong> its revenues to<br />
grow at a CAGR of 42% over FY06-09E to Rs 289 crore. The <strong>com</strong>pany<br />
turned around in Q4FY07 and we believe the acquisition would be<br />
earnings accretive for NPIL from FY08E.<br />
Exhibit 6: Avecia acquisition paying-off<br />
Sales (Rs Crore)<br />
90<br />
80<br />
70<br />
60<br />
50<br />
40<br />
30<br />
20<br />
10<br />
0<br />
Q1FY07<br />
Q2FY07<br />
Q3FY07<br />
Q4FY07<br />
Source: Company, ICICIdir<strong>ect</strong> Research<br />
Q 1FY08E<br />
Q 2FY08E<br />
Q1FY08E<br />
Q 3FY08E<br />
Q2FY08E<br />
Q3FY08E<br />
Q 4FY08E<br />
Q4FY08E<br />
Q 1FY09E<br />
Q1FY09E<br />
Q 2FY09E<br />
Q2FY09E<br />
Q 3FY09E<br />
Q3FY09E<br />
Q4FY09E<br />
Q 4FY09E<br />
4 | P age
Major player in domestic market<br />
Domestic business to recover lost ground<br />
We exp<strong>ect</strong> the domestic formulations business to recover after the<br />
temporary blip over the Phensedyl controversy and post a CAGR of 11%<br />
over FY06-09E to Rs 1,432.40 crore on the back of new launches.<br />
Exhibit 7: Up-trend in domestic sales<br />
Sales (Rs Crore)<br />
1600<br />
1400<br />
1200<br />
1000<br />
800<br />
600<br />
400<br />
200<br />
0<br />
FY05 FY06 FY07 FY08E FY09E<br />
Source: Company, ICICIdir<strong>ect</strong> Research<br />
Growth in domestic sales is likely to <strong>com</strong>e on the back of robust growth rate<br />
from the therapeutic segments. We believe the Phensedyl brand would<br />
regain its former sales, though we have not factored such growth in our<br />
earnings model. Loss of sales from Vah and Valto is likely to be<br />
<strong>com</strong>pensated by new launches.<br />
Exhibit 8: Therapeutic segment growth assumptions (in Rs crore)<br />
FY06 FY07 FY08E FY09E<br />
Respiratory 198.38 234.88 265.66 294.88<br />
Growth (%) -6 18 11 11<br />
Anti-Inf<strong>ect</strong>ive 139.80 148.88 159.78 172.08<br />
Growth (%) 20 6.5 8 8<br />
Cardiovascular 128.11 146.82 166.48 190.37<br />
Growth (%) 26 15 14 14<br />
CNS 126.51 133.59 148.90 169.71<br />
Growth (%) 28 6 14 14<br />
Nutritionals 88.58 100.49 107.97 120.61<br />
Growth (%) 34 13 11 12<br />
Biotek 13.65 16.61 18.88 21.10<br />
Growth (%) 19 22 12 12<br />
Anti-Diabetic 60.20 69.78 75.31 84.46<br />
Growth (%) 34 16 12 12<br />
Gastro-intestinal 44.25 51.12 57.35 64.80<br />
Growth (%) 24 15.5 14 13<br />
Dermatalogy 39.64 47.58 55.36 65.57<br />
Growth (%) 14 20 18 18<br />
NSAIDs 53.98 61.96 70.24 79.48<br />
Growth (%) -8 5 14 13<br />
Total 1042.80 1174.13 1282.45 1432.40<br />
Growth (%) 14 11.9 11 12<br />
Source: Company, ICICIdir<strong>ect</strong> Research<br />
5 | P age
NPIL lost a huge turnover due to formulations portfolio disturbance events.<br />
Three major factors impacted domestic formulations business. Sales of<br />
Phensedyl, a leading brand of the <strong>com</strong>pany, were adversely aff<strong>ect</strong>ed during<br />
FY06 due to a controversy. As Phensedyl contains codeine derived from a<br />
narcotics origin, the Narcotics Control Bureau (NCB) initiated investigation into<br />
the sale of the product. In July 2005, the NCB initiated wide spread<br />
investigations of stockists and chemists across the country. This resulted in<br />
disruption of retail stocking and off-take of the brand. NPIL contested the<br />
action of NCB in the courts and was successful in establishing that Phensedyl<br />
is not a narcotic drug under the NDPS Act. Valdecoxib was globally advised to<br />
be withdrawn, including from India. NPIL had 2 nd ranking in Valdecoxib<br />
through Vah and Valto brands. Following this, the <strong>com</strong>pany discontinued the<br />
brands in July 05, which resulted in annual sales loss of Rs 11.40 crore in FY06.<br />
The third reason for sales loss was business restructuring. The <strong>com</strong>pany<br />
divested Carex division to a distributor. This division had two main product<br />
groups, Hospital products (annual sales: Rs 9.30 crore) and Inhalation<br />
Anesthetics (annual sales: Rs 6.10 crore). Hospital products were generating<br />
paper-thin margin and were not fitting into the business of the <strong>com</strong>pany. For<br />
Inhalation Anesthetics, NPIL has global model to sell through distributors.<br />
Diversified therapeutic exposure<br />
NPIL has one of the most diversified exposures among therapeutic<br />
segments in the domestic market. Its offerings are in the eight therapeutic<br />
segments, which accounts for 90% of the domestic market. This de-risks<br />
the <strong>com</strong>pany from any slowdown in any one therapeutic segment.<br />
Additionally, we believe that NPIL will be the biggest beneficiary of any<br />
market expansion in the domestic market.<br />
Exhibit 9: Diversified product portfolio<br />
Biotech<br />
1%<br />
Nutritional<br />
8%<br />
NSAID<br />
5%<br />
Dermatology<br />
4%<br />
others<br />
13%<br />
GI<br />
4%<br />
Anti-diabetic<br />
6%<br />
Source: Company, ICICIdir<strong>ect</strong> Research<br />
Ophthalmology -<br />
Allergan<br />
4%<br />
CNS<br />
12%<br />
Respiratory<br />
18%<br />
CVS<br />
12%<br />
Anti-inf<strong>ect</strong>ive<br />
13%<br />
6 | P age
In-licensing – an opportunity to grow in the domestic market<br />
We believe in-licensing presents NPIL a huge growth opportunity with pharms<br />
MNCs introducing new-patented products in the domestic markets. The<br />
<strong>com</strong>pany has decided to adhere to the strategy of resp<strong>ect</strong>ing Intell<strong>ect</strong>ual<br />
Property Rights (IPR) and not to get into the generics business (patent<br />
challenges). Instead, it aspires to <strong>com</strong>plement the businesses of MNC pharma<br />
<strong>com</strong>panies by in licensing new products for the Indian markets and by<br />
providing the contract manufacturing services in addition to a robust sales<br />
channel. The <strong>com</strong>pany has already entered into alliance with Biogen Idec and<br />
Chiesi Farmaceutici, Italy for few products. With a large field force of over<br />
3,000 and one of the deepest penetrations into the domestic markets, NPIL is a<br />
suitable candidate for medium-sized innovator <strong>com</strong>panies looking to market<br />
their drugs in India through the out-licensing route.<br />
Strong discovery pipeline would fortify future cash flows<br />
NPIL has very strong pipeline in discovery research of 13 new chemical<br />
entities (NCEs) in the therapeutic segments of oncology, inflammation,<br />
diabetic/metabolic disorder and inf<strong>ect</strong>ious diseases. Out of these, two<br />
molecules are in phases II and one in phase I/II of clinical trials in the<br />
therapeutic segments of oncology, inflammation and anti-inf<strong>ect</strong>ive.<br />
Exhibit 10: Discovery research pipeline<br />
Oncolog<br />
Oncolog<br />
Oncolog<br />
Oncolog<br />
Oncolog<br />
Inflamat<br />
Inflamat<br />
Inflamat<br />
Inflamat<br />
Inflamat<br />
Diabete<br />
Anti-infe<br />
Anti-infe<br />
Source: Source: Company<br />
In-licensing of pre-clinical candidates – a new paradigm in drug discovery<br />
NPIL signed a drug development agreement with Eli Lilly to develop a<br />
sel<strong>ect</strong> group of Lilly’s pre-clinical drug candidates in multiple therapeutic<br />
areas. Under this agreement, NPIL will be responsible for the execution of<br />
the global clinical development program, including investigational new<br />
drug (IND-enabling) non-clinical studies and human clinical trials up to<br />
Phase III. NPIL would receive milestone payments up to US$100 million<br />
on <strong>com</strong>pletion of different phases of studies. In case of a call back, the<br />
<strong>com</strong>pany would receive the call back payment and the IPR related to the<br />
molecule will be held be NPIL. In addition, NPIL would receive royalties on<br />
sales upon successful launch of the first <strong>com</strong>pound and may get certain<br />
geographic region to market the product.<br />
7 | P age
FINANCIALS<br />
Exhibit 11: Revenue mix and growth assumptions<br />
FY06 FY07 FY08E FY09E<br />
Net sales 1582 2472 2665 2994<br />
Revenue growth (%) 21 55 15 12<br />
Exports:<br />
Total CMO 106 665 784 911<br />
Business Mix (%) 7 27 29 30<br />
Revenue growth (%) 636 43 16<br />
PDS 16 146 176 194<br />
Business Mix (%) 1 6 7 6<br />
Revenue growth (%) 253 20 10<br />
MMBB 183 227 230 239<br />
Business Mix (%) 12 9 9 8<br />
Revenue growth (%) 20 6 4<br />
Domestic:<br />
India - Formulation sales 1043 1174 1282 1432<br />
Business Mix (%) 66 47 48 48<br />
Revenue growth (%) 12 11 12<br />
Pathlabs 45 70 83 108<br />
Business Mix (%) 3 3 3 4<br />
Revenue growth (%) 55 30 30<br />
Source: Company, ICICIdir<strong>ect</strong> Research<br />
Top line to grow at a CAGR of 23% over FY06-09E<br />
We exp<strong>ect</strong> consolidated net sales to grow at a CAGR of over 23% over<br />
FY06-09E to Rs 2994 crore on the back of acquisition of Morpeth<br />
operations and increasing traction in CMO. CMO revenue is exp<strong>ect</strong>ed to<br />
grow at a CAGR of 105% over FY06-09E to Rs 911 crore in FY09E.<br />
Exhibit 12: Robust growth in net sales<br />
Sales (Rs crore)<br />
3500<br />
3000<br />
2500<br />
2000<br />
1500<br />
1000<br />
500<br />
0<br />
FY '05 FY '06 FY '07 FY '08E FY09E<br />
Source: Company, ICICIdir<strong>ect</strong> Research<br />
8 | P age
Strong margin expansion likely in ensuing quarters<br />
NPIL is likely to witness strong margin expansion going forward on<br />
account of higher sourcing from Baddi plant in Himachal Pradesh,<br />
turnaround in Avecia operations and traction in CMO business from<br />
Indian assets. Its operating margin is likely to improve from 12.49% in<br />
FY06 to 17.66% in FY09E by 517 bps. NPIL sources 60-65% of domestic<br />
sales of high-value products from its Baddi plant and exp<strong>ect</strong>s to save<br />
major excise duty.<br />
Exhibit 13: Margins to improve progressively<br />
OPM & NPM (%)<br />
20%<br />
18%<br />
16%<br />
14%<br />
12%<br />
10%<br />
8%<br />
6%<br />
4%<br />
Source: Company, ICICIdir<strong>ect</strong> Research<br />
FY '05 FY '06 FY '07 FY '08E FY09E<br />
OPM (%) NPM (% )<br />
Consolidated net profits to grow at a CAGR of 42% over FY06-09E<br />
Margin expansion is likely to result in net profit growing at a CAGR of<br />
42%. NPIL is not likely to undertake any major capex proj<strong>ect</strong>. However, its<br />
regular capex of around Rs 100 crore per year will be financed through<br />
internal accruals. With lower depreciation and interest cost, the increase<br />
in margins at operating level is likely to boost net margin as well.<br />
Exhibit 14: Net profits to surge<br />
Net Profit (Rs crore)<br />
400<br />
350<br />
300<br />
250<br />
200<br />
150<br />
100<br />
50<br />
0<br />
FY '06 FY '07 FY '08E FY09E<br />
Source: Company, ICICIdir<strong>ect</strong> Research<br />
9 | P age
Return ratios to improve<br />
NPIL would continue to invest in inorganic acquisitions. The capex for<br />
Baddi and the Pithampur plant is <strong>com</strong>plete and the facility is being utilized<br />
for the CMO for international business. The investments made in plants<br />
would now start generating revenue, boosting RoCE from 14% in FY06 to<br />
22.6% in FY09E. The redemption of preference shares by FY08 would<br />
leave more earnings for the equity shareholders, which is likely to boost<br />
the RoNW from 14% in FY06 to 23% in FY09E.<br />
Exhibit 15: Improvement in return ratios<br />
RoNW & RoCE (%)<br />
25%<br />
20%<br />
15%<br />
10%<br />
5%<br />
0%<br />
Source: Company, ICICIdir<strong>ect</strong> Research<br />
RISKS & CONCERNS<br />
FY '06 FY '07 FY '08E FY09E<br />
RoNW (%) RoCE (%)<br />
Revenues from domestic markets have been impacted due to the<br />
Phensedyl controversy, a large brand with annual sales of around Rs 120<br />
crore. Similar issues with other large product could impact the sales and<br />
profits of the <strong>com</strong>pany.<br />
We have assumed that the CMO from Indian assets would start as<br />
scheduled. Any delay due to regulatory approvals or other issues may<br />
impact the sales and net profit of the <strong>com</strong>pany.<br />
We have assumed that the <strong>com</strong>pany would not make any sizeable capex.<br />
However, if the <strong>com</strong>pany does undertake a major capex, which requires<br />
lots of cash and necessitate the sale of investments, the EPS will get<br />
impacted as we have assumed a 9% yield from the cash parked in<br />
investments.<br />
10 | P age
VALUATION<br />
We believe a robust growth in NPIL’s CMO business from Indian assets is the<br />
main earnings multiplier for the <strong>com</strong>pany as this segment offers the highest<br />
EBIDTA margin of 25%. The <strong>com</strong>pany’s bottom line will be positively impacted<br />
by increased visibility on the revenue from this business. Avecia turned the<br />
corner in Q4FY07 and will no longer be a drag on the <strong>com</strong>pany’s margins. On<br />
the domestic pharma business front, increasing sourcing from a tax incentive<br />
zone of Baddi would further boost its margins.<br />
At the current price of Rs 237, the P/E multiple works out to 14x FY09 EPS. On<br />
an EV/EBIDTA basis, the stock trades at 9.62x FY07E earnings and 12.02x<br />
FY08E earnings. We believe the stock deserves a higher P/E multiple due to<br />
the superior growth in its CMO revenues and turnaround of Avecia. A DCF<br />
valuation gives us a value of Rs 362 per share. At the target price, the stock will<br />
trade at 17.73x its FY09E EPS of Rs 17.93.<br />
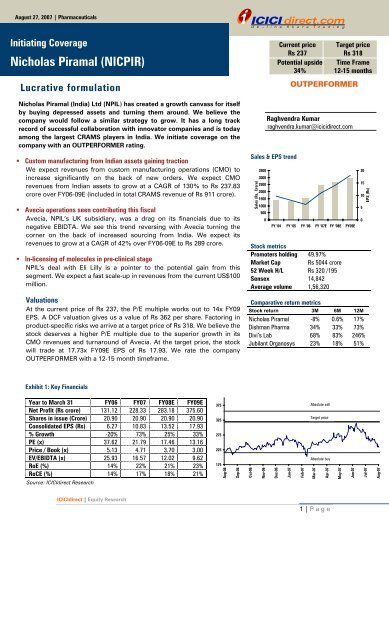
P/E band<br />
Historically the stock has traded around 30x one-year forward EPS till<br />
December 2005. Declining sales due to Phensedyl problem, discontinuance of<br />
Valdecoxib and Carex divisions led the stock to corr<strong>ect</strong>. Acquisition of loss<br />
making Avecia (having EBIDTA of –12%) depressed the stock price to below a<br />
P/E multiple of 20x one-year forward EPS. The stock has been trading between<br />
the P/E band of 15-20x since January 2006. With Avecia turning around and<br />
CMO from Indian assets gathering momentum, we believe a re-rating would<br />
happen.<br />
Exhibit 16: P/E band<br />
600<br />
500<br />
400<br />
300<br />
200<br />
100<br />
0<br />
Apr-03 Jan-04 Oct-04 Jul-05 Apr-06 Jan-07<br />
Source: ICICIdir<strong>ect</strong> Research<br />
30x<br />
20x<br />
15x<br />
10x<br />
11 | P age
Peer group valuation<br />
Among peers, the <strong>com</strong>pany <strong>com</strong>pares favorably. The EPS of NPIL is likely to<br />
grow at a CAGR of 42% over FY06-09E and it is trading at 17.73x FY09E EPS of<br />
Rs 17.93. A DCF valuation gives us a fair value of Rs 362.<br />
Exhibit 17: Peer group <strong>com</strong>parison<br />
EPS (Rs) P/E (x) PEG Price (Rs)<br />
Jubilant Organosys FY06 9.17 31.62<br />
FY07 12.10 23.97<br />
0.55 290<br />
FY08E 16.10 18.01<br />
Dishman Pharma FY06 6.71 41.43<br />
FY07 10.80 25.74<br />
0.31 278<br />
FY08E 16.15 17.21<br />
Divi's Lab FY06 53.94 96.96<br />
FY07 94.40 55.40<br />
0.69 5230<br />
FY08E 133.06 39.31<br />
<strong>Nicholas</strong> <strong>Piramal</strong> FY06 6.27 37.62<br />
FY07<br />
FY08E<br />
10.83<br />
13.52<br />
21.79<br />
17.46<br />
0.37 237<br />
FY09E 17.93 13.16<br />
Source: ICICIdir<strong>ect</strong> Research, Company & Consensus estimates<br />
12 | P age
Profit and Loss Statement (Rs crore)<br />
(Year-end March) FY05 FY06 FY07 FY08E FY09E<br />
Sales 1308.18 1582.49 2420.18 2664.50 2993.87<br />
% Growth -16.38% 20.97% 52.93% 10.09% 12.36%<br />
Op Profit 169.38 197.64 331.72 458.65 553.59<br />
% Growth -39.69% 16.68% 67.84% 38.26% 20.70%<br />
Other In<strong>com</strong>e 33.47 40.13 52.14 17.94 29.19<br />
Depreciation 52.44 68.81 81.82 100.14 100.84<br />
EBIT 150.41 168.96 302.04 376.45 481.93<br />
% Growth 97.00% 12.33% 78.76% 24.64% 28.02%<br />
Interest 19.21 17.30 30.51 44.32 39.52<br />
Profit before Tax 131.20 151.66 271.53 332.13 442.41<br />
% Growth 0.34% 15.59% 79.04% 22.32% 33.20%<br />
Taxation 46.48 23.81 38.89 48.95 66.81<br />
Tax as % of PBT 28.28 18.16 16.00 14.00 15.00<br />
Net Profit before minority<br />
interest 164.34 131.12 228.33 283.18 375.60<br />
Minority interest 0.29 0.39 0.08 0.63 0.92<br />
Net Profit after minority<br />
interest 164.05 130.73 228.25 282.55 374.68<br />
% Change YoY -20.31% 74.60% 23.79% 32.61%<br />
Shares O/S 20.90 20.90 20.90 20.90 20.90<br />
EPS (Rs) 7.86 6.27 10.83 13.52 17.93<br />
CEPS (Rs) 10.36 9.55 14.84 18.31 22.75<br />
DPS 2.73 2.73 3.39 3.45 3.45<br />
Balance Sheet (Rs crore)<br />
(Year-end March) FY05 FY06 FY07 FY08E FY09E<br />
Sources of Funds<br />
Share Capital 38.00 41.80 41.80 41.80 41.80<br />
Preference capital 53.37 53.37 38.37 0.00 0.00<br />
Reserves & Surplus 461.95 919.18 1006.03 1292.44 1602.60<br />
Minority Interest 4.11 3.02 0.50 1.13 2.05<br />
Secured Loans 309.53 271.79 421.63 513.47 462.41<br />
Unsecured Loans 58.47 39.65 217.59 231.92 231.92<br />
Deferred Tax Liability 59.60 83.59 89.32 60.00 60.00<br />
Current Liabilities &<br />
Provisions 312.11 437.31 486.60 464.25 514.56<br />
Liability 1297.14 1849.71 2301.84 2605.01 2915.34<br />
Application of Funds<br />
Net Block 622.65 864.98 1170.50 1123.61 1122.77<br />
Capital Work-in-progress 105.18 176.79 53.25 100.00 100.00<br />
Investments 3.73 28.73 28.73 200.00 350.00<br />
Cash 15.51 95.29 50.59 6.38 20.45<br />
Trade Receivables 146.02 242.93 367.34 393.37 441.99<br />
Loans & Advances 133.55 160.12 191.24 276.11 310.25<br />
Inventory- Other 270.50 280.87 440.19 505.53 569.88<br />
Total Asset 1297.14 1849.71 2301.84 2605.01 2915.34<br />
13 | P age
Cash Flow Statement (Rs crore)<br />
(Year-end March) FY05 FY06 FY07 FY08E FY09E<br />
Profit after Tax 164.34 131.12 228.33 283.18 375.60<br />
Misc. exp w/o 0.00 0.00 0.00 0.00 0.00<br />
Dividend Paid -57.01 -57.01 -70.89 -72.11 -72.11<br />
Depreciation 52.44 68.81 81.82 100.14 100.84<br />
Provision for deferred tax 21.73 23.99 5.73 -29.32 0.00<br />
Cash Flow before Working<br />
capital Changes 181.50 166.91 244.99 281.89 404.34<br />
Net Increase in Current<br />
Liabilities -1.05 125.20 49.29 -22.35 50.31<br />
Net Increase in Current<br />
Assets 16.04 133.85 314.85 176.24 147.11<br />
Cash Flow from operating<br />
activities 164.41 158.26 -20.57 83.30 307.54<br />
Purchase of Fixed Assets 212.62 382.75 263.80 100.00 100.00<br />
Cash flow from Investing<br />
Activities 212.62 382.75 263.80 100.00 100.00<br />
(Increase) / Decrease in<br />
Investment -1.47 25.00 0.00 171.27 150.00<br />
Increase / (Decrease) in<br />
Loan Funds 10.66 -56.56 327.78 106.17 -51.06<br />
Increase / (Decrease) in<br />
Equity Capital 26.20 386.92 -85.59 36.97 6.67<br />
Cash flow from Financing<br />
Activities 35.39 355.36 242.19 314.41 105.60<br />
Opening cash balance 25.37 15.51 95.29 50.59 6.38<br />
Closing Cash balance 15.51 95.29 50.59 6.38 20.45<br />
Ratio Analysis<br />
(Year-end March) FY05 FY06 FY07 FY08E FY09E<br />
EPS 7.86 6.27 10.83 13.52 17.93<br />
Cash EPS 10.36 9.55 14.84 18.31 22.75<br />
Book Value 26.31 45.98 50.14 63.84 78.68<br />
Operating Margin (%) 12.95% 12.49% 13.71% 17.21% 18.49%<br />
Gross Profit Margin (%) 13.69% 13.59% 14.29% 16.11% 17.97%<br />
Net Profit Margin (%) 12.25% 8.08% 9.24% 10.56% 12.42%<br />
RONW 32.87% 13.64% 21.79% 21.22% 22.84%<br />
ROCE 17.09% 13.67% 17.14% 18.45% 20.95%<br />
Debt Equity 0.74 0.32 0.61 0.56 0.42<br />
Fixed Assets Turnover<br />
Ratio 2.01 1.61 1.98 2.18 2.45<br />
Enterprise Value 5281.91 5125.57 5498.05 5511.40 5326.28<br />
EV/Sales 4.04 3.24 2.27 2.07 1.78<br />
EV/EBIDTA 31.18 25.93 16.57 12.02 9.62<br />
Market Cap 4932.40 4932.40 4932.40 4932.40 4932.40<br />
Market Cap to sales 3.77 3.12 2.04 1.85 1.65<br />
14 | P age
RATING RATIONALE<br />
ICICIDir<strong>ect</strong> endeavours to provide obj<strong>ect</strong>ive opinions and re<strong>com</strong>mendations. ICICIdir<strong>ect</strong> assigns ratings to its<br />
stocks according to their notional target price vs current market price and then categorises them as<br />
Outperformer, Performer, Hold, and Underperformer. The performance horizon is 2 years unless specified and<br />
the notional target price is defined as the analysts' valuation for a stock.<br />
Outperformer: 20% or more;<br />
Performer: Between 10% and 20%;<br />
Hold: +10% return;<br />
Underperformer: -10% or more.<br />
Harendra Kumar Head - Research & Advisory harendra.kumar@icicidir<strong>ect</strong>.<strong>com</strong><br />
ICICIdir<strong>ect</strong> Research Desk,<br />
ICICI Securities Limited,<br />
2 nd Floor, Stanrose House,<br />
Appasaheb Marathe Marg,<br />
Prabhadevi, Mumbai – 400 025<br />
research@icicidir<strong>ect</strong>.<strong>com</strong><br />
Disclaimer<br />
The report and information contained herein is strictly confidential and meant solely for the sel<strong>ect</strong>ed recipient and may not be altered<br />
in any way, transmitted to, copied or distributed, in part or in whole, to any other person or to the media or reproduced in any form,<br />
without prior written consent of ICICI Securities Ltd (I-Sec). The author of the report does not hold any investment in any of the<br />
<strong>com</strong>panies mentioned in this report. I-Sec may be holding a small number of shares/position in the above-referred <strong>com</strong>panies as on<br />
date of release of this report. This report is based on information obtained from public sources and sources believed to be reliable, but<br />
no independent verification has been made nor is its accuracy or <strong>com</strong>pleteness guaranteed. This report and information herein is<br />
solely for informational purpose and may not be used or considered as an offer document or solicitation of offer to buy or sell or<br />
subscribe for securities or other financial instruments. Nothing in this report constitutes investment, legal, accounting and tax advice<br />
or a representation that any investment or strategy is suitable or appropriate to your specific circumstances. The securities discussed<br />
and opinions expressed in this report may not be suitable for all investors, who must make their own investment decisions, based on<br />
their own investment obj<strong>ect</strong>ives, financial positions and needs of specific recipient. This report may not be taken in substitution for the<br />
exercise of independent judgement by any recipient. The recipient should independently evaluate the investment risks. I-Sec and<br />
affiliates accept no liabilities for any loss or damage of any kind arising out of the use of this report. Past performance is not<br />
necessarily a guide to future performance. Actual results may differ materially from those set forth in proj<strong>ect</strong>ions. I-Sec may have<br />
issued other reports that are inconsistent with and reach different conclusion from the information presented in this report. This report<br />
is not dir<strong>ect</strong>ed or intended for distribution to, or use by, any person or entity who is a citizen or resident of or located in any locality,<br />
state, country or other jurisdiction, where such distribution, publication, availability or use would be contrary to law, regulation or<br />
which would subj<strong>ect</strong> I-Sec and affiliates to any registration or licensing requirement within such jurisdiction. The securities described<br />
herein may or may not be eligible for sale in all jurisdictions or to certain category of investors. Persons in whose possession this<br />
document may <strong>com</strong>e are required to inform themselves of and to observe such restriction.<br />
15 | P age