Kalpataru Power Transmission (KALPOW) - ICICI Direct
Kalpataru Power Transmission (KALPOW) - ICICI Direct
Kalpataru Power Transmission (KALPOW) - ICICI Direct
You also want an ePaper? Increase the reach of your titles
YUMPU automatically turns print PDFs into web optimized ePapers that Google loves.
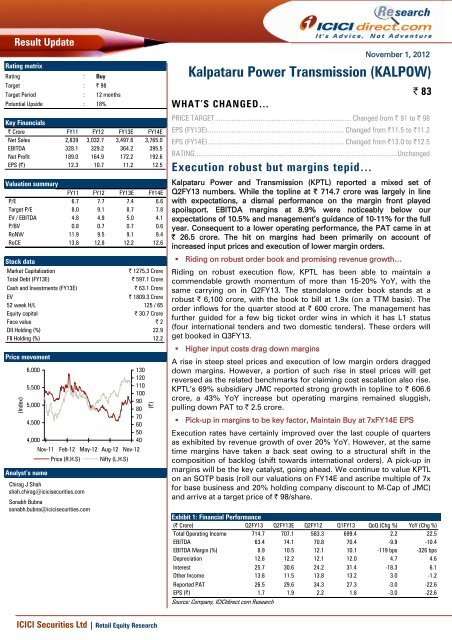
Result Update<br />
Rating matrix<br />
Rating : Buy<br />
Target : | 98<br />
Target Period : 12 months<br />
Potential Upside : 18%<br />
Key Financials<br />
| Crore FY11 FY12 FY13E FY14E<br />
Net Sales 2,839 3,032.7 3,497.6 3,765.0<br />
EBITDA 328.1 329.2 364.2 395.5<br />
Net Profit 189.0 164.9 172.2 192.6<br />
EPS (|) 12.3 10.7 11.2 12.5<br />
Valuation summary<br />
FY11 FY12 FY13E FY14E<br />
P/E 6.7 7.7 7.4 6.6<br />
Target P/E 8.0 9.1 8.7 7.8<br />
EV / EBITDA 4.8 4.9 5.0 4.1<br />
P/BV 0.8 0.7 0.7 0.6<br />
RoNW 11.9 9.5 9.1 9.4<br />
RoCE 13.8 12.8 12.2 12.6<br />
Stock data<br />
Market Capitalization | 1275.3 Crore<br />
Total Debt (FY13E) | 597.1 Crore<br />
Cash and Investments (FY13E) | 63.1 Crore<br />
EV | 1809.3 Crore<br />
52 week H/L 125 / 65<br />
Equity capital | 30.7 Crore<br />
Face value | 2<br />
DII Holding (%) 22.9<br />
FII Holding (%) 12.2<br />
Price movement<br />
(Index)<br />
6,000<br />
5,500<br />
5,000<br />
4,500<br />
4,000<br />
Nov-11<br />
Analyst’s name<br />
Feb-12<br />
Chirag J Shah<br />
shah.chirag@icicisecurities.com<br />
May-12<br />
Aug-12<br />
Price (R.H.S) Nifty (L.H.S)<br />
Sonabh Bubna<br />
sonabh.bubna@icicisecurities.com<br />
Nov-12<br />
130<br />
120<br />
110<br />
100<br />
90<br />
80<br />
70<br />
60<br />
50<br />
40<br />
(|)<br />
<strong>ICICI</strong> Securities Ltd | Retail Equity Research<br />
WHAT’S CHANGED…<br />
November 1, 2012<br />
<strong>Kalpataru</strong> <strong>Power</strong> <strong>Transmission</strong> (<strong>KALPOW</strong>)<br />
PRICE TARGET ........................................................................... Changed from | 91 to | 98<br />
EPS (FY13E)........................................................................... Changed from |11.5 to |11.2<br />
EPS (FY14E)........................................................................... Changed from |13.0 to |12.5<br />
RATING...............................................................................................................Unchanged<br />
Execution robust but margins tepid…<br />
<strong>Kalpataru</strong> <strong>Power</strong> and <strong>Transmission</strong> (KPTL) reported a mixed set of<br />
Q2FY13 numbers. While the topline at | 714.7 crore was largely in line<br />
with expectations, a dismal performance on the margin front played<br />
spoilsport. EBITDA margins at 8.9% were noticeably below our<br />
expectations of 10.5% and management’s guidance of 10-11% for the full<br />
year. Consequent to a lower operating performance, the PAT came in at<br />
| 26.5 crore. The hit on margins had been primarily on account of<br />
increased input prices and execution of lower margin orders.<br />
Riding on robust order book and promising revenue growth…<br />
Riding on robust execution flow, KPTL has been able to maintain a<br />
commendable growth momentum of more than 15-20% YoY, with the<br />
same carrying on in Q2FY13. The standalone order book stands at a<br />
robust | 6,100 crore, with the book to bill at 1.9x (on a TTM basis). The<br />
order inflows for the quarter stood at | 600 crore. The management has<br />
further guided for a few big ticket order wins in which it has L1 status<br />
(four international tenders and two domestic tenders). These orders will<br />
get booked in Q3FY13.<br />
Higher input costs drag down margins<br />
A rise in steep steel prices and execution of low margin orders dragged<br />
down margins. However, a portion of such rise in steel prices will get<br />
reversed as the related benchmarks for claiming cost escalation also rise.<br />
KPTL’s 69% subsidiary JMC reported strong growth in topline to | 606.6<br />
crore, a 43% YoY increase but operating margins remained sluggish,<br />
pulling down PAT to | 2.5 crore.<br />
Pick-up in margins to be key factor, Maintain Buy at 7xFY14E EPS<br />
| 83<br />
Execution rates have certainly improved over the last couple of quarters<br />
as exhibited by revenue growth of over 20% YoY. However, at the same<br />
time margins have taken a back seat owing to a structural shift in the<br />
composition of backlog (shift towards international orders). A pick-up in<br />
margins will be the key catalyst, going ahead. We continue to value KPTL<br />
on an SOTP basis (roll our valuations on FY14E and ascribe multiple of 7x<br />
for base business and 20% holding company discount to M-Cap of JMC)<br />
and arrive at a target price of | 98/share.<br />
Exhibit 1: Financial Performance<br />
(| Crore) Q2FY13 Q2FY13E Q2FY12 Q1FY13 QoQ (Chg %) YoY (Chg %)<br />
Total Operating Income 714.7 707.1 583.3 699.4 2.2 22.5<br />
EBITDA 63.4 74.1 70.8 70.4 -9.9 -10.4<br />
EBITDA Margin (%) 8.9 10.5 12.1 10.1 -119 bps -326 bps<br />
Depreciation 12.6 12.2 12.1 12.0 4.7 4.6<br />
Interest 25.7 30.6 24.2 31.4 -18.3 6.1<br />
Other Income 13.6 11.5 13.8 13.2 3.0 -1.2<br />
Reported PAT 26.5 29.6 34.3 27.3 -3.0 -22.6<br />
EPS (|) 1.7 1.9 2.2 1.8 -3.0 -22.6<br />
Source: Company, <strong>ICICI</strong>direct.com Research
The standalone order backlog at | 6100 crore renders good<br />
revenue visibility for FY13E and FY14E. KPTL won orders<br />
worth | 600 crore during Q2FY13. On a consolidated basis,<br />
the backlog stands at | 11300 crore (KPTL+JMC Projects)<br />
Exhibit 2: Assumption sheet<br />
(%) FY11 FY12 FY13E FY14E<br />
Order inflow growth 25.6 8.7 4.5 15.1<br />
Order backlog growth 10.0 10.9 8.5 11.1<br />
Revenue Growth 9.3 6.8 15.3 7.6<br />
EBITDA margins 11.6 10.9 10.4 10.5<br />
PAT Growth 9.5 -12.8 4.4 11.9<br />
Source: Company, <strong>ICICI</strong>direct.com Research<br />
Order backlog and inflow analysis:<br />
• The company has a strong carry forward of orders at | 6100 crore,<br />
presenting strong revenue growth ahead<br />
• With | 600 crore of new orders added during the quarter, the<br />
company had been able to maintain an order replacement ratio of<br />
0.84x<br />
• Of the total order book, 50% is on a variable cost basis while the<br />
rest are on fixed cost basis (international orders)<br />
• KPTL is already L1 in six large orders that it expects to flow in by<br />
Q3FY13. Of these, four projects are from international markets while<br />
the remaining two are from domestic markets<br />
• JMC has an order backlog of | 5200 crore with new order wins<br />
during the quarter amounting to | 250 crore<br />
Exhibit 3: Trend of order backlog for standalone business<br />
(| Crore) .<br />
7000<br />
6000<br />
5000<br />
4000<br />
3000<br />
2000<br />
1000<br />
0<br />
5200 5000 4800 5000 5000<br />
Q3FY10<br />
<strong>ICICI</strong> Securities Ltd | Retail Equity Research Page 2<br />
Q4FY10<br />
Q1FY11<br />
Q2FY11<br />
Source: Company, <strong>ICICI</strong>direct.com Research<br />
Q3FY11<br />
5500<br />
Q4FY11<br />
5900 6000<br />
Q1FY12<br />
Q2FY12<br />
5500<br />
Q3FY12<br />
6100 6170 6100<br />
Q4FY12<br />
Q1FY13<br />
Q2FY13
KPTL received orders worth | 600 crore. Of the overall<br />
standalone order book, 50% have a price variation clause.<br />
For JMC Projects, the total order book is |5200 crore. The<br />
order replacement ratio stood at 0.84x<br />
Current book to bill ratio at 1.9x renders visibility into FY13E<br />
and FY14E provided execution remains stable. In terms of<br />
order backlog break-up, transmission orders continue to<br />
dominate with a nearly 901% share in the backlog, with<br />
infrastructure and distribution segment combined having a<br />
tenth share in the backlog<br />
Exhibit 4: Trend in order inflows<br />
(| Crore) .<br />
2500<br />
2000<br />
1500<br />
1000<br />
500<br />
0<br />
429<br />
Q3FY10<br />
<strong>ICICI</strong> Securities Ltd | Retail Equity Research Page 3<br />
652<br />
Q4FY10<br />
345<br />
Q1FY11<br />
842 804<br />
Q2FY11<br />
Source: Company, <strong>ICICI</strong>direct.com Research<br />
Exhibit 5: Book to bill trend (on TTM basis)<br />
(x)<br />
2.5<br />
2.3<br />
2.1<br />
1.9<br />
1.7<br />
1.5<br />
1.3<br />
1.1<br />
0.9<br />
0.7<br />
0.5<br />
Q3FY10<br />
2.3<br />
Q4FY10<br />
1.9<br />
Q1FY11<br />
1.8<br />
Q2FY11<br />
Source: Company, <strong>ICICI</strong>direct.com Research<br />
1.8<br />
Revenue and profitability analysis<br />
Q3FY11<br />
Q3FY11<br />
1.8<br />
1401<br />
Q4FY11<br />
Q4FY11<br />
1.9<br />
995<br />
Q1FY12<br />
Q1FY12<br />
2.0<br />
694<br />
Q2FY12<br />
Q2FY12<br />
2.1<br />
315<br />
Q3FY12<br />
Q3FY12<br />
1.9<br />
2000<br />
Q4FY12<br />
Q4FY12<br />
2.0<br />
650 600<br />
• Led by a strong execution, revenues jumped a handsome ~22%<br />
YoY. Of the total revenues, 89% was booked from transmission,<br />
10% from infrastructure & power and 1% from DMC<br />
• EBITDA margins at 8.9% were noticeably below our expectations<br />
of 10.5% and the management’s guidance of 10-10.5% for the full<br />
year.<br />
• A favourable rupee movement led to forex saving in finance cost<br />
of | 2 crore, thereby bringing the same down to | 25.7 crore from<br />
| 31.4 crore in the last quarter<br />
• JMC Projects reported a strong topline growth of 43.0% to | 606.6<br />
crore. However, weaker EBITDA margins played spoilsport owing<br />
a sharp rise in raw material costs. The management has further<br />
revised down the EBITA margins expectation from the last quarter<br />
of 6.0-6.5% to 5-6.0% level in the current quarter<br />
• Given the strong order book and consequent revenue visibility,<br />
we estimate the topline and bottomline will grow at a CAGR of<br />
11.4% and 8.0% over FY12-14E, respectively, for the standalone<br />
business<br />
Q1FY13<br />
Q1FY13<br />
2.0<br />
Q2FY13<br />
Q2FY13<br />
1.9
KPTL witnessed strong topline growth (at the standalone<br />
level), with revenues at | 714.7 crore, up 22.5% YoY<br />
For the subsidiaries, JMC reported robust revenue growth<br />
of 43% YoY in Q2FY13<br />
EBITDA margins at 8.9% were sharply lower by 326 bps<br />
YoY. Given the rising share of international/fixed price<br />
orders in the overall order backlog, margins in the range<br />
of 10-10.5% are supposed to be the new normal, going<br />
ahead. We have built in margins of 10.1-10.5% over<br />
FY13E-14E<br />
Exhibit 6: Revenue trend<br />
(| Crore) .<br />
1200<br />
1100<br />
1000<br />
900<br />
800<br />
700<br />
600<br />
500<br />
400<br />
300<br />
200<br />
836.7<br />
715.8<br />
Q3FY10<br />
<strong>ICICI</strong> Securities Ltd | Retail Equity Research Page 4<br />
Q4FY10<br />
535.6<br />
Q1FY11<br />
630.4<br />
Q2FY11<br />
Source: Company, <strong>ICICI</strong>direct.com Research<br />
Exhibit 7: EBITDA margin trend<br />
(%)<br />
14<br />
13<br />
12<br />
11<br />
10<br />
9<br />
8<br />
7<br />
Q3FY10<br />
11.0 10.9<br />
Q4FY10<br />
Q1FY11<br />
13.0<br />
Q2FY11<br />
Source: Company, <strong>ICICI</strong>direct.com Research<br />
789.7<br />
Q3FY11<br />
884.6<br />
Q4FY11<br />
584.6 583.3<br />
Q1FY12<br />
Q2FY12<br />
800.8<br />
Q3FY12<br />
Total net sales Growth ( RHS)<br />
11.4 11.3 11.1<br />
Q3FY11<br />
Q4FY11<br />
Q1FY12<br />
11.5<br />
Q2FY12<br />
12.2<br />
1061.6<br />
Q4FY12<br />
Q3FY12<br />
11.3<br />
699.4 714.7<br />
Q1FY13<br />
Q4FY12<br />
8.8<br />
Q2FY13<br />
Q1FY13<br />
80<br />
70<br />
60<br />
50<br />
40<br />
30<br />
20<br />
10<br />
0<br />
-10<br />
-20<br />
10.1<br />
(%) .<br />
Q2FY13<br />
8.9
Exhibit 8: Trend in segmental EBIT margins<br />
(%)<br />
14<br />
12<br />
10<br />
8<br />
6<br />
4<br />
2<br />
0<br />
-2<br />
-4<br />
Q1FY11<br />
12.3<br />
9.4<br />
-2.0<br />
<strong>ICICI</strong> Securities Ltd | Retail Equity Research Page 5<br />
Q2FY11<br />
10.6<br />
8.5<br />
0.5<br />
Q3FY11<br />
Source: Company, <strong>ICICI</strong>direct.com Research<br />
Exhibit 9: PAT build-up for Q2FY13 vs. Q2FY12 (as percentage of total operating income)<br />
(%)<br />
100<br />
80<br />
60<br />
40<br />
20<br />
0<br />
100.0<br />
Total Operating Income<br />
49.3<br />
Raw Material Expenses<br />
22.5<br />
Sub Contracting Charges<br />
9.1<br />
Other Operating Expenses<br />
Q2FY12<br />
6.9<br />
Employee Expenses<br />
Source: Company, <strong>ICICI</strong>direct.com Research<br />
12.1<br />
Operating Profit (EBITDA)<br />
2.4<br />
Other Income<br />
4.1<br />
Interest<br />
2.1<br />
Depreciation<br />
2.4<br />
Total Tax<br />
5.9<br />
PAT<br />
(%)<br />
100<br />
80<br />
60<br />
40<br />
20<br />
0<br />
10.0 9.9 10.0<br />
8.8<br />
2.5 2.2<br />
Q4FY11<br />
0.5<br />
Q1FY12<br />
10.4<br />
2.8<br />
Q2FY12<br />
11.7 10.4<br />
3.5<br />
-0.1<br />
Q3FY12<br />
5.9<br />
2.1<br />
7.9<br />
8.5<br />
Q4FY12<br />
0.8<br />
Q1FY13<br />
9.2<br />
4.2<br />
-0.3<br />
<strong>Transmission</strong> & Distribution Bio-mass Energy Infrastructure<br />
100.0<br />
Total Operating Income<br />
52.4<br />
Raw Material Expenses<br />
22.3<br />
Sub Contracting Charges<br />
10.5<br />
Other Operating Expenses<br />
6.0<br />
Employee Expenses<br />
Q2FY13<br />
1.9 3.6<br />
8.9 1.8 1.7<br />
3.7<br />
Operating Profit (EBITDA)<br />
Other Income<br />
Interest<br />
Depreciation<br />
Total Tax<br />
PAT<br />
8.1<br />
3.2<br />
Q2FY13<br />
-1.2
Valuations<br />
Execution rates have certainly improved over the last couple of quarters<br />
as exhibited by revenue growth of over 20% YoY. However, at the same<br />
time margins have taken a back seat owing to a structural shift in the<br />
composition of backlog (shift towards international orders). A pick-up in<br />
margins will be the key catalyst, going ahead. We continue to value KPTL<br />
on an SOTP basis (roll our valuations on FY14E and ascribe multiple of 7x<br />
for base business and 20% holding company discount to M-Cap of JMC)<br />
and arrive at a target price of | 98/share.<br />
Exhibit 10: Valuation snapshot<br />
Exhibit 11: Twelve months forward P/E<br />
(X)<br />
12<br />
10<br />
8<br />
6<br />
4<br />
2<br />
0<br />
Apr-11<br />
May-11<br />
Jun-11<br />
<strong>ICICI</strong> Securities Ltd | Retail Equity Research Page 6<br />
Jul-11<br />
Aug-11<br />
Sep-11<br />
Oct-11<br />
Source: Company, <strong>ICICI</strong>direct.com Research<br />
Stake held Estimated Value Contribution to KPTL Methodology<br />
% | crore | crore |/share<br />
Standalone Business 100 1,348 1,348 88 7X FY14E EPS<br />
JMC Projects 69.4 281 156 10<br />
Total SOTP valuation 1,629 1,504 98<br />
Source: Company, <strong>ICICI</strong>direct.com Research<br />
Nov-11<br />
Dec-11<br />
Jan-12<br />
Feb-12<br />
Mar-12<br />
12 m Forward P/E<br />
Apr-12<br />
May-12<br />
Jun-12<br />
Jul-12<br />
20% discount to current<br />
market cap<br />
Aug-12<br />
Sep-12<br />
Oct-12<br />
Nov-12
Financial summary<br />
Profit and loss statement<br />
(Year-end March) FY11 FY12 FY13E<br />
(| Crore)<br />
FY14E<br />
Total operating Income 2,838.8 3,032.7 3,497.6 3,765.0<br />
Growth (%) 9.3 6.8 15.3 7.6<br />
Raw Material Expenses 1,289.3 1,502.9 1,737.0 1,852.8<br />
Employee Expenses 193.4 170.2 193.7 226.9<br />
Sub Contracting Charges 759.8 734.7 831.5 918.1<br />
Other Operating Expenses 268.1 295.7 371.1 371.9<br />
Other expenses 0.0 0.0 0.0 0.0<br />
Total Operating Expenditure 2,510.7 2,703.5 3,133.4 3,369.5<br />
EBITDA 328.1 329.2 364.2 395.5<br />
Growth (%) 7.8 0.3 10.6 8.6<br />
Depreciation 46.0 48.1 60.3 69.1<br />
Interest 80.2 108.2 119.1 104.0<br />
Other Income 53.1 51.2 60.8 65.0<br />
PBT 255.1 224.0 245.7 287.4<br />
Others 0.0 0.0 0.0 0.0<br />
Total Tax 66.0 59.2 73.5 94.8<br />
PAT 189.0 164.9 172.2 192.6<br />
Growth (%) 9.5 -12.8 4.4 11.9<br />
EPS (|) 12.3 10.7 11.2 12.5<br />
Source: Company, <strong>ICICI</strong>direct.com Research<br />
Balance sheet<br />
(Year-end March)<br />
Liabilities<br />
FY11 FY12 FY13E<br />
(| Crore)<br />
FY14E<br />
Equity Capital 30.7 30.7 30.7 30.7<br />
Reserve and Surplus 1,560.0 1,712.3 1,859.0 2,021.1<br />
Total Shareholders funds 1,590.7 1,743.0 1,889.7 2,051.8<br />
Total Debt 447.3 447.1 597.1 547.1<br />
Deferred Tax Liability 10.7 9.8 9.8 9.8<br />
Minority Interest / Others 0.0 0.0 0.0 0.0<br />
Total Liabilities 2,048.6 2,199.9 2,496.7 2,608.7<br />
Assets<br />
Gross Block 538.5 625.1 711.7 811.7<br />
Less: Acc Depreciation 179.2 229.4 289.8 358.9<br />
Net Block 359.3 395.7 422.0 452.9<br />
Capital WIP 14.6 59.1 59.1 59.1<br />
Total Fixed Assets 374.0 454.9 481.1 512.0<br />
Investments 395.6 404.9 414.9 514.9<br />
Inventory 241.0 321.2 345.1 354.4<br />
Debtors 1,284.9 1,513.4 1,618.1 1,851.8<br />
Loans and Advances 494.2 652.0 598.7 678.0<br />
Other Current Assets 488.5 453.2 484.9 453.9<br />
Cash 144.2 101.6 63.1 207.5<br />
Total Current Assets 2,652.9 3,041.2 3,109.8 3,545.7<br />
Creditors 894.3 1,048.5 1,284.9 1,234.5<br />
Provisions 149.5 141.0 179.9 172.8<br />
Total Current Liabilities 1,373.8 1,701.1 1,509.1 1,963.9<br />
Net Current Assets 1,279.1 1,340.2 1,600.7 1,581.8<br />
Others Assets 0.0 0.0 0.0 0.0<br />
Application of Funds 2,048.7 2,200.0 2,496.7 2,608.8<br />
Source: Company, <strong>ICICI</strong>direct.com Research<br />
Cash flow statement<br />
(Year-end March) FY11 FY12 FY13E<br />
(| Crore)<br />
FY14E<br />
Profit after Tax 189.0 164.9 172.2 192.6<br />
Add: Depreciation 46.0 48.1 60.3 69.1<br />
(Inc)/dec in Current Assets -163.5 -431.0 -107.0 -291.4<br />
Inc/(dec) in CL and Provisions 130.3 327.3 -192.0 454.8<br />
Others 0.0 0.0 0.0 0.0<br />
CF from operating activities 201.8 109.2 -66.5 425.0<br />
(Inc)/dec in Investments -269.1 -9.4 -10.0 -100.0<br />
(Inc)/dec in Fixed Assets -81.5 -129.0 -86.6 -100.0<br />
Others 0.0 0.0 0.0 0.0<br />
CF from investing activities -353.9 -139.2 -96.6 -200.0<br />
Issue/(Buy back) of Equity 4.2 0.0 0.0 0.0<br />
Inc/(dec) in loan funds -157.0 -0.2 150.0 -50.0<br />
Dividend paid & dividend tax -26.4 -26.2 -26.9 -30.5<br />
Inc/(dec) in Sec. premium 435.0 0.0 0.0 0.0<br />
Others 0.0 7.6 0.0 0.0<br />
CF from financing activities 259.5 -12.7 124.6 -80.5<br />
Net Cash flow 107.4 -42.7 -38.5 144.5<br />
Opening Cash 36.9 144.2 101.6 63.1<br />
Closing Cash 144.2 101.6 63.1 207.5<br />
Source: Company, <strong>ICICI</strong>direct.com Research<br />
Key ratios<br />
(Year-end March) FY11 FY12 FY13E FY14E<br />
Per share data (|)<br />
EPS 12.3 10.7 11.2 12.5<br />
Cash EPS 15.3 13.9 15.2 17.1<br />
BV 103.7 113.6 123.1 133.7<br />
DPS 1.5 1.5 1.5 1.7<br />
Cash Per Share 9.4 6.6 4.1 13.5<br />
Operating Ratios (%)<br />
EBITDA Margin 11.6 10.9 10.4 10.5<br />
PBT / Total Operating income 0.0 0.0 0.0 0.0<br />
PAT Margin 6.7 5.4 4.9 5.1<br />
Inventory days 32.8 34.0 35.0 34.0<br />
Debtor days 165.2 183.0 170.0 180.0<br />
Creditor days 115.0 126.8 135.0 120.0<br />
Return Ratios (%)<br />
RoE 11.9 9.5 9.1 9.4<br />
RoCE 13.8 12.8 12.2 12.6<br />
RoIC 11.0 9.9 8.8 9.1<br />
Valuation Ratios (x)<br />
P/E 6.7 7.7 7.4 6.6<br />
EV / EBITDA 4.8 4.9 5.0 4.1<br />
EV / Net Sales 0.6 0.5 0.5 0.4<br />
Market Cap / Sales 0.4 0.4 0.4 0.3<br />
Price to Book Value 0.8 0.7 0.7 0.6<br />
Solvency Ratios<br />
Debt/EBITDA 1.4 1.4 1.6 1.4<br />
Debt / Equity 0.3 0.3 0.3 0.3<br />
Current Ratio 1.9 1.8 2.1 1.8<br />
Quick Ratio 1.9 1.7 2.0 1.7<br />
Source: Company, <strong>ICICI</strong>direct.com Research<br />
<strong>ICICI</strong> Securities Ltd | Retail Equity Research Page 7
<strong>ICICI</strong>direct.com Research coverage universe (Capital Goods)<br />
CMP M Cap<br />
EPS (|) P/E (x) P/BV (x) RoA (%)<br />
RoE (%)<br />
Sector / Company<br />
(|) TP(|) Rating (| Cr) FY12 FY13E FY14E FY12 FY13E FY14E FY12 FY13E FY14E FY12 FY13E FY14E FY12 FY13E FY14E<br />
Thermax (THERMA) 583 432 Sell 6937.7 34.1 31.7 30.9 16.8 18.4 18.9 4.3 3.7 3.2 30.4 24.0 22.4 25.4 20.2 17.3<br />
BGR Energy (BGRENE) 266 349 Buy 1912.3 30.9 28.0 34.1 8.6 9.5 7.8 1.9 1.6 1.5 15.3 12.8 13.8 19.2 15.3 16.6<br />
Hindustan Dorr (HINDOR) 25 22 Sell 181.8 -4.2 1.6 3.9 n/a 15.7 6.5 0.9 0.6 0.5 14.0 6.1 10.3 12.7 4.0 9.0<br />
Sterlite Technologies (STEOPT) 30 31 Hold 1177.8 1.1 3.3 3.8 28.7 9.0 7.8 1.1 1.0 0.9 6.9 11.6 11.4 3.6 10.4 10.9<br />
KEC International (KECIN) 62 68 Hold 1567.4 8.1 7.3 8.9 7.6 8.6 7.0 1.6 1.4 1.2 19.1 16.9 17.2 18.9 14.7 15.7<br />
Jyoti Structures (JYOSTR) 45 55 Hold 357.2 10.4 9.5 12.5 4.3 4.7 3.6 0.5 0.4 0.4 20.1 17.5 18.3 12.8 10.6 12.4<br />
<strong>Kalpataru</strong> <strong>Power</strong> (<strong>KALPOW</strong>) 83 103 Hold 2943.0 10.7 11.2 12.5 7.7 7.4 6.6 0.7 0.7 0.6 12.8 12.2 12.6 9.5 9.1 9.4<br />
Larsen & Toubro (LARTOU) 1634 1840 Buy 99510.6 72.5 76.8 88.8 22.5 21.3 18.4 4.0 3.6 3.1 15.6 14.8 16.3 17.5 16.6 16.8<br />
Mcnally Bharat (MCNBHA) 107 113 Buy 322.2 25.2 22.7 33.1 4.2 4.7 3.2 0.7 0.6 0.5 15.6 16.1 17.2 20.0 15.4 18.6<br />
BHEL 227 205 Hold 55497.1 28.8 25.9 22.8 7.9 8.7 10.0 2.2 1.9 1.7 35.7 27.5 21.2 27.7 21.2 16.4<br />
Source: Company, <strong>ICICI</strong>direct.com Research<br />
Exhibit 12: Recommendation History<br />
(|)<br />
160<br />
140<br />
120<br />
100<br />
80<br />
60<br />
40<br />
20<br />
0<br />
Nov-11<br />
Dec-11<br />
<strong>ICICI</strong> Securities Ltd | Retail Equity Research Page 8<br />
Jan-12<br />
Feb-12<br />
Mar-12<br />
Source: Bloomberg, <strong>ICICI</strong>direct.com Research<br />
Apr-12<br />
May-12<br />
Jun-12<br />
Jul-12<br />
Price Target Price<br />
Exhibit 13: Recent Releases<br />
Date Event CMP Target Price Rating<br />
31-Mar-11 Initiating Coverage 135 147 ADD<br />
8-Apr-11 Q4FY11 Preview 139 147 ADD<br />
18-May-11 Q4FY11 Result Update 121 147 BUY<br />
5-Jul-11 Q1FY12 Preview 129 147 BUY<br />
1-Aug-11 Q1FY12 Result Update 127 147 BUY<br />
5-Oct-11 Q2FY12 Preview 104 147 BUY<br />
25-Oct-11 Q2FY12 Result Update 100 125 BUY<br />
22-Feb-12 Q3FY12 Result Update 115 124 HOLD<br />
0-Jan-00 Q4FY12 Preview 108 124 HOLD<br />
22-May-12 Q4FY12 Result Update 82 103 BUY<br />
5-Jul-12 Q1FY13 Result preview 82 103 BUY<br />
7-Aug-12 Q1FY13 Result Update 70 91 BUY<br />
Source: Company, <strong>ICICI</strong>direct.com Research<br />
Aug-12<br />
Sep-12<br />
Oct-12
RATING RATIONALE<br />
<strong>ICICI</strong>direct.com endeavours to provide objective opinions and recommendations. <strong>ICICI</strong>direct.com assigns<br />
ratings to its stocks according to their notional target price vs. current market price and then categorises them<br />
as Strong Buy, Buy, Hold and Sell. The performance horizon is two years unless specified and the notional<br />
target price is defined as the analysts' valuation for a stock.<br />
Strong Buy: >15%/20% for large caps/midcaps, respectively, with high conviction;<br />
Buy: > 10%/ 15% for large caps/midcaps, respectively;<br />
Hold: Up to +/-10%;<br />
Sell: -10% or more;<br />
ANALYST CERTIFICATION<br />
Pankaj Pandey Head – Research pankaj.pandey@icicisecurities.com<br />
<strong>ICICI</strong>direct.com Research Desk,<br />
<strong>ICICI</strong> Securities Limited,<br />
1 st Floor, Akruti Trade Centre,<br />
Road No. 7, MIDC,<br />
Andheri (East)<br />
Mumbai – 400 093<br />
research@icicidirect.com<br />
We /I, Chirag J Shah PGDBM Sonabh Bubna MBA research analysts, authors and the names subscribed to this report, hereby certify that all of the views expressed in this research report accurately reflect<br />
our personal views about any and all of the subject issuer(s) or securities. We also certify that no part of our compensation was, is, or will be directly or indirectly related to the specific recommendation(s)<br />
or view(s) in this report. Analysts aren't registered as research analysts by FINRA and might not be an associated person of the <strong>ICICI</strong> Securities Inc.<br />
Disclosures:<br />
<strong>ICICI</strong> Securities Limited (<strong>ICICI</strong> Securities) and its affiliates are a full-service, integrated investment banking, investment management and brokerage and financing group. We along with affiliates are leading<br />
underwriter of securities and participate in virtually all securities trading markets in India. We and our affiliates have investment banking and other business relationship with a significant percentage of<br />
companies covered by our Investment Research Department. Our research professionals provide important input into our investment banking and other business selection processes. <strong>ICICI</strong> Securities<br />
generally prohibits its analysts, persons reporting to analysts and their dependent family members from maintaining a financial interest in the securities or derivatives of any companies that the analysts<br />
cover.<br />
The information and opinions in this report have been prepared by <strong>ICICI</strong> Securities and are subject to change without any notice. The report and information contained herein is strictly confidential and<br />
meant solely for the selected recipient and may not be altered in any way, transmitted to, copied or distributed, in part or in whole, to any other person or to the media or reproduced in any form, without<br />
prior written consent of <strong>ICICI</strong> Securities. While we would endeavour to update the information herein on reasonable basis, <strong>ICICI</strong> Securities, its subsidiaries and associated companies, their directors and<br />
employees (“<strong>ICICI</strong> Securities and affiliates”) are under no obligation to update or keep the information current. Also, there may be regulatory, compliance or other reasons that may prevent <strong>ICICI</strong> Securities<br />
from doing so. Non-rated securities indicate that rating on a particular security has been suspended temporarily and such suspension is in compliance with applicable regulations and/or <strong>ICICI</strong> Securities<br />
policies, in circumstances where <strong>ICICI</strong> Securities is acting in an advisory capacity to this company, or in certain other circumstances.<br />
This report is based on information obtained from public sources and sources believed to be reliable, but no independent verification has been made nor is its accuracy or completeness guaranteed. This<br />
report and information herein is solely for informational purpose and may not be used or considered as an offer document or solicitation of offer to buy or sell or subscribe for securities or other financial<br />
instruments. Though disseminated to all the customers simultaneously, not all customers may receive this report at the same time. <strong>ICICI</strong> Securities will not treat recipients as customers by virtue of their<br />
receiving this report. Nothing in this report constitutes investment, legal, accounting and tax advice or a representation that any investment or strategy is suitable or appropriate to your specific<br />
circumstances. The securities discussed and opinions expressed in this report may not be suitable for all investors, who must make their own investment decisions, based on their own investment<br />
objectives, financial positions and needs of specific recipient. This may not be taken in substitution for the exercise of independent judgment by any recipient. The recipient should independently evaluate<br />
the investment risks. The value and return of investment may vary because of changes in interest rates, foreign exchange rates or any other reason. <strong>ICICI</strong> Securities and affiliates accept no liabilities for any<br />
loss or damage of any kind arising out of the use of this report. Past performance is not necessarily a guide to future performance. Investors are advised to see Risk Disclosure Document to understand the<br />
risks associated before investing in the securities markets. Actual results may differ materially from those set forth in projections. Forward-looking statements are not predictions and may be subject to<br />
change without notice.<br />
<strong>ICICI</strong> Securities and its affiliates might have managed or co-managed a public offering for the subject company in the preceding twelve months. <strong>ICICI</strong> Securities and affiliates might have received<br />
compensation from the companies mentioned in the report during the period preceding twelve months from the date of this report for services in respect of public offerings, corporate finance, investment<br />
banking or other advisory services in a merger or specific transaction. It is confirmed that Chirag J Shah PGDBM Sonabh Bubna MBA research analysts and the authors of this report have not received any<br />
compensation from the companies mentioned in the report in the preceding twelve months. Our research professionals are paid in part based on the profitability of <strong>ICICI</strong> Securities, which include earnings<br />
from Investment Banking and other business.<br />
<strong>ICICI</strong> Securities or its subsidiaries collectively do not own 1% or more of the equity securities of the Company mentioned in the report as of the last day of the month preceding the publication of the<br />
research report.<br />
It is confirmed that Chirag J Shah PGDBM Sonabh Bubna MBA research analysts and the authors of this report or any of their family members does not serve as an officer, director or advisory board<br />
member of the companies mentioned in the report.<br />
<strong>ICICI</strong> Securities may have issued other reports that are inconsistent with and reach different conclusion from the information presented in this report. <strong>ICICI</strong> Securities and affiliates may act upon or make use<br />
of information contained in the report prior to the publication thereof.<br />
This report is not directed or intended for distribution to, or use by, any person or entity who is a citizen or resident of or located in any locality, state, country or other jurisdiction, where such distribution,<br />
publication, availability or use would be contrary to law, regulation or which would subject <strong>ICICI</strong> Securities and affiliates to any registration or licensing requirement within such jurisdiction. The securities<br />
described herein may or may not be eligible for sale in all jurisdictions or to certain category of investors. Persons in whose possession this document may come are required to inform themselves of and<br />
to observe such restriction.<br />
<strong>ICICI</strong> Securities Ltd | Retail Equity Research Page 9


