Tata Teleservices Mah. Ltd. (HUGTEL)
Tata Teleservices Mah. Ltd. (HUGTEL)
Tata Teleservices Mah. Ltd. (HUGTEL)

Create successful ePaper yourself
Turn your PDF publications into a flip-book with our unique Google optimized e-Paper software.
Result Update<br />
Rating matrix<br />
Rating : Hold<br />
Target : | 12<br />
Target Period : 12 months<br />
Potential Upside : -6%<br />
Key Financials<br />
(| Crore) FY10 FY11E FY12E FY13E<br />
Net Sales 2098.3 2303.1 2488.4 2489.3<br />
EBITDA 385.3 301.6 529.8 619.2<br />
Net Profit -318.0 80.2 -517.6 -482.5<br />
EPS | -1.7 0.4 -2.7 -2.5<br />
Valuation summary<br />
FY10 FY11E FY12E FY13E<br />
PE (x) - - - -<br />
Target PE (x) - - - -<br />
EV/EBITDA (x) 16.7 23.5 15.1 13.0<br />
P/BV (x) 1.0 1.0 1.0 1.0<br />
RoNW (%) -12.8 3.2 -20.9 -19.5<br />
RoCE (%) -2.8 -6.4 -0.2 0.6<br />
Stock data<br />
Market Capitalisation | 2523.3 Crore<br />
Debt-Cons. (FY11) | 4652.6 Crore<br />
Cash & Invst.-Cons. (FY11) | 74.7 Crore<br />
EV | 7101.2 Crore<br />
52 week H/L 24 / 12<br />
Equity capital | 1897.2 Crore<br />
Face value | 10<br />
MF Holding (%) 0.7<br />
FII Holding (%) 0.7<br />
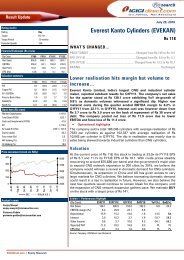
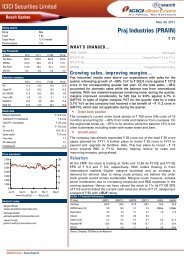
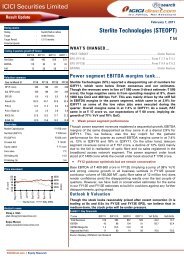
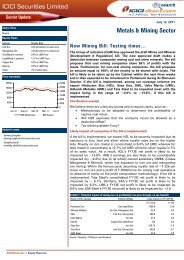
Price movement<br />
7,000<br />
6,000<br />
5,000<br />
4,000<br />
3,000<br />
2,000<br />
1,000<br />
0<br />
May-11<br />
Analyst’s name<br />
Aug-11<br />
Nov-11<br />
Karan Mittal<br />
karan.mittal@icicisecurities.com<br />
Anil Shenoy<br />
anil.shenoy@icicisecurities.com<br />
Feb-12<br />
Price (L.H.S) Nifty (R.H.S)<br />
ICICI Securities <strong>Ltd</strong> | Retail Equity Research<br />
25<br />
20<br />
15<br />
10<br />
5<br />
0<br />
May-12<br />
WHAT’S CHANGED…<br />
May 7, 2012<br />
PRICE TARGET........................................................................... Changed from | 15 to | 12<br />
EPS (FY12E)......................................................................... Changed from - | 2.6 to - | 2.7<br />
EPS (FY13E)......................................................................... Changed from - | 2.6 to - | 2.5<br />
RATING...............................................................................................................Unchanged<br />
Subscriber base continues to fall…<br />
<strong>Tata</strong> <strong>Teleservices</strong> <strong>Mah</strong>arashtra (TTML) reported its Q4FY12 numbers. The<br />
topline stood at | 651.5 crore against our expectation of | 595.2 crore,<br />
growing 10.6% YoY and 3.3% QoQ. EBITDA for the quarter stood at<br />
| 138.6 crore against our estimate of | 157.3 crore, growing 4.3% QoQ.<br />
The EBITDA margin stood at 21.3% improving 20 bps QoQ. The company<br />
reported a net loss of | 123.4 crore against our estimation of | 103.0<br />
crore. TTML reported a forex loss of | 5.2 crore.<br />
Highlights of the quarter<br />
While the revenues of the company grew 3.3% QoQ, the wireless<br />
subscriber base fell drastically from 14.8 million in Q3FY12 to 13.3 million<br />
in Q4FY12 representing a fall of 9.7%. Even in Q3FY12, the company<br />
witnessed a fall in subscriber base from 16.8 million to 14.8 million. The<br />
wireline subscriber base, however, grew 2.4% to 0.78 million in Q4FY12.<br />
The EBITDA margin for the company improved by 20 bps QoQ to 21.3%<br />
as EBITDA in Q3FY12 included provisions of | 13.3 crore made by the<br />
company. Keeping provisions aside, the EBITDA margin fell by 190 bps<br />
owing to higher network operating expenditure in this quarter.<br />
Valuation<br />
<strong>Tata</strong> <strong>Teleservices</strong> <strong>Mah</strong>. <strong>Ltd</strong>. (<strong>HUGTEL</strong>)<br />
A continuous decline in the subscriber base including in this quarter is a<br />
major concern. We expect the topline to grow at 4.0% CAGR over FY11-<br />
13E. However, the net loss is expected to increase to | 482.5 crore by<br />
FY13 from positive PAT of | 80.2 crore in FY11 (on account of the sale of<br />
the tower company for | 865.4 crore). Valuing the company at 35%<br />
discount to Bharti Airtel at 1.0x FY13E sales, we have arrived at a target<br />
price of | 12. At the CMP of | 13, the stock is trading at 1.0x FY13E sales.<br />
Our target price of | 12 implies a downside of -6%. We continue to rate<br />
the stock as HOLD.<br />
Exhibit 1: Valuation Metrics<br />
(| Crore) Q4FY12 Q4FY12E Q4FY11 Q3FY12 QoQ (Chg %) YoY (Chg %)<br />
Net Sales 651.5 595.2 589.2 630.6 3.3 10.6<br />
EBITDA 138.6 157.3 111.3 132.9 4.3 24.6<br />
EBITDA Margin (%) 21.3 26.4 18.9 21.1 20 bps 239 bps<br />
Depreciation 143.0 136.9 334.5 139.4 2.6 -57.2<br />
Interest 127.7 124.8 113.9 141.5 -9.7 12.1<br />
Net Profit -123.4 -103.0 -300.2 -144.6 -14.7 -58.9<br />
EPS (|) -0.7 -0.5 -1.6 -0.8 -14.7 -58.9<br />
Source: Company, ICICIdirect.com Research<br />
| 13
Result analysis<br />
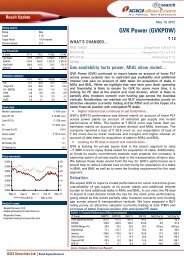
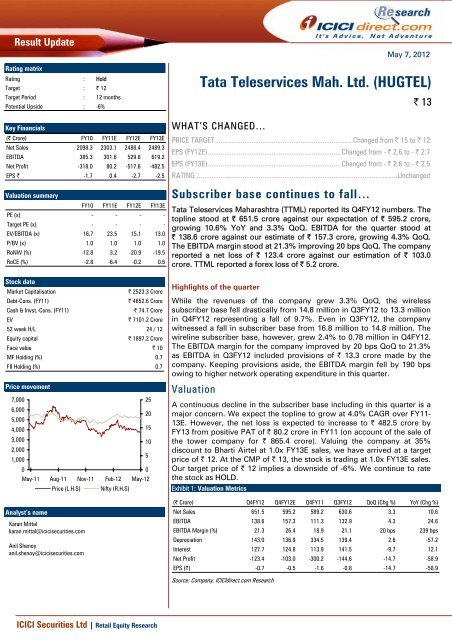
Margins improve…<br />
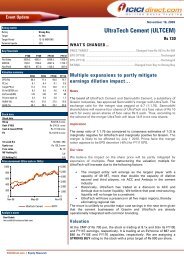
The EBITDA margin of the company improved by 20 bps QoQ to 21.3%<br />
as EBITDA in Q3FY12 included provisions of | 13.3 crore made by the<br />
company. Keeping the provisions aside, the EBITDA margin fell by 190<br />
bps owing to higher network operating expenditure in this quarter.<br />
The PAT margin improved from a negative 22.9% to a negative 18.9% in<br />
Q4FY12 primarily due to lower interest cost. The interest cost fell from<br />
| 141.5 crore to | 127.7 crore.<br />
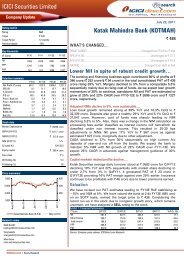
Exhibit 2: EBITDA & PAT margin trend<br />
120.0<br />
100.0<br />
80.0<br />
60.0<br />
40.0<br />
20.0<br />
0.0<br />
-20.0<br />
-40.0<br />
-60.0<br />
-11.7<br />
ICICI Securities <strong>Ltd</strong> | Retail Equity Research Page 2<br />
99.6<br />
-8.9<br />
19.5 22.2 18.9 20.2 22.7 21.1 21.3<br />
Q4FY10 Q1FY11 Q2FY11 Q3FY11 Q4FY11 Q1FY12 Q2FY12 Q3FY12 Q4FY12<br />
-22.7<br />
-17.0 -13.8<br />
-20.2 -21.1 -22.9 -18.9<br />
Source: Company, ICICIdirect.com Research<br />
-50.9<br />
EBITDA Margin PAT Margin
Outlook & valuation<br />
The sequential decline in subscribers remains a major concern for TTML.<br />
Also, the active subscriber base has been declining over the past few<br />
quarters. The company has not declared the key metrics for Q4FY12 as<br />
yet.<br />
VAS share in Q3FY12 stood at 32.7% declining from 33.3% in Q2FY12.<br />
Though this is significantly higher than its peers owing to high usage of<br />
<strong>Tata</strong> Photon devices, the sequential decline may be a concern, going<br />
ahead.<br />
We estimate the topline will grow at 4.0% CAGR over FY11-13E.<br />
However, the net loss is expected to increase to | 482.5 crore by FY13<br />
from positive PAT of | 80.2 crore in FY11 (on account of the sale of the<br />
tower company for | 865.4 crore).<br />
Market cap to sales based target price of | 12/share<br />
TTML, having a presence only in two circles and limited access to 2G<br />
spectrum has been assigned a discount of 35% to Airtel’s multiple, which<br />
is valued at a current market capitalisation of 1.5x FY13E sales.<br />
Thus, valuing the stock at 1.0x FY13E sales of | 2489 crore, we have<br />
arrived at a target market capitalisation of | 2371 crore, implying per<br />
share value of | 12.<br />
At the CMP of | 13, the stock is trading at 1.0x FY13E sales. Our target<br />
price of | 12 implies a downside of 6%. We continue to rate the stock as<br />
HOLD.<br />
Exhibit 3: Key assumptions<br />
Particulars Units<br />
Bharti Mcap | Crore 118355<br />
FY13E Sales | Crore 80774<br />
Mcap/Sales x 1.5<br />
TTML discount to Bharti % 35%<br />
Target multiple x 1.0<br />
TTML FY13E Sales | Crore 2489<br />
Target Mcap | Crore 2371<br />
No. of Equity shares Crore 189.7<br />
Price per equity share<br />
Source: Company, ICICIdirect.com Research<br />
| 12<br />
Exhibit 4: Valuation table<br />
Sales Growth EPS Growth PE EV/EBITDA RoNW RoCE<br />
(| Cr) (%) (|) (%) (x) (x) (%) (%)<br />
FY10 2098.3 -1.7 NA 16.7 -12.8 -2.8<br />
FY11 2303.1 9.8 0.4 NA 31.5 23.5 3.2 -6.4<br />
FY12E 2488.4 8.0 -2.7 NA NA 15.1 -20.9 -0.2<br />
FY13E 2489.3 0.0 -2.5 NA NA 13.0 -19.5 0.6<br />
Source: Company, ICICIdirect.com Research<br />
ICICI Securities <strong>Ltd</strong> | Retail Equity Research Page 3
Financial summary<br />
Profit and loss statement<br />
(| Crore)<br />
(Year-end March) FY10 FY11 FY12 FY13E<br />
Total operating Income 2,098.3 2,303.1 2,488.4 2,489.3<br />
Growth (%) 7.8 9.8 8.0 0.0<br />
Network Operating Costs 506.5 631.2 787.4 738.4<br />
Employee Expenses 440.9 457.0 475.4 427.9<br />
Marketing Expenses 371.9 322.0 259.7 271.6<br />
Other Expenses 393.6 591.3 436.1 432.1<br />
Total Operating Expenditure 1,713.0 2,001.5 1,958.6 1,870.0<br />
EBITDA 385.3 301.6 529.8 619.2<br />
Growth (%) -21.0 -21.7 75.7 16.9<br />
Depreciation 564.0 757.6 543.4 572.4<br />
Interest 350.5 351.7 521.2 542.2<br />
Other Income 211.2 888.0 17.3 12.9<br />
PBT -318.0 80.2 -517.6 -482.5<br />
Total Tax 0.0 0.0 0.0 0.0<br />
PAT -318.0 80.2 -517.6 -482.5<br />
Growth (%) NM NM NM NM<br />
EPS (|) -1.7 0.4 -2.7 -2.5<br />
Source: Company, ICICIdirect.com Research<br />
Balance sheet<br />
(Year-end March)<br />
Liabilities<br />
FY10 FY11 FY12<br />
(| Crore)<br />
FY13E<br />
Equity Capital 1,897.2 1,897.2 1,897.2 1,897.2<br />
Reserve and Surplus 583.2 583.2 583.2 583.2<br />
Total Shareholders funds 2,480.4 2,480.4 2,480.4 2,480.4<br />
Total Debt 3,940.0 4,652.6 5,607.6 5,707.6<br />
Others 0.0 0.0 4.5 4.5<br />
Total Liabilities 6,420.3 7,133.0 8,092.5 8,192.5<br />
Assets<br />
Gross Block 6,163.6 7,840.4 8,298.7 8,636.9<br />
Less: Acc Depreciation 2,212.4 2,947.7 3,491.1 4,063.6<br />
Net Block 3,951.2 4,892.7 4,807.5 4,573.3<br />
Capital WIP 204.7 63.2 243.1 243.1<br />
Total Fixed Assets 4,155.9 4,955.9 5,050.6 4,816.4<br />
Inventories 6.4 3.8 3.8 3.8<br />
Debtors 292.4 295.0 304.8 254.4<br />
Cash 23.0 74.7 138.0 152.3<br />
Loans and Advances 331.1 517.5 460.5 460.6<br />
Other Current Assets 0.0 0.0 172.1 172.2<br />
Total Current Assets 653.0 890.9 1,079.2 1,043.3<br />
Creditors 1,552.9 1,619.1 1,451.0 1,549.8<br />
Provisions 12.7 191.6 200.7 214.4<br />
Total Current Liabilities 1,565.6 1,810.6 1,651.7 1,764.1<br />
Net Current Assets -912.6 -919.7 -572.5 -720.8<br />
P&L Account Balance 3,177.0 3,096.8 3,614.3 4,096.8<br />
Application of Funds 6,420.3 7,133.0 8,092.5 8,192.5<br />
Source: Company, ICICIdirect.com Research<br />
Cash flow statement<br />
(Year-end March) FY10 FY11 FY12<br />
(| Crore)<br />
FY13E<br />
Profit after Tax -318.0 80.2 -517.6 -482.5<br />
Add: Depreciation 564.0 757.6 543.4 572.4<br />
(Inc)/dec in Current Assets -66.5 -186.3 -125.0 50.2<br />
Inc/(dec) in CL and Provisions 504.7 245.0 -159.0 112.5<br />
CF from operating activities 684.2 896.6 -258.1 252.6<br />
(Inc)/dec in Investments 10.0 0.0 0.0 0.0<br />
(Inc)/dec in Fixed Assets -1,294.3 -1,557.6 -638.2 -338.2<br />
Others 0.0 0.0 4.5 0.0<br />
CF from investing activities -1,284.3 -1,557.6 -633.6 -338.2<br />
Inc/(dec) in Unsecured loan 130.8 673.8 -1,206.6 0.0<br />
Inc/(dec) in Secured loans 464.8 38.8 2,161.6 100.0<br />
CF from financing activities 595.7 712.6 955.0 100.0<br />
Net Cash flow -4.5 51.7 63.3 14.4<br />
Opening Cash 27.5 23.0 74.7 138.0<br />
Closing Cash 23.0 74.7 138.0 152.3<br />
Source: Company, ICICIdirect.com Research<br />
Key ratios<br />
(Year-end March)<br />
Per share data (|)<br />
FY10 FY11 FY12 FY13E<br />
EPS -1.7 0.4 -2.7 -2.5<br />
Cash EPS 1.3 4.4 0.1 0.5<br />
BV 13.1 13.1 13.1 13.1<br />
DPS 0.0 0.0 0.0 0.0<br />
Cash Per Share<br />
Operating Ratios (%)<br />
0.1 0.4 0.7 0.8<br />
EBITDA Margin 18.4 13.1 21.3 24.9<br />
PBT / Total Operating income -15.2 3.5 -20.8 -19.4<br />
PAT Margin -15.2 3.5 -20.8 -19.4<br />
Inventory days - - - -<br />
Debtor days 47.4 46.5 44.0 41.0<br />
Creditor days<br />
Return Ratios (%)<br />
224.1 251.4 225.2 220.0<br />
RoE -12.8 3.2 -20.9 -19.5<br />
RoCE -2.8 -6.4 -0.2 0.6<br />
RoIC<br />
Valuation Ratios (x)<br />
-2.8 -6.5 -0.2 0.6<br />
P/E 0.0 31.5 0.0 0.0<br />
EV / EBITDA 16.7 23.5 15.1 13.0<br />
EV / Net Sales 3.1 3.1 3.2 3.2<br />
Market Cap / Sales 1.2 1.1 1.0 1.0<br />
Price to Book Value<br />
Solvency Ratios<br />
1.0 1.0 1.0 1.0<br />
Debt/EBITDA 10.2 15.4 10.6 9.2<br />
Debt / Equity 1.6 1.9 2.3 2.3<br />
Current Ratio 0.4 0.5 0.7 0.6<br />
Quick Ratio 0.4 0.5 0.6 0.5<br />
Source: Company, ICICIdirect.com Research<br />
ICICI Securities <strong>Ltd</strong> | Retail Equity Research Page 4
ICICIdirect.com coverage universe (Telecom companies)<br />
Bharti Airtel Sales (| Cr) EPS (|) PE (x) EV/EBITDA (x) RoNW (%) RoCE (%)<br />
Idirect Code BHATE FY11 59467.2 15.9 19.6 8.9 12.4 8.6<br />
CMP 312 FY12 71450.8 11.2 27.8 7.8 8.4 8.4<br />
Target 420 FY13E 80773.9 16.3 19.1 6.5 11.0 10.4<br />
MCap (| Cr)<br />
RCOM<br />
118,355 % Upside 34.8% FY14E 88828.4 22.7 13.7 5.4 13.4 12.5<br />
Idirect Code RELCOM FY11 22430.4 6.5 11.2 5.9 3.3 2.4<br />
CMP 73 FY12E 19408.1 3.4 21.1 8.8 1.7 2.1<br />
Target 84 FY13E 20773.7 2.2 33.3 7.7 1.1 2.3<br />
MCap (| Cr)<br />
Idea<br />
15,026 % Upside 15.6% FY14E 21849.6 3.6 20.2 6.4 1.8 2.7<br />
Idirect Code IDECEL FY11 15438.4 2.7 29.8 10.3 7.3 5.5<br />
CMP 81 FY12E 19541.2 2.2 37.1 7.8 5.6 8.0<br />
Target 85 FY13E 23682.2 3.7 22.0 6.0 8.6 10.8<br />
MCap (| Cr)<br />
TTML<br />
26,790 % Upside 4.9% FY14E 26561.7 5.8 14.0 4.8 11.9 14.2<br />
Idirect Code <strong>HUGTEL</strong> FY10 2098.3 -1.7 NA 16.7 -12.8 -2.8<br />
CMP 13 FY11 2303.1 0.4 31.5 23.5 3.2 -6.4<br />
Target 12 FY12E 2488.4 -2.7 NA 15.1 -20.9 -0.2<br />
MCap (| Cr) 2,523 % Upside<br />
Source: Company, ICICIdirect.com Research<br />
-6.0% FY13E 2489.3 -2.5 NA 13.0 -19.5 0.6<br />
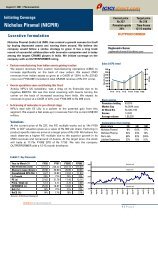
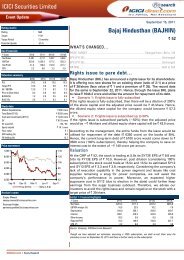
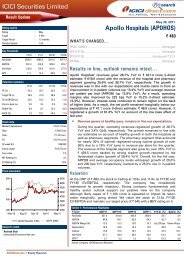
Exhibit 5: Recommendation History<br />
25<br />
20<br />
15<br />
10<br />
5<br />
0<br />
May-11<br />
Jun-11<br />
ICICI Securities <strong>Ltd</strong> | Retail Equity Research Page 5<br />
Aug-11<br />
Source: Reutuers, ICICIdirect.com Research<br />
Sep-11<br />
Nov-11<br />
Dec-11<br />
Price Target Price<br />
Feb-12<br />
Mar-12<br />
May-12<br />
Exhibit 6: Recent Releases<br />
Date Event CMP Target Price Rating<br />
5-Jul-11 Q1FY12 Result Preview 20 17 SELL<br />
3-Aug-11 Q1FY12 Result Update 21 19 SELL<br />
5-Jul-11 Q2FY12 Result Preview 17 17 HOLD<br />
29-Nov-11 Q2FY12 Result Update 15 16 HOLD<br />
6-Jan-12 Q3FY12 Result Preview 13 16 BUY<br />
7-Feb-12 Q3FY12 Result Update 16 16 HOLD<br />
4-Apr-12 Q4FY12 Result Preview 15 15 HOLD<br />
Source: Company, ICICIdirect.com Research
RATING RATIONALE<br />
ICICIdirect.com endeavours to provide objective opinions and recommendations. ICICIdirect.com assigns<br />
ratings to its stocks according to their notional target price vs. current market price and then categorises them<br />
as Strong Buy, Buy, Hold and Sell. The performance horizon is two years unless specified and the notional<br />
target price is defined as the analysts' valuation for a stock.<br />
Strong Buy: >15%/20% for large caps/midcaps, respectively, with high conviction;<br />
Buy: >10%/15% for large caps/midcaps, respectively;<br />
Hold: Up to +/-10%;<br />
Sell: -10% or more;<br />
ANALYST CERTIFICATION<br />
Pankaj Pandey Head – Research pankaj.pandey@icicisecurities.com<br />
ICICIdirect.com Research Desk,<br />
ICICI Securities Limited,<br />
1st Floor, Akruti Trade Centre,<br />
Road No 7, MIDC,<br />
Andheri (East)<br />
Mumbai – 400 093<br />
research@icicidirect.com<br />
We /I, Karan Mittal MBA, Anil Shenoy MBA research analysts, authors and the names subscribed to this report, hereby certify that all of the views expressed in this research report accurately reflect our<br />
personal views about any and all of the subject issuer(s) or securities. We also certify that no part of our compensation was, is, or will be directly or indirectly related to the specific recommendation(s) or<br />
view(s) in this report. Analysts aren't registered as research analysts by FINRA and might not be an associated person of the ICICI Securities Inc.<br />
Disclosures:<br />
ICICI Securities Limited (ICICI Securities) and its affiliates are a full-service, integrated investment banking, investment management and brokerage and financing group. We along with affiliates are leading<br />
underwriter of securities and participate in virtually all securities trading markets in India. We and our affiliates have investment banking and other business relationship with a significant percentage of<br />
companies covered by our Investment Research Department. Our research professionals provide important input into our investment banking and other business selection processes. ICICI Securities<br />
generally prohibits its analysts, persons reporting to analysts and their dependent family members from maintaining a financial interest in the securities or derivatives of any companies that the analysts<br />
cover.<br />
The information and opinions in this report have been prepared by ICICI Securities and are subject to change without any notice. The report and information contained herein is strictly confidential and<br />
meant solely for the selected recipient and may not be altered in any way, transmitted to, copied or distributed, in part or in whole, to any other person or to the media or reproduced in any form, without<br />
prior written consent of ICICI Securities. While we would endeavour to update the information herein on reasonable basis, ICICI Securities, its subsidiaries and associated companies, their directors and<br />
employees (“ICICI Securities and affiliates”) are under no obligation to update or keep the information current. Also, there may be regulatory, compliance or other reasons that may prevent ICICI Securities<br />
from doing so. Non-rated securities indicate that rating on a particular security has been suspended temporarily and such suspension is in compliance with applicable regulations and/or ICICI Securities<br />
policies, in circumstances where ICICI Securities is acting in an advisory capacity to this company, or in certain other circumstances.<br />
This report is based on information obtained from public sources and sources believed to be reliable, but no independent verification has been made nor is its accuracy or completeness guaranteed. This<br />
report and information herein is solely for informational purpose and may not be used or considered as an offer document or solicitation of offer to buy or sell or subscribe for securities or other financial<br />
instruments. Though disseminated to all the customers simultaneously, not all customers may receive this report at the same time. ICICI Securities will not treat recipients as customers by virtue of their<br />
receiving this report. Nothing in this report constitutes investment, legal, accounting and tax advice or a representation that any investment or strategy is suitable or appropriate to your specific<br />
circumstances. The securities discussed and opinions expressed in this report may not be suitable for all investors, who must make their own investment decisions, based on their own investment<br />
objectives, financial positions and needs of specific recipient. This may not be taken in substitution for the exercise of independent judgment by any recipient. The recipient should independently evaluate<br />
the investment risks. The value and return of investment may vary because of changes in interest rates, foreign exchange rates or any other reason. ICICI Securities and affiliates accept no liabilities for any<br />
loss or damage of any kind arising out of the use of this report. Past performance is not necessarily a guide to future performance. Investors are advised to see Risk Disclosure Document to understand the<br />
risks associated before investing in the securities markets. Actual results may differ materially from those set forth in projections. Forward-looking statements are not predictions and may be subject to<br />
change without notice.<br />
ICICI Securities and its affiliates might have managed or co-managed a public offering for the subject company in the preceding twelve months. ICICI Securities and affiliates might have received<br />
compensation from the companies mentioned in the report during the period preceding twelve months from the date of this report for services in respect of public offerings, corporate finance, investment<br />
banking or other advisory services in a merger or specific transaction. It is confirmed that Karan Mittal MBA Anil Shenoy MBA research analysts and the authors of this report have not received any<br />
compensation from the companies mentioned in the report in the preceding twelve months. Our research professionals are paid in part based on the profitability of ICICI Securities, which include earnings<br />
from Investment Banking and other business.<br />
ICICI Securities or its subsidiaries collectively do not own 1% or more of the equity securities of the Company mentioned in the report as of the last day of the month preceding the publication of the<br />
research report.<br />
It is confirmed that Karan Mittal MBA Anil Shenoy MBA research analysts and the authors of this report or any of their family members does not serve as an officer, director or advisory board member of<br />
the companies mentioned in the report.<br />
ICICI Securities may have issued other reports that are inconsistent with and reach different conclusion from the information presented in this report. ICICI Securities and affiliates may act upon or make use<br />
of information contained in the report prior to the publication thereof.<br />
This report is not directed or intended for distribution to, or use by, any person or entity who is a citizen or resident of or located in any locality, state, country or other jurisdiction, where such distribution,<br />
publication, availability or use would be contrary to law, regulation or which would subject ICICI Securities and affiliates to any registration or licensing requirement within such jurisdiction. The securities<br />
described herein may or may not be eligible for sale in all jurisdictions or to certain category of investors. Persons in whose possession this document may come are required to inform themselves of and<br />
to observe such restriction.<br />
ICICI Securities <strong>Ltd</strong> | Retail Equity Research Page 6