Tata Teleservices Mah. Ltd. (HUGTEL)
Tata Teleservices Mah. Ltd. (HUGTEL)
Tata Teleservices Mah. Ltd. (HUGTEL)

Create successful ePaper yourself
Turn your PDF publications into a flip-book with our unique Google optimized e-Paper software.
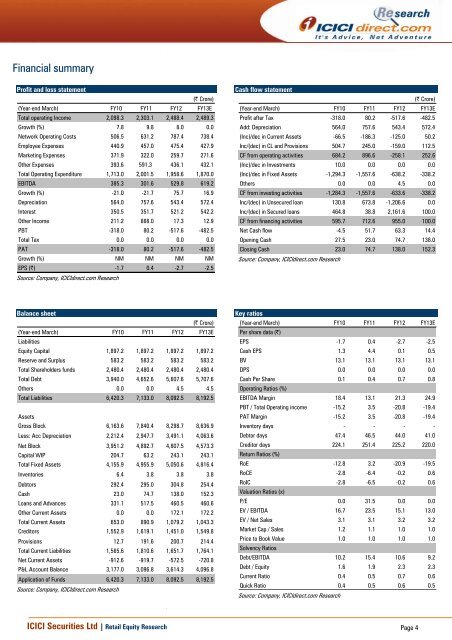
Financial summary<br />
Profit and loss statement<br />
(| Crore)<br />
(Year-end March) FY10 FY11 FY12 FY13E<br />
Total operating Income 2,098.3 2,303.1 2,488.4 2,489.3<br />
Growth (%) 7.8 9.8 8.0 0.0<br />
Network Operating Costs 506.5 631.2 787.4 738.4<br />
Employee Expenses 440.9 457.0 475.4 427.9<br />
Marketing Expenses 371.9 322.0 259.7 271.6<br />
Other Expenses 393.6 591.3 436.1 432.1<br />
Total Operating Expenditure 1,713.0 2,001.5 1,958.6 1,870.0<br />
EBITDA 385.3 301.6 529.8 619.2<br />
Growth (%) -21.0 -21.7 75.7 16.9<br />
Depreciation 564.0 757.6 543.4 572.4<br />
Interest 350.5 351.7 521.2 542.2<br />
Other Income 211.2 888.0 17.3 12.9<br />
PBT -318.0 80.2 -517.6 -482.5<br />
Total Tax 0.0 0.0 0.0 0.0<br />
PAT -318.0 80.2 -517.6 -482.5<br />
Growth (%) NM NM NM NM<br />
EPS (|) -1.7 0.4 -2.7 -2.5<br />
Source: Company, ICICIdirect.com Research<br />
Balance sheet<br />
(Year-end March)<br />
Liabilities<br />
FY10 FY11 FY12<br />
(| Crore)<br />
FY13E<br />
Equity Capital 1,897.2 1,897.2 1,897.2 1,897.2<br />
Reserve and Surplus 583.2 583.2 583.2 583.2<br />
Total Shareholders funds 2,480.4 2,480.4 2,480.4 2,480.4<br />
Total Debt 3,940.0 4,652.6 5,607.6 5,707.6<br />
Others 0.0 0.0 4.5 4.5<br />
Total Liabilities 6,420.3 7,133.0 8,092.5 8,192.5<br />
Assets<br />
Gross Block 6,163.6 7,840.4 8,298.7 8,636.9<br />
Less: Acc Depreciation 2,212.4 2,947.7 3,491.1 4,063.6<br />
Net Block 3,951.2 4,892.7 4,807.5 4,573.3<br />
Capital WIP 204.7 63.2 243.1 243.1<br />
Total Fixed Assets 4,155.9 4,955.9 5,050.6 4,816.4<br />
Inventories 6.4 3.8 3.8 3.8<br />
Debtors 292.4 295.0 304.8 254.4<br />
Cash 23.0 74.7 138.0 152.3<br />
Loans and Advances 331.1 517.5 460.5 460.6<br />
Other Current Assets 0.0 0.0 172.1 172.2<br />
Total Current Assets 653.0 890.9 1,079.2 1,043.3<br />
Creditors 1,552.9 1,619.1 1,451.0 1,549.8<br />
Provisions 12.7 191.6 200.7 214.4<br />
Total Current Liabilities 1,565.6 1,810.6 1,651.7 1,764.1<br />
Net Current Assets -912.6 -919.7 -572.5 -720.8<br />
P&L Account Balance 3,177.0 3,096.8 3,614.3 4,096.8<br />
Application of Funds 6,420.3 7,133.0 8,092.5 8,192.5<br />
Source: Company, ICICIdirect.com Research<br />
Cash flow statement<br />
(Year-end March) FY10 FY11 FY12<br />
(| Crore)<br />
FY13E<br />
Profit after Tax -318.0 80.2 -517.6 -482.5<br />
Add: Depreciation 564.0 757.6 543.4 572.4<br />
(Inc)/dec in Current Assets -66.5 -186.3 -125.0 50.2<br />
Inc/(dec) in CL and Provisions 504.7 245.0 -159.0 112.5<br />
CF from operating activities 684.2 896.6 -258.1 252.6<br />
(Inc)/dec in Investments 10.0 0.0 0.0 0.0<br />
(Inc)/dec in Fixed Assets -1,294.3 -1,557.6 -638.2 -338.2<br />
Others 0.0 0.0 4.5 0.0<br />
CF from investing activities -1,284.3 -1,557.6 -633.6 -338.2<br />
Inc/(dec) in Unsecured loan 130.8 673.8 -1,206.6 0.0<br />
Inc/(dec) in Secured loans 464.8 38.8 2,161.6 100.0<br />
CF from financing activities 595.7 712.6 955.0 100.0<br />
Net Cash flow -4.5 51.7 63.3 14.4<br />
Opening Cash 27.5 23.0 74.7 138.0<br />
Closing Cash 23.0 74.7 138.0 152.3<br />
Source: Company, ICICIdirect.com Research<br />
Key ratios<br />
(Year-end March)<br />
Per share data (|)<br />
FY10 FY11 FY12 FY13E<br />
EPS -1.7 0.4 -2.7 -2.5<br />
Cash EPS 1.3 4.4 0.1 0.5<br />
BV 13.1 13.1 13.1 13.1<br />
DPS 0.0 0.0 0.0 0.0<br />
Cash Per Share<br />
Operating Ratios (%)<br />
0.1 0.4 0.7 0.8<br />
EBITDA Margin 18.4 13.1 21.3 24.9<br />
PBT / Total Operating income -15.2 3.5 -20.8 -19.4<br />
PAT Margin -15.2 3.5 -20.8 -19.4<br />
Inventory days - - - -<br />
Debtor days 47.4 46.5 44.0 41.0<br />
Creditor days<br />
Return Ratios (%)<br />
224.1 251.4 225.2 220.0<br />
RoE -12.8 3.2 -20.9 -19.5<br />
RoCE -2.8 -6.4 -0.2 0.6<br />
RoIC<br />
Valuation Ratios (x)<br />
-2.8 -6.5 -0.2 0.6<br />
P/E 0.0 31.5 0.0 0.0<br />
EV / EBITDA 16.7 23.5 15.1 13.0<br />
EV / Net Sales 3.1 3.1 3.2 3.2<br />
Market Cap / Sales 1.2 1.1 1.0 1.0<br />
Price to Book Value<br />
Solvency Ratios<br />
1.0 1.0 1.0 1.0<br />
Debt/EBITDA 10.2 15.4 10.6 9.2<br />
Debt / Equity 1.6 1.9 2.3 2.3<br />
Current Ratio 0.4 0.5 0.7 0.6<br />
Quick Ratio 0.4 0.5 0.6 0.5<br />
Source: Company, ICICIdirect.com Research<br />
ICICI Securities <strong>Ltd</strong> | Retail Equity Research Page 4