GVK Power (GVKPOW) - ICICI Direct
GVK Power (GVKPOW) - ICICI Direct
GVK Power (GVKPOW) - ICICI Direct

You also want an ePaper? Increase the reach of your titles
YUMPU automatically turns print PDFs into web optimized ePapers that Google loves.
Result Update<br />
Rating matrix<br />
Rating : Buy<br />
Target : | 18<br />
Target Period : 18-24 months<br />
Potential Upside : 51%<br />
Key Financials<br />
| Crore FY11 FY12 FY13E FY14E<br />
Net Sales 1,915 2,491.8 3,769.0 5,650.2<br />
EBITDA 514.0 684.0 1,437.8 2,342.8<br />
Net Profit* 154.9 61.5 76.2 151.9<br />
EPS (|)* 1.0 0.4 0.5 1.0<br />
Valuation summary<br />
FY11 FY12 FY13E FY14E<br />
P/E 12.1 30.6 24.7 12.4<br />
Target P/E 18.3 46.0 37.1 18.6<br />
EV / EBITDA 13.8 20.5 11.5 7.0<br />
P/BV 0.6 0.5 0.5 0.5<br />
RoNW 4.6 1.8 2.2 4.1<br />
RoCE 3.3 2.1 4.3 7.1<br />
Stock data<br />
Market Capitalisation | 1879 crore<br />
Debt (FY 12) | 13,884 crore<br />
Cash (FY12) | 1726 crore<br />
EV | 14037 crore<br />
52 week H/L (|) 24/10<br />
Equity capital | 157.9 crore<br />
Face value | 1<br />
DII Holding (%) 5.1<br />
FII Holding (%) 18.0<br />
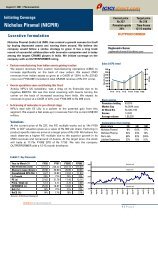
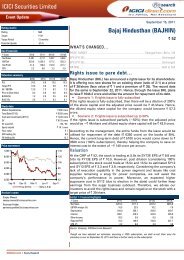
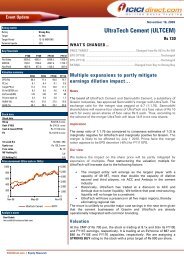
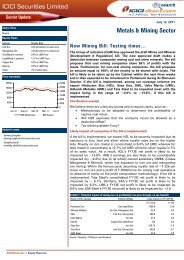
Price movement<br />
6,200<br />
5,500<br />
4,800<br />
4,100<br />
3,400<br />
2,700<br />
2,000<br />
May-11<br />
Analyst’s name<br />
Aug-11<br />
Nov-11<br />
Feb-12<br />
Price (R.H.S) Nifty (L.H.S)<br />
Deepak Purswani, CFA<br />
deepak.purswani@icicisecurities.com<br />
Bhupendra Tiwary<br />
bhupendra.tiwary@icicisecurities.com<br />
<strong>ICICI</strong> Securities Ltd | Retail Equity Research<br />
30<br />
25<br />
20<br />
15<br />
10<br />
5<br />
0<br />
May-12<br />
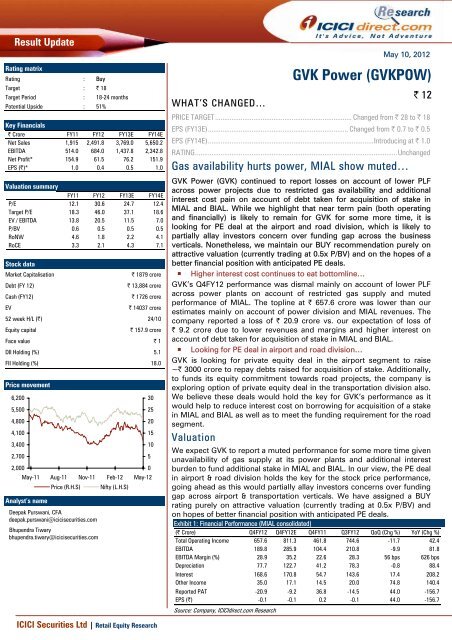
WHAT’S CHANGED…<br />
May 10, 2012<br />
<strong>GVK</strong> <strong>Power</strong> (<strong>GVK</strong>POW)<br />
| 12<br />
PRICE TARGET........................................................................... Changed from | 28 to | 18<br />
EPS (FY13E)............................................................................. Changed from | 0.7 to | 0.5<br />
EPS (FY14E)...........................................................................................Introducing at | 1.0<br />
RATING...............................................................................................................Unchanged<br />
Gas availability hurts power, MIAL show muted…<br />
<strong>GVK</strong> <strong>Power</strong> (<strong>GVK</strong>) continued to report losses on account of lower PLF<br />
across power projects due to restricted gas availability and additional<br />
interest cost pain on account of debt taken for acquisition of stake in<br />
MIAL and BIAL. While we highlight that near term pain (both operating<br />
and financially) is likely to remain for <strong>GVK</strong> for some more time, it is<br />
looking for PE deal at the airport and road division, which is likely to<br />
partially allay investors concern over funding gap across the business<br />
verticals. Nonetheless, we maintain our BUY recommendation purely on<br />
attractive valuation (currently trading at 0.5x P/BV) and on the hopes of a<br />
better financial position with anticipated PE deals.<br />
Higher interest cost continues to eat bottomline…<br />
<strong>GVK</strong>’s Q4FY12 performance was dismal mainly on account of lower PLF<br />
across power plants on account of restricted gas supply and muted<br />
performance of MIAL. The topline at | 657.6 crore was lower than our<br />
estimates mainly on account of power division and MIAL revenues. The<br />
company reported a loss of | 20.9 crore vs. our expectation of loss of<br />
| 9.2 crore due to lower revenues and margins and higher interest on<br />
account of debt taken for acquisition of stake in MIAL and BIAL.<br />
Looking for PE deal in airport and road division…<br />
<strong>GVK</strong> is looking for private equity deal in the airport segment to raise<br />
~| 3000 crore to repay debts raised for acquisition of stake. Additionally,<br />
to funds its equity commitment towards road projects, the company is<br />
exploring option of private equity deal in the transportation division also.<br />
We believe these deals would hold the key for <strong>GVK</strong>’s performance as it<br />
would help to reduce interest cost on borrowing for acquisition of a stake<br />
in MIAL and BIAL as well as to meet the funding requirement for the road<br />
segment.<br />
Valuation<br />
We expect <strong>GVK</strong> to report a muted performance for some more time given<br />
unavailability of gas supply at its power plants and additional interest<br />
burden to fund additional stake in MIAL and BIAL. In our view, the PE deal<br />
in airport & road division holds the key for the stock price performance,<br />
going ahead as this would partially allay investors concerns over funding<br />
gap across airport & transportation verticals. We have assigned a BUY<br />
rating purely on attractive valuation (currently trading at 0.5x P/BV) and<br />
on hopes of better financial position with anticipated PE deals.<br />
Exhibit 1: Financial Performance (MIAL consolidated)<br />
(| Crore) Q4FY12 Q4FY12E Q4FY11 Q3FY12 QoQ (Chg %) YoY (Chg %)<br />
Total Operating Income 657.6 811.3 461.8 744.6 -11.7 42.4<br />
EBITDA 189.8 285.9 104.4 210.8 -9.9 81.8<br />
EBITDA Margin (%) 28.9 35.2 22.6 28.3 56 bps 626 bps<br />
Depreciation 77.7 122.7 41.2 78.3 -0.8 88.4<br />
Interest 168.6 170.8 54.7 143.6 17.4 208.2<br />
Other Income 35.0 17.1 14.5 20.0 74.8 140.4<br />
Reported PAT -20.9 -9.2 36.8 -14.5 44.0 -156.7<br />
EPS (|) -0.1 -0.1 0.2 -0.1 44.0 -156.7<br />
Source: Company, <strong>ICICI</strong>direct.com Research
<strong>GVK</strong>’s power segment performance was dismal in Q4FY12<br />
as power plants reported lower PLF due to continued<br />
restricted supply of gas<br />
Ex MIAL Q4 FY12 performance<br />
Ex-MIAL, <strong>GVK</strong>’s Q4FY12 was below our estimates mainly due to lower<br />
revenues from the power segment on account of restricted gas<br />
availability and, thus, lower PLF. Consequently, the topline (ex MIAL) for<br />
Q4FY12 was at | 333 crore vs. our estimate of | 440.1 crore. The loss at<br />
| 20.9 crore, therefore, was higher than our estimate of net loss of | 9.2<br />
crore mainly on account of the dismal power segment performance and<br />
higher interest for loan taken to fund airport acquisition.<br />
Exhibit 2: Financial performance (ex MIAL)<br />
(| Crore) Q4FY12 Q4FY12E Q4FY11 Q3FY12 QoQ (Chg %) YoY (Chg %)<br />
Total Operating Income 333.0 440.1 461.8 744.6 -55.3 -27.9<br />
EBITDA 86.7 107.5 104.4 210.8 -58.9 -17.0<br />
EBITDA Margin (%) 26.0 24.4 22.6 28.3 -226 bps 343 bps<br />
Depreciation 39.7 47.3 41.2 78.3 -49.4 -3.9<br />
Interest 247.5 122.2 54.7 143.6 72.4 352.5<br />
Reported PAT -20.9 -9.2 36.8 -14.5 44.0 -156.7<br />
EPS (|) -0.1 -0.1 0.2 -0.1 44.0 -156.7<br />
Source: Company, <strong>ICICI</strong>direct.com Research<br />
Segmental Performance<br />
<strong>Power</strong> division<br />
<strong>GVK</strong>’s power segment performance was dismal and revenues saw a<br />
sequential and YoY decline of 31.7% and 30.9%, respectively, in Q3FY12<br />
as power plants reported lower PLF due to restricted supply of gas. The<br />
company would receive interim RLNG supply during the peak demand<br />
season of March-May, which implies that there could be marginal<br />
improvement in PLF particularly in Q1FY13E.<br />
While Gautami <strong>Power</strong> reported revenues of | 114.5 crore, a sequential<br />
decline of ~47%, <strong>GVK</strong> Industries posted a sequential decline of ~15% at<br />
| 166.4 crore in Q4FY12.<br />
Commissioning of one of the four units of the Alaknanda Hydro Project is<br />
expected in December, 2012 and all four units are expected to be<br />
operational by May, 2013 vs. the original commissioning date of March,<br />
2012. The project has witnessed a cost escalation and the revised cost<br />
now stands at | 4600 crore (subject to regulators approval) vs. | 2700<br />
crore originally. Commissioning of the first unit of the Goindwal Sahib<br />
Project is expected by February 2012 and the second unit by June, 2013.<br />
Exhibit 3: <strong>Power</strong> vertical performance<br />
| crore Q4FY12 Q4FY11 Q3FY12 QoQ (Chg %) YoY (Chg %)<br />
Revenue 280.9 403.0 411.4 -31.7 -30.3<br />
EBITDA 39.9 83.6 82.2 -51.4 -52.3<br />
Margin (%) 14.2% 20.7% 20.0%<br />
PAT -37.8 5.8 3.0 -1351.7 -751.7<br />
Margin (%) -13.5% 1.4% 0.7%<br />
Source: Company, <strong>ICICI</strong>direct.com Research<br />
Exhibit 4: Operational highlights of power plants<br />
JP I JP II Gautami<br />
| per unit Q4FY12 Q3FY12 Q4FY11 Q4FY12 Q3FY12 Q4FY11 Q4FY12 Q3FY12 Q4FY11<br />
Realisation 2.8 2.8 2.8 2.8 3.1 3.1 2.3 3.1 3.0<br />
Fuel cost 2.0 2.0 2.1 2.1 2.2 2.0 1.9 2.1 2.0<br />
O&M 0.4 0.4 0.9 0.0 0.3 0.2 0.3 0.6 0.3<br />
EBITDA 0.4 0.3 -0.1 0.7 0.6 0.8 0.5 1.6 1.8<br />
PLF (%) 81 76 67 49 67 73 53 69 74<br />
Units sold (million) 373 351 308 228 318 338 503 686 725<br />
Source: Company, <strong>ICICI</strong>direct.com Research<br />
<strong>ICICI</strong> Securities Ltd | Retail Equity Research Page 2
The road division revenues grew 16% YoY to | 58.6 crore<br />
in Q4FY12 contributed by traffic growth (~7%) and toll<br />
growth (~9%)<br />
Road division<br />
In the road division, revenues grew 16% YoY to | 58.6 crore in Q3FY12<br />
contributed by traffic growth (~7%) and toll growth (~9%). The EBITDA<br />
margin came at 68.8%. The PAT at | 10.5 crore was lower mainly on<br />
account of higher interest expenses (~| 21.5 crore on debt raised by<br />
securitisation of JKEL revenues to partly fund additional stake buy in<br />
MIAL)<br />
The financial closure for Shivpuri-Dewas is expected in the next month.<br />
The | 3,178 crore (including IDC charges) project is for four-laning of the<br />
Shivpuri-Dewas section in Madhya Pradesh. <strong>GVK</strong> will pay a premium of<br />
| 189.9 crore per annum to NHAI on this for 30 years, with a provision of<br />
an increase of 5% every year. Comparing <strong>GVK</strong>‘s bid with L-2 bid, <strong>GVK</strong>’s<br />
bid appears to be aggressive as it has paid ~65% premium higher than L-<br />
2 bidder.<br />
The management also informed that Deoli Kota may see some delay in<br />
execution on account of pending MOEF clearance for the tunnel as a part<br />
of project while Bagodara Vasad is on schedule. To fund its equity<br />
commitment towards road projects, the company is exploring the option<br />
of private equity deal in transportation division.<br />
Exhibit 5: Road division performance<br />
| crore Q4FY12 Q4FY11 Q3FY12 QoQ (Chg %) YoY (Chg %)<br />
Revenue 58.6 50.5 58.8 -0.4 16.0<br />
EBITDA 40.3 26.0 40.7 -1.1 55.3<br />
Margin (%) 68.8% 51.4% 69.3%<br />
PAT 13.1 22.0 10.5 24.6 -40.4<br />
Margin (%) 22.4% 43.6% 17.9%<br />
Source: Company, <strong>ICICI</strong>direct.com Research<br />
Exhibit 6: Toll revenue break-up<br />
| crore Q4FY12 Q4FY11 YoY(%) Q3FY12 Q0Q(%)<br />
Car, Passenger Vehicles 5.4 4.4 22.9 5.7 -5.2<br />
Light Goods Vehicles 2.2 1.7 33.8 2.2 2.6<br />
Bus 2.5 2.3 9.4 2.8 -9.2<br />
Truck 4.9 4.7 4.1 5.1 -4.8<br />
Multi Axel Vehicles 43.5 37.4 16.4 43.0 1.2<br />
Heavy Vehicles 0.0 0.0 -18.6 0.0 -10.7<br />
Total 58.6 50.5 16.1 58.8 -0.4<br />
Source: Company, <strong>ICICI</strong>direct.com Research<br />
Exhibit 7: Traffic break-up<br />
Category Q4FY12 Q4FY11 Q3FY12 QoQ (Chg %) YoY (Chg %)<br />
Car, Passenger Vehicles 824,983 753,730 857,701 -3.8 9.5<br />
Light Goods Vehicles 165,491 138,843 161,836 2.3 19.2<br />
Bus 99,059 100,182 108,427 -8.6 -1.1<br />
Truck 181,427 190,064 190,882 -5.0 -4.5<br />
Multi Axel Vehicles 1,001,846 937,122 989,897 1.2 6.9<br />
Heavy Vehicles 433 584 466 -7.1 -25.9<br />
Total 2,273,239 2,120,525 2,309,209 -1.6 7.2<br />
Source: Company, <strong>ICICI</strong>direct.com Research<br />
<strong>ICICI</strong> Securities Ltd | Retail Equity Research Page 3
In terms of cost escalation, MIAL has seen a cost overrun<br />
of | 2700 crore and cost approval & tariff revision<br />
application has been made to AERA. The decision on this is<br />
expected in the next three or four months<br />
Airport division<br />
MIAL and BIAL reported a muted topline performance with sequential<br />
decline of 3.3% and 2.2% to | 321.6 crore and | 150.5 crore, respectively.<br />
In terms of operating performance, the passenger movement remained<br />
muted in both airports. MIAL’s total passenger declined 2.7% sequentially<br />
to 7.8 million in Q4FY12. While the number of domestic passengers<br />
declined 4.2% QoQ to 5.3 million, the number of international passengers<br />
grew 0.6% QoQ to 2.5 million. BIAL also reported a decline of 7.8%<br />
sequentially in passenger movement to 3.1 million in Q4FY12.<br />
In terms of cost escalation, MIAL has seen a cost overrun of ~| 2700<br />
crore to |12,500 crore and cost approval and tariff revision application<br />
has been made to AERA. The cost overrun in MIAL was on account of a<br />
delay in shifting of the Shivaji statue, increase in scope of work and rise in<br />
cost of construction. There continues to remain uncertainty over the<br />
funding of the project especially after the cost overrun as AAI may find it<br />
difficult to infuse additional equity (as reported in the media article). The<br />
company is also contemplating an application with the regulator for an<br />
increase in AERO charges to meet the funding gap.<br />
<strong>GVK</strong> is also looking for a private equity deal in the airport segment to<br />
raise ~| 3000 crore to repay the debts raised for acquisition of a stake.<br />
Currently, the foreign players are confused with the government stand<br />
and, hence, are delaying their decision.<br />
Exhibit 8: MIAL’s performance<br />
| crore Q4FY12 Q4FY11 Q3FY12 QoQ (Chg %) YoY (Chg %)<br />
Revenue 321.6 330.7 332.5 -3.3 -2.7<br />
EBITDA 103.1 137.1 122.0 -15.4 -24.8<br />
Margin (%) 32.1 41.4 36.7<br />
PAT 32.9 64.3 42.9 -23.3 -48.8<br />
Margin (%) 10.2 19.4 12.9<br />
Source: Company, <strong>ICICI</strong>direct.com Research<br />
Exhibit 9: BIAL’s performance<br />
| crore Q4FY12 Q4FY11 Q3FY12 QoQ (Chg %) YoY (Chg %)<br />
Revenue 150.5 139.1 153.8 -2.2 8.1<br />
EBITDA 96.8 93.0 108.6 -10.8 4.1<br />
Margin (%) 64.4 66.9 70.6<br />
Adj. PAT 33.2 40.4 56.3 -41.0 -17.7<br />
Margin (%) 22.1 29.0 36.6<br />
Source: Company, <strong>ICICI</strong>direct.com Research<br />
Exhibit 10: Operational highlights of airport division<br />
BIAL MIAL<br />
Q4FY12 Q4FY11 Q3FY12 QoQ (Chg %) YoY (Chg %) Q4FY12 Q4FY11 Q3FY12 QoQ (Chg %) YoY (Chg %)<br />
INTERNATIONAL<br />
Aircraft Movements per Day 52 47 52 -1.4 9.2 199 193 204 -2.4 3.1<br />
Passenger Movements (Mn)<br />
DOMESTIC<br />
0.6 0.6 0.6 -3.8 7.1 2.5 2.3 2.5 0.6 8.9<br />
Aircraft Movements per Day 263 266 282 -6.7 -1.1 487 489 493 -1.1 -0.4<br />
Passenger Movements (Mn)<br />
TOTAL (INT+DOM)<br />
2.5 2.4 2.7 -8.7 4.3 5.3 5.2 5.5 -4.2 1.7<br />
Aircraft Movements per Day 315 314 335 -5.8 0.5 686 682 696 -1.5 0.6<br />
Passenger Movements (Mn) 3.1 2.9 3.3 -7.8 4.8 7.8 7.5 8.0 -2.7 3.9<br />
Source: Company, <strong>ICICI</strong>direct.com Research<br />
<strong>ICICI</strong> Securities Ltd | Retail Equity Research Page 4
We recommend BUY on the stock with SOTP based price<br />
target of | 18<br />
Valuation<br />
We have incorporated the FY12 performance and also taken into account<br />
higher interest outgo for loans taken for acquisition of stake in MIAL and<br />
BIAL. Consequently, we have reduced our earning estimates for FY13 by<br />
~35%.<br />
At the CMP, the stock is trading at 0.5x FY13 P/BV. We highlight that<br />
uncertainty over AERA guidelines, gas supply constraints, delay in the<br />
real estate monetisation, lack of clarity over the Hancock deal and ADF<br />
issue still remain and continue to weigh on the valuation.<br />
We expect <strong>GVK</strong> to report a muted performance for some more time given<br />
the unavailability of gas supply at its power plants as well as additional<br />
interest burden to fund an incremental stake in MIAL and BIAL. In our<br />
view, a PE deal in the airport & road division holds the key for stock price<br />
performance, going ahead, as this would partially allay investors concerns<br />
over funding gap across airport & transportation verticals.<br />
We have assigned a BUY rating with reduced target price of | 18 per<br />
share as we now incorporate higher debt for stake acquisition in airports<br />
and Shivpuri Dewas which contributes negatively to our valuation. The<br />
BUY rating is purely on attractive valuations (currently trading at 0.5x<br />
P/BV) and on the hopes of a better financial position with anticipated PE<br />
deals, though higher than anticipated dilution remains a key risk. We also<br />
advise only those investors with a longer horizon of 18-24 months to<br />
consider investing in the stock.<br />
Exhibit 11: SOTP valuation<br />
Basis CoE<br />
Equity Value<br />
Stake Value (|<br />
(| crore) <strong>GVK</strong>'s stake (%) crore) Per share (|)<br />
<strong>Power</strong> 1155 801.6 5<br />
<strong>GVK</strong> Industries FCFE 13.0 173 75.0 129.8 1<br />
Gautami FCFE 13.0 237 47.8 113.1 1<br />
Goindwal Sahib FCFE 14.0 247 75.0 185.2 1<br />
Alaknanda FCFE 14.0 498 75.0 373.6 2<br />
Transport -142 -141.6 -1<br />
JKEL FCFE 13.0 717 100.0 716.7 5<br />
Deoli Kota FCFE 14.0 22 100.0 22.4 0<br />
Shivpuri Dewas FCFE 15.0 -881 100.0 -880.7 -6<br />
Airport 9221 4490.8 28<br />
MIAL-Airport FCFE 14.0 2117 50.5 1068.9 7<br />
MIAL-Real Estate NAV 15.0 4896 50.5 2472.4 16<br />
BIAL-Airport FCFE 15.0 2208 43.0 949.5 6<br />
Total 10234 5150.8 33<br />
Less: Net Debt 2320.8 15<br />
Target 2830.0 18<br />
Source: Company, <strong>ICICI</strong>direct.com Research<br />
<strong>ICICI</strong> Securities Ltd | Retail Equity Research Page 5
Financial summary<br />
Profit and loss statement<br />
(| Crore) FY11 FY12 FY13E FY14E<br />
Net Sales 1,914.7 2,491.8 3,769.0 5,650.2<br />
Growth (%) 7.2 30.1 51.3 49.9<br />
Total Operating Expenditure 1,400.7 1,807.8 2,331.3 3,307.5<br />
EBITDA 514.0 684.0 1,437.8 2,342.8<br />
Growth (%) 9.8 33.1 110.2 62.9<br />
Interest 263.1 457.2 850.0 1,309.7<br />
Depreciation 183.6 248.9 494.0 785.8<br />
Other Income 28.5 88.9 64.3 129.2<br />
PBT 95.7 66.7 158.0 376.5<br />
Total Tax 21.3 67.8 41.4 116.9<br />
PAT before MI 74.4 -1.1 116.6 259.6<br />
Minority Interest 30.4 43.9 111.3 166.5<br />
Profit from Associates 110.9 106.4 70.9 58.8<br />
Less: Prior Period Items 0.0 0.0 0.0 0.0<br />
PAT 154.9 61.5 76.2 151.9<br />
Growth (%) -0.6 -60.3 24.0 99.4<br />
EPS 1.0 0.4 0.5 1.0<br />
Source: Company, <strong>ICICI</strong>direct.com Research<br />
Balance Sheet<br />
(| Crore) FY11 FY12P FY13E FY14E<br />
Liabilities<br />
Equity Capital 157.9 157.9 157.9 157.9<br />
Reserve and Surplus 3,228.9 3,323.5 3,366.5 3,518.4<br />
Total Debt 5,548.4 13,884.5 15,125.9 14,704.9<br />
Deferred Tax Liability 57.0 300.8 300.8 300.8<br />
Minority Interest 1,153.4 3,116.8 3,228.1 3,394.6<br />
Deferred Income 170.3 164.3 164.3 164.3<br />
Sources of Funds 10,315.8 20,947.8 22,343.5 22,240.9<br />
Assets<br />
Total Gross Block 3,846.6 8,745.8 16,979.9 19,828.6<br />
Less Accumulated Depreciatio 954.9 1,727.9 2,221.9 3,007.8<br />
Net Block 2,891.7 7,017.9 14,757.9 16,820.8<br />
Capital WIP 3,745.0 7,747.4 2,734.2 2,157.8<br />
Net Intangible Assets 780.2 780.2 780.2 780.2<br />
Goodwill on Consolidation 0.0 1,161.6 1,161.6 1,161.6<br />
Investments 2,501.7 2,132.0 2,132.0 732.0<br />
Inventory 43.1 75.4 103.8 164.9<br />
Debtors 69.3 456.2 690.0 1,034.4<br />
Loans and Advances 171.6 1,569.3 1,063.8 2,883.5<br />
Other Current Assets 178.7 228.3 374.8 190.2<br />
Cash 332.6 1,726.3 440.7 186.5<br />
Total Current Assets 795.3 4,055.4 2,673.2 4,459.6<br />
Total Current Liabilities 398.1 1,946.7 1,895.6 3,871.0<br />
Net Current Assets 397.2 2,108.7 777.6 588.5<br />
Application of funds 10,315.8 20,947.7 22,343.5 22,240.9<br />
Source: Company, <strong>ICICI</strong>direct.com Research<br />
Cash flow statement<br />
(| Crore) FY11 FY12P FY13E FY14E<br />
Profit after Tax 154.9 61.5 76.2 151.9<br />
Depreciation 183.6 248.9 494.0 785.8<br />
Cash Flow before WC changes 338.6 310.4 570.2 937.8<br />
Net Increase in Current Assets -67.1 -1,866.5 96.7 -2,040.6<br />
Net Increase in Current Liabilities 193.8 1,548.7 -51.1 1,975.4<br />
Net cash flow from op. activities 465.2 -7.5 615.8 872.6<br />
(Purchase)/Sale of Investment -563.5 369.7 0.0 1,400.0<br />
(Purchase)/Sale of Fixed Assets -1,662.1 -8,377.5 -3,220.9 -2,272.3<br />
Net Cash flow from Investing Activities -1,362.2 -6,968.2 -3,109.6 -705.9<br />
Inc / (Dec) in Equity Capital 0.0 0.0 0.0 0.0<br />
Inc / (Dec) in Secured loan 902.9 8,336.2 1,241.4 -421.0<br />
Inc / (Dec) in Unsecured loans 200.0 0.0 0.0 0.0<br />
Net Cash flow from Financing Activities 1,178.8 8,369.3 1,208.2 -421.0<br />
Net Cash flow 281.9 1,393.6 -1,285.5 -254.2<br />
Opening Cash/Cash Equivalent 50.8 332.6 1,726.3 440.7<br />
Closing Cash/ Cash Equivalent<br />
Source: Company, <strong>ICICI</strong>direct.com Research<br />
332.6 1,726.3 440.7 186.5<br />
Key ratios<br />
FY11 FY12P FY13E FY14E<br />
Per share data (|)<br />
EPS 1.0 0.4 0.5 1.0<br />
Cash EPS 2.1 2.0 3.6 5.9<br />
BV 21.4 22.0 22.3 23.3<br />
Operating profit per share 3.3 4.3 9.1 14.8<br />
Operating Ratios (%)<br />
EBITDA Margin 26.8 27.5 38.1 41.5<br />
PBT / Net Sales 5.0 2.7 4.2 6.7<br />
PAT Margin 8.1 2.5 2.0 2.7<br />
Inventory days 7.5 8.7 8.7 8.7<br />
Debtor days 13.2 66.8 66.8 66.8<br />
Creditor days<br />
Return Ratios (%)<br />
19.4 62.8 62.8 62.8<br />
RoE 4.6 1.8 2.2 4.1<br />
RoCE 3.3 2.1 4.3 7.1<br />
RoIC<br />
Valuation Ratios (x)<br />
4.2 3.4 5.5 9.3<br />
P/E 12.1 30.6 24.7 12.4<br />
EV / EBITDA 13.8 20.5 11.5 7.0<br />
EV / Net Sales 3.7 5.6 4.4 2.9<br />
Market Cap / Sales 1.0 0.8 0.5 0.3<br />
Price to Book Value<br />
Solvency Ratios (x)<br />
0.6 0.5 0.5 0.5<br />
Debt / EBITDA 10.8 20.3 10.5 6.3<br />
Debt / Equity 1.6 4.0 4.3 4.0<br />
Current Ratio 2.0 2.1 1.4 1.2<br />
Quick Ratio<br />
Source: Company, <strong>ICICI</strong>direct.com Research<br />
1.2 1.2 1.2 1.1<br />
<strong>ICICI</strong> Securities Ltd | Retail Equity Research Page 6
<strong>ICICI</strong>direct.com coverage universe (Infrastructure)<br />
JP Associates Sales (| Crore) EPS (|) PE (x) P/BV(x) RoNW (%) RoCE (%)<br />
Idirect Code JAIASS CMP 60 FY10 10,088.9 4.2 20.4 2.1 11.7 8.0<br />
Mcap (| crore) 12814 Target 95 FY11 12,966.5 3.5 24.2 1.9 13.0 7.9<br />
% Upside 58% FY12E 13,048.9 3.1 27.9 1.8 6.7 7.2<br />
FY13E 14,999.3 3.1 28.1 1.7 6.2 6.7<br />
GMR Infra<br />
Idirect Code GMRINF CMP 22 FY10 4,566.5 0.4 71.7 1.3 2.3 3.9<br />
Mcap (| crore) 8485 Target 32 FY11 5,773.8 -0.3 NA 1.0 -9.8 3.1<br />
% Upside 47% FY12E 7,796.8 -0.5 NA 1.1 -2.9 2.9<br />
FY13E 9,689.6 0.5 67.5 1.1 1.9 4.2<br />
<strong>GVK</strong> <strong>Power</strong><br />
Idirect Code <strong>GVK</strong>POW CMP 12 FY11 1,914.7 1.0 12.1 0.6 4.6 3.3<br />
Mcap (| crore) 1879 Target 18 FY12 2,491.8 0.4 30.6 0.5 1.8 2.1<br />
% Upside 51% FY13E 3,769.0 0.5 24.7 0.5 2.2 4.3<br />
FY14E 5,650.2 1.0 12.4 0.5 4.1 7.1<br />
IRB Infrastructure<br />
Idirect Code IRBINF CMP 129 FY10 1,704.9 11.6 11.4 2.2 18.9 12.3<br />
Mcap (| crore) 4288 Target UR FY11 2,438.1 13.6 9.7 1.8 18.6 12.2<br />
% Upside FY12E 3,041.1 13.9 9.5 1.5 16.3 10.6<br />
FY13E 3,959.1 13.9 9.5 1.4 14.2 10.0<br />
Sadbhav Engineering<br />
Idirect Code SADENG CMP 133 FY10 1,334.4 2.4 61.9 6.3 10.2 8.9<br />
Mcap (| crore) 1996 Target 166 FY11 2,336.2 6.2 24.2 2.6 10.6 8.6<br />
% Upside 25% FY12E 2,625.2 7.7 19.5 2.1 10.6 6.4<br />
FY13E 3,058.5 8.3 18.1 1.8 9.9 6.3<br />
Source: Company, <strong>ICICI</strong>direct.com Research<br />
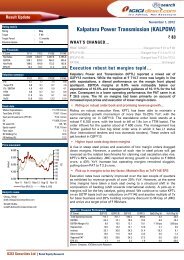
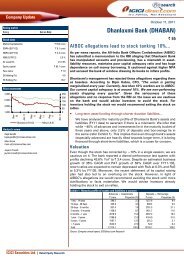
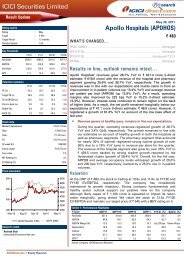
Exhibit 12: Recommendation History<br />
40<br />
30<br />
20<br />
10<br />
0<br />
May-11<br />
<strong>ICICI</strong> Securities Ltd | Retail Equity Research Page 7<br />
Jun-11<br />
Aug-11<br />
Source: Reuters, <strong>ICICI</strong>direct.com Research<br />
Sep-11<br />
Nov-11<br />
Dec-11<br />
Price Target Price<br />
Feb-12<br />
Mar-12<br />
May-12<br />
Exhibit 13: Recent Releases<br />
Date Event CMP Target Price Rating<br />
8-Aug-11 Q1FY12 Result Update 18 32 Buy<br />
21-Sep-11 Event Update 17 31 Buy<br />
11-Nov-11 Q2FY12 Result Update 13 32 Buy<br />
15-Feb-12 Q3FY12 Result Update 19 28 Buy<br />
13-Apr-12 Management Meet Update 17 28 Buy<br />
Source: Company, <strong>ICICI</strong>direct.com Research
RATING RATIONALE<br />
<strong>ICICI</strong>direct.com endeavours to provide objective opinions and recommendations. <strong>ICICI</strong>direct.com assigns<br />
ratings to its stocks according to their notional target price vs. current market price and then categorises them<br />
as Strong Buy, Buy, Hold and Sell. The performance horizon is two years unless specified and the notional<br />
target price is defined as the analysts' valuation for a stock.<br />
Strong Buy: >15%/20% for large caps/midcaps, respectively, with high conviction;<br />
Buy: >10%/15% for large caps/midcaps, respectively;<br />
Hold: Up to +/-10%;<br />
Sell: -10% or more;<br />
Pankaj Pandey Head – Research pankaj.pandey@icicisecurities.com<br />
ANALYST CERTIFICATION<br />
<strong>ICICI</strong>direct.com Research Desk,<br />
<strong>ICICI</strong> Securities Limited,<br />
1 st Floor, Akruti Trade Centre,<br />
Road No. 7, MIDC,<br />
Andheri (East)<br />
Mumbai – 400 093<br />
research@icicidirect.com<br />
We /I, Deepak Purswani CFA, PGDM (FINANCE) Bhupendra Tiwary MBA (FINANCE) research analysts, authors and the names subscribed to this report, hereby certify that all of the views expressed in this<br />
research report accurately reflect our personal views about any and all of the subject issuer(s) or securities. We also certify that no part of our compensation was, is, or will be directly or indirectly related to<br />
the specific recommendation(s) or view(s) in this report. Analysts aren't registered as research analysts by FINRA and might not be an associated person of the <strong>ICICI</strong> Securities Inc.<br />
Disclosures:<br />
<strong>ICICI</strong> Securities Limited (<strong>ICICI</strong> Securities) and its affiliates are a full-service, integrated investment banking, investment management and brokerage and financing group. We along with affiliates are leading<br />
underwriter of securities and participate in virtually all securities trading markets in India. We and our affiliates have investment banking and other business relationship with a significant percentage of<br />
companies covered by our Investment Research Department. Our research professionals provide important input into our investment banking and other business selection processes. <strong>ICICI</strong> Securities<br />
generally prohibits its analysts, persons reporting to analysts and their dependent family members from maintaining a financial interest in the securities or derivatives of any companies that the analysts<br />
cover.<br />
The information and opinions in this report have been prepared by <strong>ICICI</strong> Securities and are subject to change without any notice. The report and information contained herein is strictly confidential and<br />
meant solely for the selected recipient and may not be altered in any way, transmitted to, copied or distributed, in part or in whole, to any other person or to the media or reproduced in any form, without<br />
prior written consent of <strong>ICICI</strong> Securities. While we would endeavour to update the information herein on reasonable basis, <strong>ICICI</strong> Securities, its subsidiaries and associated companies, their directors and<br />
employees (“<strong>ICICI</strong> Securities and affiliates”) are under no obligation to update or keep the information current. Also, there may be regulatory, compliance or other reasons that may prevent <strong>ICICI</strong> Securities<br />
from doing so. Non-rated securities indicate that rating on a particular security has been suspended temporarily and such suspension is in compliance with applicable regulations and/or <strong>ICICI</strong> Securities<br />
policies, in circumstances where <strong>ICICI</strong> Securities is acting in an advisory capacity to this company, or in certain other circumstances.<br />
This report is based on information obtained from public sources and sources believed to be reliable, but no independent verification has been made nor is its accuracy or completeness guaranteed. This<br />
report and information herein is solely for informational purpose and may not be used or considered as an offer document or solicitation of offer to buy or sell or subscribe for securities or other financial<br />
instruments. Though disseminated to all the customers simultaneously, not all customers may receive this report at the same time. <strong>ICICI</strong> Securities will not treat recipients as customers by virtue of their<br />
receiving this report. Nothing in this report constitutes investment, legal, accounting and tax advice or a representation that any investment or strategy is suitable or appropriate to your specific<br />
circumstances. The securities discussed and opinions expressed in this report may not be suitable for all investors, who must make their own investment decisions, based on their own investment<br />
objectives, financial positions and needs of specific recipient. This may not be taken in substitution for the exercise of independent judgment by any recipient. The recipient should independently evaluate<br />
the investment risks. The value and return of investment may vary because of changes in interest rates, foreign exchange rates or any other reason. <strong>ICICI</strong> Securities and affiliates accept no liabilities for any<br />
loss or damage of any kind arising out of the use of this report. Past performance is not necessarily a guide to future performance. Investors are advised to see Risk Disclosure Document to understand the<br />
risks associated before investing in the securities markets. Actual results may differ materially from those set forth in projections. Forward-looking statements are not predictions and may be subject to<br />
change without notice.<br />
<strong>ICICI</strong> Securities and its affiliates might have managed or co-managed a public offering for the subject company in the preceding twelve months. <strong>ICICI</strong> Securities and affiliates might have received<br />
compensation from the companies mentioned in the report during the period preceding twelve months from the date of this report for services in respect of public offerings, corporate finance, investment<br />
banking or other advisory services in a merger or specific transaction. It is confirmed that Deepak Purswani CFA, PGDM (FINANCE) Bhupendra Tiwary MBA (FINANCE) research analysts and the authors of<br />
this report have not received any compensation from the companies mentioned in the report in the preceding twelve months. Our research professionals are paid in part based on the profitability of <strong>ICICI</strong><br />
Securities, which include earnings from Investment Banking and other business.<br />
<strong>ICICI</strong> Securities or its subsidiaries collectively do not own 1% or more of the equity securities of the Company mentioned in the report as of the last day of the month preceding the publication of the<br />
research report.<br />
It is confirmed that Deepak Purswani CFA, PGDM (FINANCE) Bhupendra Tiwary MBA (FINANCE) research analysts and the authors of this report or any of their family members does not serve as an<br />
officer, director or advisory board member of the companies mentioned in the report.<br />
<strong>ICICI</strong> Securities may have issued other reports that are inconsistent with and reach different conclusion from the information presented in this report. <strong>ICICI</strong> Securities and affiliates may act upon or make use<br />
of information contained in the report prior to the publication thereof.<br />
This report is not directed or intended for distribution to, or use by, any person or entity who is a citizen or resident of or located in any locality, state, country or other jurisdiction, where such distribution,<br />
publication, availability or use would be contrary to law, regulation or which would subject <strong>ICICI</strong> Securities and affiliates to any registration or licensing requirement within such jurisdiction. The securities<br />
described herein may or may not be eligible for sale in all jurisdictions or to certain category of investors. Persons in whose possession this document may come are required to inform themselves of and<br />
to observe such restriction.<br />
<strong>ICICI</strong> Securities Ltd | Retail Equity Research Page 8