GVK Power (GVKPOW) - ICICI Direct
GVK Power (GVKPOW) - ICICI Direct
GVK Power (GVKPOW) - ICICI Direct

You also want an ePaper? Increase the reach of your titles
YUMPU automatically turns print PDFs into web optimized ePapers that Google loves.
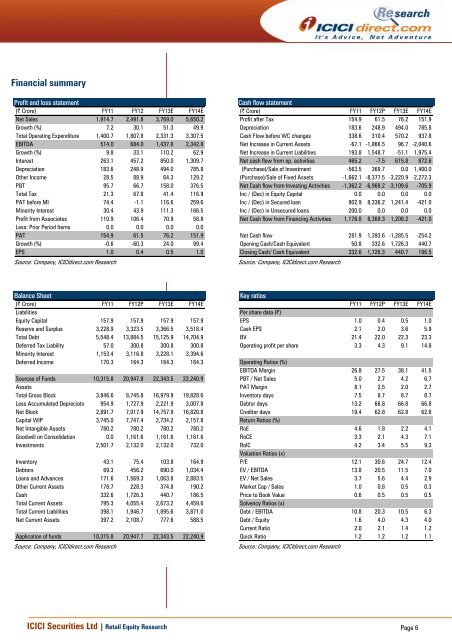
Financial summary<br />
Profit and loss statement<br />
(| Crore) FY11 FY12 FY13E FY14E<br />
Net Sales 1,914.7 2,491.8 3,769.0 5,650.2<br />
Growth (%) 7.2 30.1 51.3 49.9<br />
Total Operating Expenditure 1,400.7 1,807.8 2,331.3 3,307.5<br />
EBITDA 514.0 684.0 1,437.8 2,342.8<br />
Growth (%) 9.8 33.1 110.2 62.9<br />
Interest 263.1 457.2 850.0 1,309.7<br />
Depreciation 183.6 248.9 494.0 785.8<br />
Other Income 28.5 88.9 64.3 129.2<br />
PBT 95.7 66.7 158.0 376.5<br />
Total Tax 21.3 67.8 41.4 116.9<br />
PAT before MI 74.4 -1.1 116.6 259.6<br />
Minority Interest 30.4 43.9 111.3 166.5<br />
Profit from Associates 110.9 106.4 70.9 58.8<br />
Less: Prior Period Items 0.0 0.0 0.0 0.0<br />
PAT 154.9 61.5 76.2 151.9<br />
Growth (%) -0.6 -60.3 24.0 99.4<br />
EPS 1.0 0.4 0.5 1.0<br />
Source: Company, <strong>ICICI</strong>direct.com Research<br />
Balance Sheet<br />
(| Crore) FY11 FY12P FY13E FY14E<br />
Liabilities<br />
Equity Capital 157.9 157.9 157.9 157.9<br />
Reserve and Surplus 3,228.9 3,323.5 3,366.5 3,518.4<br />
Total Debt 5,548.4 13,884.5 15,125.9 14,704.9<br />
Deferred Tax Liability 57.0 300.8 300.8 300.8<br />
Minority Interest 1,153.4 3,116.8 3,228.1 3,394.6<br />
Deferred Income 170.3 164.3 164.3 164.3<br />
Sources of Funds 10,315.8 20,947.8 22,343.5 22,240.9<br />
Assets<br />
Total Gross Block 3,846.6 8,745.8 16,979.9 19,828.6<br />
Less Accumulated Depreciatio 954.9 1,727.9 2,221.9 3,007.8<br />
Net Block 2,891.7 7,017.9 14,757.9 16,820.8<br />
Capital WIP 3,745.0 7,747.4 2,734.2 2,157.8<br />
Net Intangible Assets 780.2 780.2 780.2 780.2<br />
Goodwill on Consolidation 0.0 1,161.6 1,161.6 1,161.6<br />
Investments 2,501.7 2,132.0 2,132.0 732.0<br />
Inventory 43.1 75.4 103.8 164.9<br />
Debtors 69.3 456.2 690.0 1,034.4<br />
Loans and Advances 171.6 1,569.3 1,063.8 2,883.5<br />
Other Current Assets 178.7 228.3 374.8 190.2<br />
Cash 332.6 1,726.3 440.7 186.5<br />
Total Current Assets 795.3 4,055.4 2,673.2 4,459.6<br />
Total Current Liabilities 398.1 1,946.7 1,895.6 3,871.0<br />
Net Current Assets 397.2 2,108.7 777.6 588.5<br />
Application of funds 10,315.8 20,947.7 22,343.5 22,240.9<br />
Source: Company, <strong>ICICI</strong>direct.com Research<br />
Cash flow statement<br />
(| Crore) FY11 FY12P FY13E FY14E<br />
Profit after Tax 154.9 61.5 76.2 151.9<br />
Depreciation 183.6 248.9 494.0 785.8<br />
Cash Flow before WC changes 338.6 310.4 570.2 937.8<br />
Net Increase in Current Assets -67.1 -1,866.5 96.7 -2,040.6<br />
Net Increase in Current Liabilities 193.8 1,548.7 -51.1 1,975.4<br />
Net cash flow from op. activities 465.2 -7.5 615.8 872.6<br />
(Purchase)/Sale of Investment -563.5 369.7 0.0 1,400.0<br />
(Purchase)/Sale of Fixed Assets -1,662.1 -8,377.5 -3,220.9 -2,272.3<br />
Net Cash flow from Investing Activities -1,362.2 -6,968.2 -3,109.6 -705.9<br />
Inc / (Dec) in Equity Capital 0.0 0.0 0.0 0.0<br />
Inc / (Dec) in Secured loan 902.9 8,336.2 1,241.4 -421.0<br />
Inc / (Dec) in Unsecured loans 200.0 0.0 0.0 0.0<br />
Net Cash flow from Financing Activities 1,178.8 8,369.3 1,208.2 -421.0<br />
Net Cash flow 281.9 1,393.6 -1,285.5 -254.2<br />
Opening Cash/Cash Equivalent 50.8 332.6 1,726.3 440.7<br />
Closing Cash/ Cash Equivalent<br />
Source: Company, <strong>ICICI</strong>direct.com Research<br />
332.6 1,726.3 440.7 186.5<br />
Key ratios<br />
FY11 FY12P FY13E FY14E<br />
Per share data (|)<br />
EPS 1.0 0.4 0.5 1.0<br />
Cash EPS 2.1 2.0 3.6 5.9<br />
BV 21.4 22.0 22.3 23.3<br />
Operating profit per share 3.3 4.3 9.1 14.8<br />
Operating Ratios (%)<br />
EBITDA Margin 26.8 27.5 38.1 41.5<br />
PBT / Net Sales 5.0 2.7 4.2 6.7<br />
PAT Margin 8.1 2.5 2.0 2.7<br />
Inventory days 7.5 8.7 8.7 8.7<br />
Debtor days 13.2 66.8 66.8 66.8<br />
Creditor days<br />
Return Ratios (%)<br />
19.4 62.8 62.8 62.8<br />
RoE 4.6 1.8 2.2 4.1<br />
RoCE 3.3 2.1 4.3 7.1<br />
RoIC<br />
Valuation Ratios (x)<br />
4.2 3.4 5.5 9.3<br />
P/E 12.1 30.6 24.7 12.4<br />
EV / EBITDA 13.8 20.5 11.5 7.0<br />
EV / Net Sales 3.7 5.6 4.4 2.9<br />
Market Cap / Sales 1.0 0.8 0.5 0.3<br />
Price to Book Value<br />
Solvency Ratios (x)<br />
0.6 0.5 0.5 0.5<br />
Debt / EBITDA 10.8 20.3 10.5 6.3<br />
Debt / Equity 1.6 4.0 4.3 4.0<br />
Current Ratio 2.0 2.1 1.4 1.2<br />
Quick Ratio<br />
Source: Company, <strong>ICICI</strong>direct.com Research<br />
1.2 1.2 1.2 1.1<br />
<strong>ICICI</strong> Securities Ltd | Retail Equity Research Page 6