Download pdf - International Potato Center
Download pdf - International Potato Center
Download pdf - International Potato Center

You also want an ePaper? Increase the reach of your titles
YUMPU automatically turns print PDFs into web optimized ePapers that Google loves.
CIP • SOCIAL SCIENCES WORKING PAPER 2010-1<br />
4.8.2 Projections<br />
The ten ASARECA member countries produce potatoes accounting for 71% of the total<br />
production in Sub-Saharan Africa (SSA). Evidence indicates that in 2004, the total production of<br />
potatoes in the ASARECA region was estimated to be over 14 Million Tons (Berga, 2004).<br />
According to sub-sector analysis study for potato and sweetpotatoe, 80% of the total potato<br />
produced is ware, 10% goes for seed and 10% is waste (ASARECA, 2005). Out of the total for ware,<br />
85% of it is consumed in its boiled and other forms while 15% of the ware goes for processing.<br />
Out of the potatoes allocated for processing, 90% of it goes for chips processing and the<br />
remaining goes for crisps and others. After processing, the recovery percentage of chips is 60%<br />
while the remaining is peels during processing. The diagram indicating the potential production<br />
of chips in the ASARECA region is indicated in Figure 6.<br />
According to the potato sub-sector analysis (PRAPACE and ECAPAPA, 2004) in the ASARECA<br />
region 10.8% of the total potato produced is allocated for chips processing. After processing, net<br />
chips production will be only 6.5% of the total potato produced. With this conservative estimate,<br />
ASARECA region had the potential of producing 907,200 tons of chips per annum by 2004<br />
(Figure 6).<br />
For countries that are covered in this study, the potential production of chips was also estimated,<br />
based on an average of 12 years of potato production. Its forecast was also made for 2015,<br />
assuming a 10% growth of potato production per annum. Accordingly, the countries considered<br />
in this study have the potential of producing 234,201 tons of chips per annum by 2008 (Table 23).<br />
By 2015, the same countries have a potential of processing 296,371 tons of chips per annum.<br />
These facts suggest that appropriate and favorable intervention options need to be set in place<br />
to exhaust the potential of chips trade in the ECA region.<br />
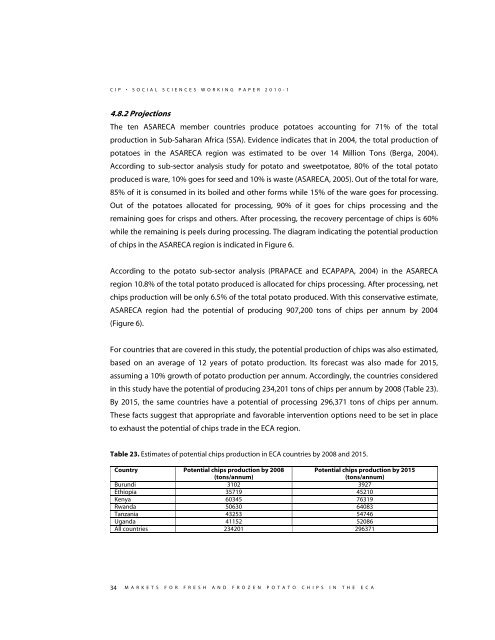
Table 23. Estimates of potential chips production in ECA countries by 2008 and 2015.<br />
Country Potential chips production by 2008<br />
(tons/annum)<br />
Potential chips production by 2015<br />
(tons/annum)<br />
Burundi 3102 3927<br />
Ethiopia 35719 45210<br />
Kenya 60345 76319<br />
Rwanda 50630 64083<br />
Tanzania 43253 54746<br />
Uganda 41152 52086<br />
All countries 234201 296371<br />
34 M A R K E T S F O R F R E S H A N D F R O Z E N P O T A T O C H I P S I N T H E E C A