Current Trauma Status Report - Southern Nevada Health District
Current Trauma Status Report - Southern Nevada Health District
Current Trauma Status Report - Southern Nevada Health District

You also want an ePaper? Increase the reach of your titles
YUMPU automatically turns print PDFs into web optimized ePapers that Google loves.
According to the National Center for <strong>Health</strong> Statistics, in 2001 unintentional injury was the leading<br />
cause of death for persons aged 1 – 34 and was the second leading cause of death for those aged 35 –<br />
44 in the United States.<br />
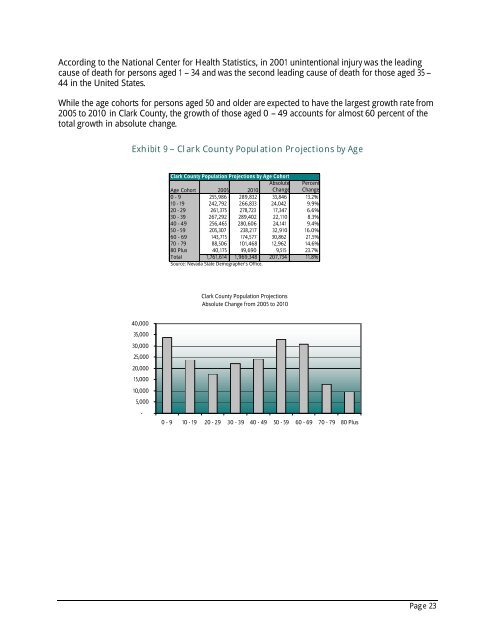
While the age cohorts for persons aged 50 and older are expected to have the largest growth rate from<br />
2005 to 2010 in Clark County, the growth of those aged 0 – 49 accounts for almost 60 percent of the<br />
total growth in absolute change.<br />
Exhibit 9 – Clark County Population Projections by Age<br />
Clark County Population Projections by Age Cohort<br />
Age Cohort 2005 2010<br />
Absolute<br />
Change<br />
Percent<br />
Change<br />
0 - 9 255,986 289,832 33,846 13.2%<br />
10 - 19 242,792 266,833 24,042 9.9%<br />
20 - 29 261,375 278,723 17,347 6.6%<br />
30 - 39 267,292 289,402 22,110 8.3%<br />
40 - 49 256,465 280,606 24,141 9.4%<br />
50 - 59 205,307 238,217 32,910 16.0%<br />
60 - 69 143,715 174,577 30,862 21.5%<br />
70 - 79 88,506 101,468 12,962 14.6%<br />
80 Plus 40,175 49,690 9,515 23.7%<br />
Total 1,761,614 1,969,348 207,734 11.8%<br />
Source: <strong>Nevada</strong> State Demographer's Office.<br />
Clark County Population Projections<br />
Absolute Change from 2005 to 2010<br />
40,000<br />
35,000<br />
30,000<br />
25,000<br />
20,000<br />
15,000<br />
10,000<br />
5,000<br />
-<br />
0 - 9 10 - 19 20 - 29 30 - 39 40 - 49 50 - 59 60 - 69 70 - 79 80 Plus<br />
Page 23