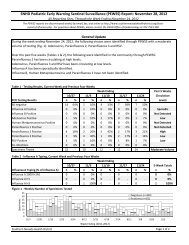
The trauma utilization rate was 237.5 trauma cases per 100,000 population excluding the visitor population in 2003. When the visitor population is factored into the resident population in the Las Vegas region, the utilization rate drops to 197.7 for the same time period. Exhibit 18 – <strong>Trauma</strong> Utilization Rate for <strong>Southern</strong> <strong>Nevada</strong> <strong>Trauma</strong> Registry Patients by Various Statistic Clark County Population <strong>Trauma</strong> Rate per 100,000 Population Nights Stayed in Las Vegas Average Annualized Visitor Population Clark County Population + Visitors Rate per 100,000 Population + Visitors Calendar <strong>Trauma</strong> Monthly Percent Visitors to Las Year Activations Average Change Vegas 1998 3,461 288 - 1,246,193 277.7 30,605,128 3.3 276,704 1,522,897 227.3 1999 3,519 293 1.7% 1,321,319 266.3 33,809,134 3.7 342,723 1,664,042 211.5 2000 3,114 260 -11.5% 1,428,690 218.0 35,849,691 3.7 363,408 1,792,098 173.8 2001 3,573 298 14.7% 1,498,279 238.5 35,017,317 3.6 345,376 1,843,655 193.8 2002 3,713 309 3.9% 1,578,332 235.2 35,071,504 3.4 326,693 1,905,025 194.9 2003 3,899 325 5.0% 1,641,529 237.5 35,540,126 3.4 331,059 1,972,588 197.7 Source: UMC <strong>Trauma</strong> Registry, <strong>Southern</strong> <strong>Nevada</strong> Consensus Population Estimate, Las Vegas Convention & Visitor's Bureau, & The Abaris Group. 300.0 250.0 200.0 150.0 100.0 50.0 <strong>Trauma</strong> Utilization Rate per Year for Clark County and Clark County + Visitors <strong>Trauma</strong> UR Pop Only <strong>Trauma</strong> UR Pop + Visitors 0.0 1998 1999 2000 2001 2002 2003 Almost 80 percent of all trauma registry patients in 2003 were treated for blunt trauma. Exhibit 19 – <strong>Trauma</strong> Patients by Type of Injury <strong>Trauma</strong> Registry Patients by Type of Injury, 2003 Type of Injury Frequency Total Blunt 3,097 79.4% Penetrating 801 20.5% Burn 1 0.0% Total 3,899 100.0% Source: UMC <strong>Trauma</strong> Registry The average age of the trauma patient treated at UMC was 33. Page 37
Exhibit 20 – <strong>Trauma</strong> Patients by Age <strong>Trauma</strong> Registry Patients by Age, 2003 Percent of Years Frequency Total 0-4 84 2.2% 5-9 77 2.0% 10-14 174 4.5% 15-19 470 12.1% 20-24 616 15.8% 25-34 840 21.5% 35-44 682 17.5% 45-54 471 12.1% 55-64 259 6.6% 65-74 138 3.5% 75+ 88 2.3% Total 3,899 100.0% Average 33 - Median 30 - Std. Deviation 17 - Minimum 0 - Maximum 94 - Source: UMC <strong>Trauma</strong> Registry <strong>Trauma</strong> by Age, 2003 900 800 700 600 500 400 300 200 100 - 0-4 5-9 10-14 15-19 20-24 25-34 35-44 45-54 55-64 65-74 75+ Page 38