quarterly statement - TIAA-CREF
quarterly statement - TIAA-CREF
quarterly statement - TIAA-CREF
- No tags were found...

You also want an ePaper? Increase the reach of your titles
YUMPU automatically turns print PDFs into web optimized ePapers that Google loves.
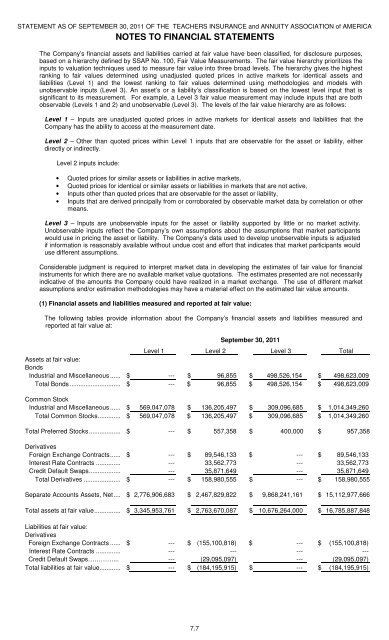
STATEMENT AS OF SEPTEMBER 30, 2011 OF THE TEACHERS INSURANCE and ANNUITY ASSOCIATION of AMERICA<br />
NOTES TO FINANCIAL STATEMENTS<br />
The Company’s financial assets and liabilities carried at fair value have been classified, for disclosure purposes,<br />
based on a hierarchy defined by SSAP No. 100, Fair Value Measurements. The fair value hierarchy prioritizes the<br />
inputs to valuation techniques used to measure fair value into three broad levels. The hierarchy gives the highest<br />
ranking to fair values determined using unadjusted quoted prices in active markets for identical assets and<br />
liabilities (Level 1) and the lowest ranking to fair values determined using methodologies and models with<br />
unobservable inputs (Level 3). An asset’s or a liability’s classification is based on the lowest level input that is<br />
significant to its measurement. For example, a Level 3 fair value measurement may include inputs that are both<br />
observable (Levels 1 and 2) and unobservable (Level 3). The levels of the fair value hierarchy are as follows:<br />
Level 1 – Inputs are unadjusted quoted prices in active markets for identical assets and liabilities that the<br />
Company has the ability to access at the measurement date.<br />
Level 2 – Other than quoted prices within Level 1 inputs that are observable for the asset or liability, either<br />
directly or indirectly.<br />
Level 2 inputs include:<br />
• Quoted prices for similar assets or liabilities in active markets,<br />
• Quoted prices for identical or similar assets or liabilities in markets that are not active,<br />
• Inputs other than quoted prices that are observable for the asset or liability,<br />
• Inputs that are derived principally from or corroborated by observable market data by correlation or other<br />
means.<br />
Level 3 – Inputs are unobservable inputs for the asset or liability supported by little or no market activity.<br />
Unobservable inputs reflect the Company’s own assumptions about the assumptions that market participants<br />
would use in pricing the asset or liability. The Company’s data used to develop unobservable inputs is adjusted<br />
if information is reasonably available without undue cost and effort that indicates that market participants would<br />
use different assumptions.<br />
Considerable judgment is required to interpret market data in developing the estimates of fair value for financial<br />
instruments for which there are no available market value quotations. The estimates presented are not necessarily<br />
indicative of the amounts the Company could have realized in a market exchange. The use of different market<br />
assumptions and/or estimation methodologies may have a material effect on the estimated fair value amounts.<br />
(1) Financial assets and liabilities measured and reported at fair value:<br />
The following tables provide information about the Company’s financial assets and liabilities measured and<br />
reported at fair value at:<br />
September 30, 2011<br />
Level 1 Level 2 Level 3 Total<br />
Assets at fair value:<br />
Bonds<br />
Industrial and Miscellaneous...... $ --- $ 96,855 $ 498,526,154 $ 498,623,009<br />
Total Bonds............................. $ --- $ 96,855 $ 498,526,154 $ 498,623,009<br />
Common Stock<br />
Industrial and Miscellaneous...... $ 569,047,078 $ 136,205,497 $ 309,096,685 $ 1,014,349,260<br />
Total Common Stocks............. $ 569,047,078 $ 136,205,497 $ 309,096,685 $ 1,014,349,260<br />
Total Preferred Stocks.................. $ --- $ 557,358 $ 400,000 $ 957,358<br />
Derivatives<br />
Foreign Exchange Contracts...... $ --- $ 89,546,133 $ --- $ 89,546,133<br />
Interest Rate Contracts .............. --- 33,562,773 --- 33,562,773<br />
Credit Default Swaps.................. --- 35,871,649 --- 35,871,649<br />
Total Derivatives ..................... $ --- $ 158,980,555 $ --- $ 158,980,555<br />
Separate Accounts Assets, Net.... $ 2,776,906,683 $ 2,467,829,822 $ 9,868,241,161 $ 15,112,977,666<br />
Total assets at fair value............... $ 3,345,953,761 $ 2,763,670,087 $ 10,676,264,000 $ 16,785,887,848<br />
Liabilities at fair value:<br />
Derivatives<br />
Foreign Exchange Contracts ...... $ --- $ (155,100,818) $ --- $ (155,100,818)<br />
Interest Rate Contracts .............. --- --- --- ---<br />
Credit Default Swaps…………... --- (29,095,097) --- (29,095,097)<br />
Total liabilities at fair value............ $ --- $ (184,195,915) $ --- $ (184,195,915)<br />
7.7