BEN SCHOEMAN DOCK BERTH DEEPENING Specialist ... - Transnet
BEN SCHOEMAN DOCK BERTH DEEPENING Specialist ... - Transnet
BEN SCHOEMAN DOCK BERTH DEEPENING Specialist ... - Transnet

You also want an ePaper? Increase the reach of your titles
YUMPU automatically turns print PDFs into web optimized ePapers that Google loves.
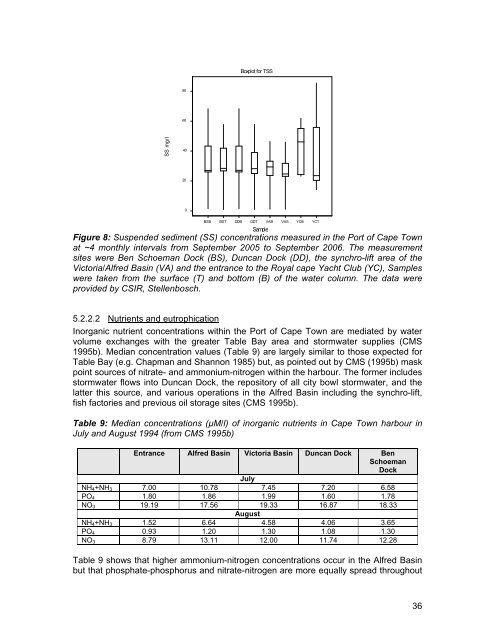
SS mg/l<br />
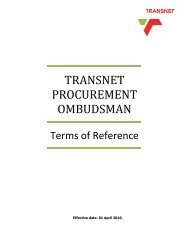
Boxplot for TSS<br />
80<br />
60<br />
40<br />
20<br />
0<br />
BSB<br />
BST<br />
DDB<br />
Figure 8: Suspended sediment (SS) concentrations measured in the Port of Cape Town<br />
at ~4 monthly intervals from September 2005 to September 2006. The measurement<br />
sites were Ben Schoeman Dock (BS), Duncan Dock (DD), the synchro-lift area of the<br />
Victoria/Alfred Basin (VA) and the entrance to the Royal cape Yacht Club (YC), Samples<br />
were taken from the surface (T) and bottom (B) of the water column. The data were<br />
provided by CSIR, Stellenbosch.<br />
DDT<br />
Sample<br />
VAB<br />
VAS<br />
YCB<br />
YCT<br />
5.2.2.2 Nutrients and eutrophication<br />
Inorganic nutrient concentrations within the Port of Cape Town are mediated by water<br />
volume exchanges with the greater Table Bay area and stormwater supplies (CMS<br />
1995b). Median concentration values (Table 9) are largely similar to those expected for<br />
Table Bay (e.g. Chapman and Shannon 1985) but, as pointed out by CMS (1995b) mask<br />
point sources of nitrate- and ammonium-nitrogen within the harbour. The former includes<br />
stormwater flows into Duncan Dock, the repository of all city bowl stormwater, and the<br />
latter this source, and various operations in the Alfred Basin including the synchro-lift,<br />
fish factories and previous oil storage sites (CMS 1995b).<br />
Table 9: Median concentrations (µM/l) of inorganic nutrients in Cape Town harbour in<br />
July and August 1994 (from CMS 1995b)<br />
Entrance Alfred Basin Victoria Basin Duncan Dock Ben<br />
Schoeman<br />
Dock<br />
July<br />
NH 4 +NH 3 7.00 10.78 7.45 7.20 6.58<br />
PO 4 1.80 1.86 1.99 1.60 1.78<br />
NO 3 19.19 17.56 19.33 16.87 18.33<br />
August<br />
NH 4 +NH 3 1.52 6.64 4.58 4.06 3.65<br />
PO 4 0.93 1.20 1.30 1.08 1.30<br />
NO 3 8.79 13.11 12.00 11.74 12.28<br />
Table 9 shows that higher ammonium-nitrogen concentrations occur in the Alfred Basin<br />
but that phosphate-phosphorus and nitrate-nitrogen are more equally spread throughout<br />
36