Volume 4 Issue 3 (October 2012) - Ozean Publications
Volume 4 Issue 3 (October 2012) - Ozean Publications
Volume 4 Issue 3 (October 2012) - Ozean Publications
Create successful ePaper yourself
Turn your PDF publications into a flip-book with our unique Google optimized e-Paper software.
European Journal of Educational Studies 4(3), <strong>2012</strong><br />
“excellent” to “fair” in numeric format, 4 represents “excellent”, 3 implies “very good”, 2 means “good” and 1<br />
connotes “fair”. In the numeric scale, the items were judged on a single dimension and arranged on a scale with<br />
equal intervals. Scores for each of the items ranged from one to four in ascending order of rating.<br />
Validity of the Instrument<br />
Content validity of the instrument was carried using Content Validity Ratio (CVR) computation formula given by<br />
CVR = n e -n/2/n/2, where n is the total number of experts, n e is number of experts regarding the item as essential,<br />
which yielded a content validity ratio of 0.78. This resulted from the analysis of the opinions of twenty experts on<br />
item by item basis visa-vis the relevant hypotheses.<br />
Reliability of the Instrument<br />
The rating scale was trial tested on thirty employees of a similar company in another part of Lagos twice<br />
(administer-re-administer) at one week interval. A reliability coefficient of 0.63 was established using the Pearson<br />
product moment correlation statistic<br />
Data Collection Procedure<br />
The data were obtained by administering the instrument on 100 participants in the study through the human resource<br />
department of the company. A total of eighty copies of the instrument were properly responded to and returned<br />
while the remaining twenty copies were improperly filled and thus discarded. The exercise lasted for two days.<br />
Data Analysis Procedure<br />
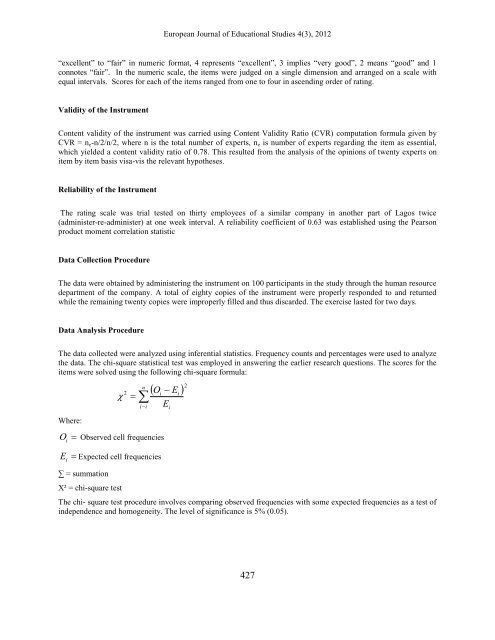
The data collected were analyzed using inferential statistics. Frequency counts and percentages were used to analyze<br />
the data. The chi-square statistical test was employed in answering the earlier research questions. The scores for the<br />
items were solved using the following chi-square formula:<br />
Where:<br />
2<br />
<br />
n<br />
<br />
ii<br />
O Observed cell frequencies<br />
i<br />
O<br />
E 2<br />
i<br />
E<br />
i<br />
i<br />
Ei<br />
<br />
Expected cell frequencies<br />
∑ = summation<br />
X² = chi-square test<br />
The chi- square test procedure involves comparing observed frequencies with some expected frequencies as a test of<br />
independence and homogeneity. The level of significance is 5% (0.05).<br />
427


