Volume 4 Issue 3 (October 2012) - Ozean Publications
Volume 4 Issue 3 (October 2012) - Ozean Publications
Volume 4 Issue 3 (October 2012) - Ozean Publications

Create successful ePaper yourself
Turn your PDF publications into a flip-book with our unique Google optimized e-Paper software.
European Journal of Educational Studies 4(3), <strong>2012</strong><br />
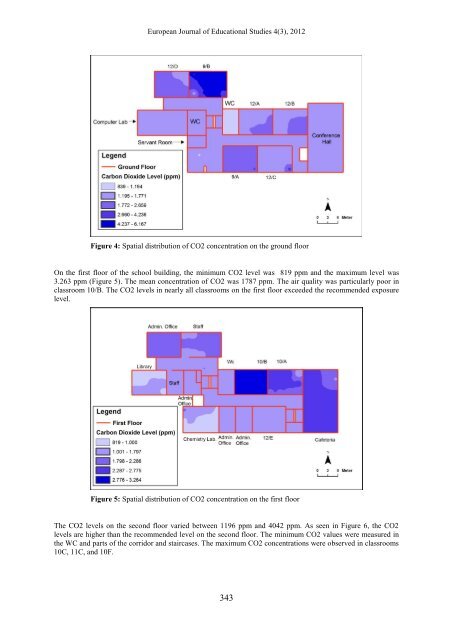
Figure 4: Spatial distribution of CO2 concentration on the ground floor<br />
On the first floor of the school building, the minimum CO2 level was 819 ppm and the maximum level was<br />
3.263 ppm (Figure 5). The mean concentration of CO2 was 1787 ppm. The air quality was particularly poor in<br />
classroom 10/B. The CO2 levels in nearly all classrooms on the first floor exceeded the recommended exposure<br />
level.<br />
Figure 5: Spatial distribution of CO2 concentration on the first floor<br />
The CO2 levels on the second floor varied between 1196 ppm and 4042 ppm. As seen in Figure 6, the CO2<br />
levels are higher than the recommended level on the second floor. The minimum CO2 values were measured in<br />
the WC and parts of the corridor and staircases. The maximum CO2 concentrations were observed in classrooms<br />
10C, 11C, and 10F.<br />
343