Volume 4 Issue 3 (October 2012) - Ozean Publications
Volume 4 Issue 3 (October 2012) - Ozean Publications
Volume 4 Issue 3 (October 2012) - Ozean Publications

Create successful ePaper yourself
Turn your PDF publications into a flip-book with our unique Google optimized e-Paper software.
European Journal of Educational Studies 4(3), <strong>2012</strong><br />
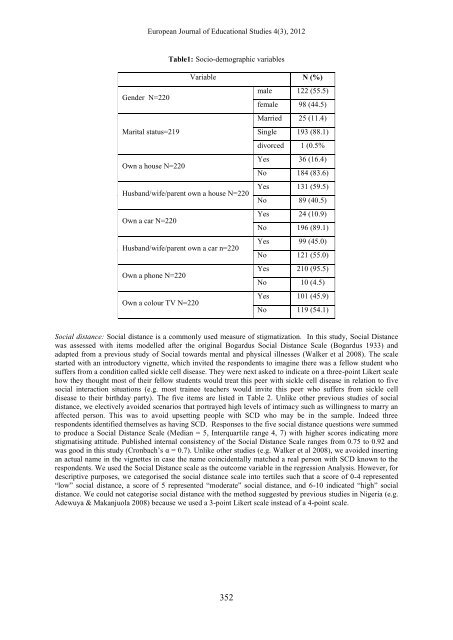
Table1: Socio-demographic variables<br />
Variable N (%)<br />
Gender N=220<br />
male 122 (55.5)<br />
female 98 (44.5)<br />
Married 25 (11.4)<br />
Marital status=219<br />
Single 193 (88.1)<br />
divorced 1 (0.5%<br />
Own a house N=220<br />
Yes 36 (16.4)<br />
No 184 (83.6)<br />
Husband/wife/parent own a house N=220<br />
Yes 131 (59.5)<br />
No 89 (40.5)<br />
Own a car N=220<br />
Yes 24 (10.9)<br />
No 196 (89.1)<br />
Husband/wife/parent own a car n=220<br />
Yes 99 (45.0)<br />
No 121 (55.0)<br />
Own a phone N=220<br />
Yes 210 (95.5)<br />
No 10 (4.5)<br />
Own a colour TV N=220<br />
Yes 101 (45.9)<br />
No 119 (54.1)<br />
Social distance: Social distance is a commonly used measure of stigmatization. In this study, Social Distance<br />
was assessed with items modelled after the original Bogardus Social Distance Scale (Bogardus 1933) and<br />
adapted from a previous study of Social towards mental and physical illnesses (Walker et al 2008). The scale<br />
started with an introductory vignette, which invited the respondents to imagine there was a fellow student who<br />
suffers from a condition called sickle cell disease. They were next asked to indicate on a three-point Likert scale<br />
how they thought most of their fellow students would treat this peer with sickle cell disease in relation to five<br />
social interaction situations (e.g. most trainee teachers would invite this peer who suffers from sickle cell<br />
disease to their birthday party). The five items are listed in Table 2. Unlike other previous studies of social<br />
distance, we electively avoided scenarios that portrayed high levels of intimacy such as willingness to marry an<br />
affected person. This was to avoid upsetting people with SCD who may be in the sample. Indeed three<br />
respondents identified themselves as having SCD. Responses to the five social distance questions were summed<br />
to produce a Social Distance Scale (Median = 5, Interquartile range 4, 7) with higher scores indicating more<br />
stigmatising attitude. Published internal consistency of the Social Distance Scale ranges from 0.75 to 0.92 and<br />
was good in this study (Cronbach’s α = 0.7). Unlike other studies (e.g. Walker et al 2008), we avoided inserting<br />
an actual name in the vignettes in case the name coincidentally matched a real person with SCD known to the<br />
respondents. We used the Social Distance scale as the outcome variable in the regression Analysis. However, for<br />
descriptive purposes, we categorised the social distance scale into tertiles such that a score of 0-4 represented<br />
“low” social distance, a score of 5 represented “moderate” social distance, and 6-10 indicated “high” social<br />
distance. We could not categorise social distance with the method suggested by previous studies in Nigeria (e.g.<br />
Adewuya & Makanjuola 2008) because we used a 3-point Likert scale instead of a 4-point scale.<br />
352