Arctic plant ecology: From tundra to polar desert in Svalbard - Unis
Arctic plant ecology: From tundra to polar desert in Svalbard - Unis
Arctic plant ecology: From tundra to polar desert in Svalbard - Unis

Create successful ePaper yourself
Turn your PDF publications into a flip-book with our unique Google optimized e-Paper software.
details see Crawley 2002). The PCA, RDA and ANOVA analysis were performed<br />
us<strong>in</strong>g site means <strong>in</strong> order <strong>to</strong> <strong>in</strong>clude the <strong>to</strong>tal species list.<br />
Results<br />
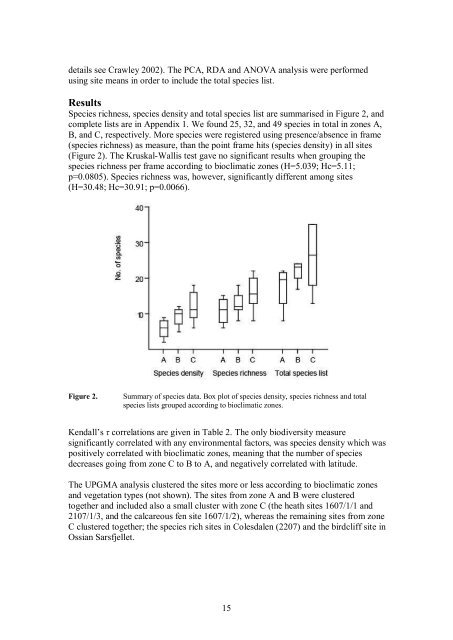
Species richness, species density and <strong>to</strong>tal species list are summarised <strong>in</strong> Figure 2, and<br />
complete lists are <strong>in</strong> Appendix 1. We found 25, 32, and 49 species <strong>in</strong> <strong>to</strong>tal <strong>in</strong> zones A,<br />
B, and C, respectively. More species were registered us<strong>in</strong>g presence/absence <strong>in</strong> frame<br />
(species richness) as measure, than the po<strong>in</strong>t frame hits (species density) <strong>in</strong> all sites<br />
(Figure 2). The KruskalWallis test gave no significant results when group<strong>in</strong>g the<br />
species richness per frame accord<strong>in</strong>g <strong>to</strong> bioclimatic zones (H=5.039; Hc=5.11;<br />
p=0.0805). Species richness was, however, significantly different among sites<br />
(H=30.48; Hc=30.91; p=0.0066).<br />
Figure 2. Summary of species data. Box plot of species density, species richness and <strong>to</strong>tal<br />
species lists grouped accord<strong>in</strong>g <strong>to</strong> bioclimatic zones.<br />
Kendall’s τ correlations are given <strong>in</strong> Table 2. The only biodiversity measure<br />
significantly correlated with any environmental fac<strong>to</strong>rs, was species density which was<br />
positively correlated with bioclimatic zones, mean<strong>in</strong>g that the number of species<br />
decreases go<strong>in</strong>g from zone C <strong>to</strong> B <strong>to</strong> A, and negatively correlated with latitude.<br />
The UPGMA analysis clustered the sites more or less accord<strong>in</strong>g <strong>to</strong> bioclimatic zones<br />
and vegetation types (not shown). The sites from zone A and B were clustered<br />
<strong>to</strong>gether and <strong>in</strong>cluded also a small cluster with zone C (the heath sites 1607/1/1 and<br />
2107/1/3, and the calcareous fen site 1607/1/2), whereas the rema<strong>in</strong><strong>in</strong>g sites from zone<br />
C clustered <strong>to</strong>gether; the species rich sites <strong>in</strong> Colesdalen (2207) and the birdcliff site <strong>in</strong><br />
Ossian Sarsfjellet.<br />
15