Arctic plant ecology: From tundra to polar desert in Svalbard - Unis
Arctic plant ecology: From tundra to polar desert in Svalbard - Unis
Arctic plant ecology: From tundra to polar desert in Svalbard - Unis

Create successful ePaper yourself
Turn your PDF publications into a flip-book with our unique Google optimized e-Paper software.
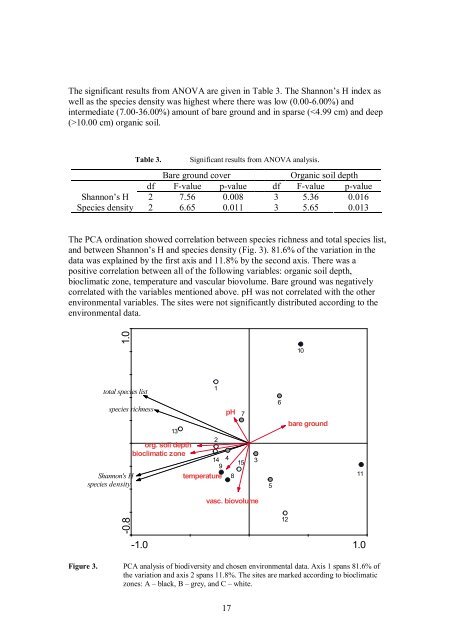
The significant results from ANOVA are given <strong>in</strong> Table 3. The Shannon’s H <strong>in</strong>dex as<br />
well as the species density was highest where there was low (0.006.00%) and<br />
<strong>in</strong>termediate (7.0036.00%) amount of bare ground and <strong>in</strong> sparse (10.00 cm) organic soil.<br />
Table 3. Significant results from ANOVA analysis.<br />
Bare ground cover Organic soil depth<br />
df Fvalue pvalue df Fvalue pvalue<br />
Shannon’s H 2 7.56 0.008 3 5.36 0.016<br />
Species density 2 6.65 0.011 3 5.65 0.013<br />
The PCA ord<strong>in</strong>ation showed correlation between species richness and <strong>to</strong>tal species list,<br />
and between Shannon’s H and species density (Fig. 3). 81.6% of the variation <strong>in</strong> the<br />
data was expla<strong>in</strong>ed by the first axis and 11.8% by the second axis. There was a<br />
positive correlation between all of the follow<strong>in</strong>g variables: organic soil depth,<br />
bioclimatic zone, temperature and vascular biovolume. Bare ground was negatively<br />
correlated with the variables mentioned above. pH was not correlated with the other<br />
environmental variables. The sites were not significantly distributed accord<strong>in</strong>g <strong>to</strong> the<br />
environmental data.<br />
0.8 1.0<br />
<strong>to</strong>tal species list<br />
species richness<br />
13<br />
org. soil depth<br />
2<br />
bioclimatic zone<br />
14 4<br />
9<br />
15<br />
Shannon's H<br />
species density<br />
temperature 8<br />
1<br />
pH<br />
1.0 1.0<br />
17<br />
7<br />
3<br />
vasc. biovolume<br />
5<br />
6<br />
12<br />
10<br />
bare ground<br />
Figure 3. PCA analysis of biodiversity and chosen environmental data. Axis 1 spans 81.6% of<br />
the variation and axis 2 spans 11.8%. The sites are marked accord<strong>in</strong>g <strong>to</strong> bioclimatic<br />
zones: A – black, B – grey, and C – white.<br />
11