Arctic plant ecology: From tundra to polar desert in Svalbard - Unis
Arctic plant ecology: From tundra to polar desert in Svalbard - Unis
Arctic plant ecology: From tundra to polar desert in Svalbard - Unis

Create successful ePaper yourself
Turn your PDF publications into a flip-book with our unique Google optimized e-Paper software.
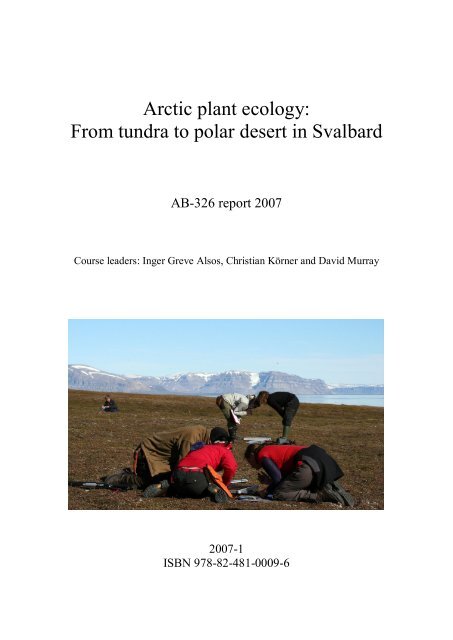
<strong>Arctic</strong> <strong>plant</strong> <strong>ecology</strong>:<br />
<strong>From</strong> <strong>tundra</strong> <strong>to</strong> <strong>polar</strong> <strong>desert</strong> <strong>in</strong> <strong>Svalbard</strong><br />
AB326 report 2007<br />
Course leaders: Inger Greve Alsos, Christian Körner and David Murray<br />
20071<br />
ISBN 9788248100096
Content<br />
<strong>Arctic</strong> <strong>plant</strong> <strong>ecology</strong>: <strong>From</strong> <strong>tundra</strong> <strong>to</strong> <strong>polar</strong> <strong>desert</strong> <strong>in</strong> <strong>Svalbard</strong> – summary<br />
Inger Greve Alsos, Christian Körner and David Murray<br />
1. Biodiversity <strong>in</strong> the high <strong>Arctic</strong>: species richness at selected sites <strong>in</strong> <strong>Svalbard</strong>,<br />
7880°N<br />
Henrik An<strong>to</strong>nsson, Marte Holten Jørgensen and Ane Christensen Tange<br />
2. Life <strong>in</strong> the <strong>Arctic</strong> – a struggle for survival?<br />
Simone Lang, Merete Wiken Dees and Kathr<strong>in</strong> Bockmühl<br />
3. Recruitment along retreat<strong>in</strong>g glaciers<br />
Unni Vik, Ingel<strong>in</strong>n Aarnes and Eike Müller<br />
4. High nutrient levels can compensate for the growthlimit<strong>in</strong>g effect of low<br />
temperatures<br />
Elke Morgner and Christian E. Pettersen<br />
5. Reproductive allocation <strong>in</strong> the high <strong>Arctic</strong><br />
Heike Baldeweg and Emma Bengtsson<br />
6. Freez<strong>in</strong>g resistance <strong>in</strong> high arctic <strong>plant</strong> species of <strong>Svalbard</strong> <strong>in</strong> midsummer<br />
Christian Körner, Inger Greve Alsos and AB326 students<br />
2<br />
3<br />
11<br />
33<br />
55<br />
73<br />
83<br />
93
<strong>Arctic</strong> <strong>plant</strong> <strong>ecology</strong>: <strong>From</strong> <strong>tundra</strong> <strong>to</strong> <strong>polar</strong> <strong>desert</strong> <strong>in</strong><br />
<strong>Svalbard</strong> – summary<br />
Inger Greve Alsos 1 , Christian Körner 2 and David Murray 3<br />
1 UNIS – The University Centre <strong>in</strong> <strong>Svalbard</strong>, P.O.Box 156, NO9171 Longyearbyen, Norway, 2 Institute<br />
of Botany, University of Basel, Schönbe<strong>in</strong>strasse 6, CH4056 Basel, Switzerland, 3 University of Alaska<br />
Museum of the North, Fairbanks, Alaska, 997756960 USA<br />
Introduction<br />
With<strong>in</strong> the <strong>Arctic</strong>, there is a strong climatic gradient from the southern arctic <strong>tundra</strong><br />
zone forest eco<strong>to</strong>ne <strong>to</strong> the <strong>polar</strong> <strong>desert</strong> zone found <strong>to</strong> the very edge of the arctic<br />
landmass (Walker et al. 2005). Three of these zones are present on <strong>Svalbard</strong>, the mid<br />
arctic <strong>tundra</strong> zone (zone C), the northern arctic <strong>tundra</strong> zone (zone B) and the <strong>polar</strong><br />
<strong>desert</strong> zone (zone A, Elvebakk 2005). The mean air temperature dur<strong>in</strong>g the warmest<br />
month <strong>in</strong> these three zones <strong>in</strong> <strong>Svalbard</strong> are 46 ºC , 2.54 ºC and 12.5 ºC, respectively<br />
(Elvebakk 2005). Because temperature is a major fac<strong>to</strong>r determ<strong>in</strong><strong>in</strong>g <strong>plant</strong> diversity <strong>in</strong><br />
the <strong>Arctic</strong> (Rannie 1986, Walker 1995), global climate warm<strong>in</strong>g is expected <strong>to</strong> have<br />
an impact on arctic flora and vegetation. Dur<strong>in</strong>g our course, the focus was thus on<br />
changes <strong>in</strong> <strong>plant</strong> diversity, <strong>plant</strong> distribution, and <strong>plant</strong> traits along the climatic<br />
gradient from bioclimatic zone C <strong>to</strong> A.<br />
Fac<strong>to</strong>rs other than temperature have strong impacts on <strong>plant</strong> life and diversity, e.g.<br />
soil moisture (Raup 1969, Gould & Walker 1999), soil acidity (Gould & Walker<br />
1999, Gough et al. 2000, Karlsen & Elvebakk 2003), nutrient <strong>in</strong>put (Körner 2003),<br />
<strong>plant</strong> productivity (Fox 1992, Jonasson 1992, van der Welle et al. 2003), age of the<br />
terra<strong>in</strong> (Matthews 1992, Moreau 2005) and natural disturbance (Raup 1969). Our site<br />
selection covered a suite of such covariables.<br />
<strong>Arctic</strong> <strong>plant</strong> communities are expected <strong>to</strong> undergo species turnover due <strong>to</strong> climate<br />
change (Walker et al.2006, Kullman 2000, Alsos et al. 2007). This could cause local<br />
loss or <strong>in</strong>crease <strong>in</strong> <strong>plant</strong> diversity. Although more than 100 hypotheses have been<br />
raised <strong>to</strong> address fac<strong>to</strong>rs determ<strong>in</strong><strong>in</strong>g biodiversity (Grime 1973, Palmer 1994),<br />
variance <strong>in</strong> species diversity is often poorly expla<strong>in</strong>ed by predic<strong>to</strong>r variables (Grace<br />
1999). Understand<strong>in</strong>g this issue is importance <strong>to</strong> predict<strong>in</strong>g short and longterm<br />
effects of climate change on arctic <strong>tundra</strong>. In project 1, we <strong>in</strong>vestigated how soil<br />
temperature, soil moisture, soil pH, exposure, slope angle, bioclimatic zones, and<br />
productivity were related <strong>to</strong> vascular <strong>plant</strong> diversity <strong>in</strong> <strong>Svalbard</strong>.<br />
Species may have different amplitudes of <strong>to</strong>lerance <strong>to</strong> environmental fac<strong>to</strong>rs (Raup<br />
1969, Karlsen & Elvebakk 2003). Some have wide amplitudes, are broadly <strong>to</strong>lerant,<br />
whereas others have more narrow amplitude. The question is whether widespread<br />
species have a wide ecological amplitude or could they have a narrow <strong>to</strong>lerance for<br />
specific habitats, but these habitats are widespread? This is <strong>in</strong>vestigated <strong>in</strong> project 2.<br />
Special emphasis was on Euphrasia wettste<strong>in</strong>ii, a thermophilic annual which seems <strong>to</strong><br />
have spread locally <strong>in</strong> <strong>Svalbard</strong> dur<strong>in</strong>g recent years, a period with warmer than<br />
average temperatures.<br />
3
It is expected that northward expansion of southern species dom<strong>in</strong>at<strong>in</strong>g <strong>in</strong> the Low<br />
<strong>Arctic</strong>, could cause problems <strong>to</strong> high arctic species with low competitive abilities.<br />
However, retreat<strong>in</strong>g glaciers may provide new habitats <strong>in</strong> which the high arctic<br />
species may colonise and persist dur<strong>in</strong>g periods of warmer climate . The ability <strong>to</strong><br />
colonise newly deglaciated terra<strong>in</strong> varies among species (Matthews 1992). In project<br />
3 we studied glacial succession patterns <strong>in</strong> the three bioclimatic zones <strong>to</strong> identify high<br />
arctic species that are not represented <strong>in</strong> up <strong>to</strong> 100 years old successional stages and<br />
therefore might be at risk of ext<strong>in</strong>ction <strong>in</strong> a warmer climate.<br />
Low temperatures dur<strong>in</strong>g a short grow<strong>in</strong>g season reduce soil nutrient availability.<br />
S<strong>in</strong>ce low temperature and low nutrient availability may <strong>in</strong>teract, it is difficult <strong>to</strong><br />
dist<strong>in</strong>guish the impact of each of these variables (Körner 2003). Counter<strong>in</strong>tuitively,<br />
leaves from <strong>plant</strong>s from extremely cold climates had been found <strong>to</strong> be richer <strong>in</strong><br />
macronutients (N, P) than <strong>plant</strong>s from warmer environments, which had been<br />
expla<strong>in</strong>ed as 'luxurious consumption' (Körner 1989). Locally, the <strong>in</strong>put of nutrient<br />
can be high <strong>in</strong> <strong>Svalbard</strong> due <strong>to</strong> birds or mammals. Especially high levels of nutrients<br />
are found under bird cliffs. The aim of study 4 was <strong>to</strong> test whether temperature per se<br />
controls <strong>plant</strong> growth or whether growth is constra<strong>in</strong>ed by temperature<strong>in</strong>duced<br />
nutrient shortage.<br />
In cold climates, <strong>plant</strong>s are generally smaller than <strong>in</strong> warm climates, and as life<br />
conditions become more adverse m<strong>in</strong>iaturization of <strong>plant</strong>s progresses. Are the<br />
vegetative and reproductive structures similarly affected (isometric allocation), or do<br />
<strong>plant</strong>s give priority <strong>to</strong> one of the two (asymmetric allocation), which would h<strong>in</strong>t at<br />
selective pressure (evolutionary adaptation)? In alp<strong>in</strong>e environments it has been found<br />
that the allocation of resources shifts <strong>to</strong>wards the reproductive structures as altitudes<br />
<strong>in</strong>creases (Fabbro & Körner 2003). In study 5, we explore this for the first time <strong>in</strong> the<br />
<strong>Arctic</strong>.<br />
Climate change is not only expected <strong>to</strong> result <strong>in</strong> warmer conditions <strong>in</strong> the arctic, but<br />
also more extreme weather. This may even <strong>in</strong>clude more frequent or more <strong>in</strong>tense<br />
freez<strong>in</strong>g events dur<strong>in</strong>g the grow<strong>in</strong>g period due <strong>to</strong> changed atmospheric circulation,<br />
despite overall (mean) warm<strong>in</strong>g. Freez<strong>in</strong>g resistance is the first and most fundamental<br />
environmental filter <strong>plant</strong> species have <strong>to</strong> pass <strong>to</strong> establish susta<strong>in</strong>able growth <strong>in</strong> the<br />
<strong>Arctic</strong>. However, even arctic <strong>plant</strong>s are susceptible <strong>to</strong> freez<strong>in</strong>g when they are active,<br />
i.e. dur<strong>in</strong>g the grow<strong>in</strong>g season. Tissues of arctic and alp<strong>in</strong>e <strong>plant</strong>s may <strong>to</strong>lerate almost<br />
any temperature (some even liquid nitrogen) when they are dormant, but might be<br />
killed by temperatures between 2 and 9 °C, when actively grow<strong>in</strong>g and flower<strong>in</strong>g.<br />
Hence, it is well established that extreme summer events are the critical issue <strong>to</strong> look<br />
at (for a review see Körner 2003). Dur<strong>in</strong>g the course, we tested the freez<strong>in</strong>g resistance<br />
of 12 species.<br />
Material and methods<br />
Thirteen students from Norway, Sweden and Germany, study<strong>in</strong>g at n<strong>in</strong>e different<br />
<strong>in</strong>stitutions, participated <strong>in</strong> the course. The students worked <strong>in</strong> groups of two or three.<br />
All students participated <strong>in</strong> data collection for all projects, whereas each group was<br />
responsible for study design, analys<strong>in</strong>g and writ<strong>in</strong>g about their study. Data were<br />
collected dur<strong>in</strong>g a seven days cruise with M/S S<strong>to</strong>ckholm. We visited 10 different<br />
4
localities <strong>in</strong> western and northern <strong>Svalbard</strong>. We visited one bird cliff and one glacier<br />
foreland <strong>in</strong> each bioclimatic zone as well as sites with vegetation typical for each<br />
zone.<br />
Two <strong>to</strong> six sites were visited with<strong>in</strong> each of the ten localities, and a <strong>to</strong>tal of 88 plots<br />
were analysed among sites. The plots were randomly chosen for unbiased application<br />
of plot sampl<strong>in</strong>g. The po<strong>in</strong>t <strong>in</strong>tercept method was used <strong>to</strong> record the vascular species<br />
with<strong>in</strong> each plot (Bråthen & Hagberg 2004). At each site, 50 cm x 50 cm quadrats<br />
with 25 po<strong>in</strong>ts of equal <strong>in</strong>tercepts of 10 cm were used. In most cases three replicates<br />
were analysed per sites but sometimes two or four replicates were recorded depend<strong>in</strong>g<br />
on time and heterogeneity of the vegetation. Additional species <strong>in</strong> the plot were also<br />
recorded. The percentage cover of vascular <strong>plant</strong>s, bryophytes, lichens, bare<br />
ground/rocks, and cryp<strong>to</strong>gram crust was estimated for each plot. The follow<strong>in</strong>g<br />
environmental fac<strong>to</strong>rs were recorded at each plot: soil temperature, soil moisture, soil<br />
pH, exposure, slope angle, bioclimatic zones, and productivity. Species list for each<br />
site were compiled. These data were shared among project 1 (all sites except the<br />
glacier forelands), 2 (all sites) and 3 (only glacier foreland sites).<br />
To explore whether high nutrient <strong>in</strong>put could compensate for low temperatures, and <strong>to</strong><br />
f<strong>in</strong>d out how <strong>plant</strong>s allocate resources <strong>in</strong><strong>to</strong> growth and reproduction, biometric <strong>plant</strong><br />
traits were collected for as many species as possible. Data were collected from 18<br />
species below bird cliffs and <strong>in</strong> areas with no additional nutrients <strong>in</strong>put. For the<br />
reproduction project, data were collected for a <strong>to</strong>tal of 37 species: 17 species <strong>in</strong><br />
bioclimatic zone A, 19 species <strong>in</strong> bioclimatic zone B and 23 species <strong>in</strong> bioclimatic<br />
zone C. Aboveground <strong>plant</strong> height, longest leaf length (without petiole) or width (if<br />
the width was larger than the length), and largest blossom diameter (or length of the<br />
whole <strong>in</strong>florescence for gram<strong>in</strong>oids) were measured. At least three samples of each<br />
herbaceous species were harvested. In addition, 18 samples of aboveground biomass<br />
was harvested <strong>in</strong> representative full cover 10 x 10 cm plots, dried and weighed.<br />
For the cold resistance test, at least five mature leaves and five nonsenescent, fully<br />
open <strong>in</strong>florescences of 12 species were collected for each of the follow<strong>in</strong>g treatments:<br />
a cool room at +5 °C (control), a freezer set at 18 °C (guaranteed freez<strong>in</strong>g damage)<br />
and a freezer set <strong>to</strong> the expected critical range of 7 °C. Damage was visually<br />
<strong>in</strong>spected.<br />
The students had ten days for analys<strong>in</strong>g all data and writ<strong>in</strong>g their reports. Some<br />
modifications were made on the reports after the course.<br />
Results and discussion<br />
Species diversity, on a landscape as well as at a more local scale, tended <strong>to</strong> decrease<br />
from bioclimatic zone C <strong>to</strong> A (An<strong>to</strong>nsson, Jørgensen and Tange). This can be<br />
expla<strong>in</strong>ed by a decrease <strong>in</strong> vegetation cover from bioclimatic zones C <strong>to</strong> A, as<br />
supported by ANOVA analyses show<strong>in</strong>g significant relations between species density<br />
and the proportion of bare ground <strong>to</strong> <strong>plant</strong> cover. In addition, fewer <strong>plant</strong>s are adapted<br />
<strong>to</strong> the harsh conditions present there (Körner 2003, PAF 2007). This decrease, though<br />
not significant, agrees with previous studies from <strong>Svalbard</strong> (Marte<strong>in</strong>sdòttir & Arnesen<br />
2006) and the <strong>Arctic</strong> (Young 1971, Walker 1995). The relation between species<br />
diversity and the other environmental fac<strong>to</strong>rs was less clear.<br />
5
Our results suggest that: species diversity, on a landscape as well as local scale,<br />
decreases <strong>in</strong> relation <strong>to</strong> bioclimatic zones (from C <strong>to</strong> A); whereas the number of<br />
species <strong>in</strong> different vegetation types rema<strong>in</strong>s fairly constant throughout the <strong>Arctic</strong>.<br />
Data on ecological amplitude were collected for 67 vascular <strong>plant</strong> species (Lang, Dees<br />
and Bockmühl). The most important fac<strong>to</strong>rs determ<strong>in</strong><strong>in</strong>g distribution of <strong>plant</strong> species<br />
<strong>in</strong> <strong>Svalbard</strong> were pH and bioclimatic zones. There was no species with a pH<br />
amplitude rang<strong>in</strong>g from low <strong>to</strong> high pH <strong>to</strong>lerance <strong>in</strong> bioclimatic zone C, but one and<br />
three <strong>in</strong> bioclimatic zone B and A, respectively. The ecological amplitude of the<br />
species found <strong>in</strong> <strong>Svalbard</strong> were with<strong>in</strong> the range recorded <strong>in</strong> Greenland (Böcher 1963,<br />
Gelt<strong>in</strong>g 1934, Raup 1965, Raup 1969, Sørensen 1933, Karlsen & Elvebakk. 2003). A<br />
m<strong>in</strong>ority of species was found <strong>to</strong> be widely spread and cover<strong>in</strong>g a wide amplitudes<br />
regard<strong>in</strong>g pH. The majority of the species studied possessed narrow <strong>to</strong> medium wide<br />
amplitudes regard<strong>in</strong>g pH, yet they were widespread on <strong>Svalbard</strong>. No significant<br />
correlation was found between the number of localities where the species was found<br />
and the potential distribution area based on substrate type. Thus, the hypothesis that<br />
widespread species possess a wide ecological amplitude was rejected.<br />
On the glacier forelands <strong>in</strong> bioclimatic zone C and B, the flora differed on mora<strong>in</strong>es of<br />
different ages (Vik, Aarnes and Müller). Thus, these glacier forelands follow the<br />
succession pattern of species substitution with time as observed <strong>in</strong> other studies<br />
(Moreau 2005, Hodk<strong>in</strong>son & Coulson 2003, Jones & Henry 2003). In bioclimatic<br />
zone A however, the vascular <strong>plant</strong> flora of the mora<strong>in</strong>es were very similar<br />
irrespective of mora<strong>in</strong>es’ age and no clear succession pattern could be found. Species<br />
richness <strong>in</strong>creases <strong>in</strong> bioclimatic zone C and B with time whilst <strong>in</strong> bioclimatic zone A<br />
it was comparatively constant. The vegetation <strong>in</strong> bioclimatic zone A is scattered and<br />
often consists of only s<strong>in</strong>gle, <strong>in</strong>dividual <strong>plant</strong>s. Thus, these marg<strong>in</strong>al populations of<br />
vascular <strong>plant</strong>s rarely develop beyond <strong>in</strong>itial succession phases (Svoboda & Henry<br />
1987). To our knowledge, no other glacial forelands <strong>in</strong> bioclimatic zone A have been<br />
studied, but we expect that lack of clear, successional stages is a general feature of<br />
glaciers forelands <strong>in</strong> such extreme environments. The high arctic species M<strong>in</strong>uartia<br />
rossii, Festuca hyperborea and Poa abbreviata were not found on the glacier<br />
forelands. More glacier forelands should be <strong>in</strong>vestigated <strong>to</strong> see if these habitats could<br />
provide a refugia, at least temporary, for these species <strong>in</strong> a warmer climate.<br />
Measurements of 778 <strong>in</strong>dividuals of 19 different vascular <strong>plant</strong> species showed a<br />
decrease <strong>in</strong> <strong>plant</strong> height, leaf size, and biomass from bioclimatic zone C <strong>to</strong> A<br />
(Morgner and Pettersen). There was a positive correlation between <strong>plant</strong> height, leaf<br />
size, and biomass with temperature, as well as nutrient availability. However, there<br />
was also a significant <strong>in</strong>teraction between temperature and nutrient availability <strong>in</strong> their<br />
effect on <strong>plant</strong> growth. Increased nutrient levels seemed <strong>to</strong> compensate for the growth<br />
limit<strong>in</strong>g effect of temperature <strong>in</strong> bioclimatic zone B and C, but not so <strong>in</strong> zone A. Thus,<br />
this study provides support <strong>to</strong> the hypothesis that high nutrient availability can<br />
compensate for the growth limit<strong>in</strong>g effect of low temperatures, but at the thermal limit<br />
for <strong>plant</strong> growth, temperature itself sets the limit rather than nutrients. Further support<br />
for this hypothesis was evident from the biomass samples. The biomass per unit land<br />
area of full cover plots decl<strong>in</strong>ed slightly from bioclimatic zone C <strong>to</strong> A, and bird cliffs<br />
showed much higher biomass than nearby reference sites. The relative fertilizer effect<br />
6
seamed <strong>to</strong> decrease from zone C <strong>to</strong> A, but the low number of replicates did not allow<br />
a statistical test of this.<br />
As <strong>plant</strong> size decreases from bioclimatic zone C <strong>to</strong> A, the relative <strong>in</strong>vestment <strong>in</strong><br />
reproductive structure <strong>in</strong>creased <strong>in</strong> forbs (Baldeweg and Bengtsson). Gram<strong>in</strong>oids on<br />
the other hand, change isometrically along the same gradient. This is probably due <strong>to</strong><br />
different poll<strong>in</strong>ation systems. Insect poll<strong>in</strong>ated species have <strong>to</strong> attract poll<strong>in</strong>a<strong>to</strong>rs <strong>in</strong> an<br />
<strong>in</strong>creas<strong>in</strong>gly barren landscape with overproportionally showy flowers. Poll<strong>in</strong>a<strong>to</strong>r<br />
driven poll<strong>in</strong>ation thus appears <strong>to</strong> select <strong>in</strong>florescence size differently from w<strong>in</strong>d<br />
driven poll<strong>in</strong>ation.<br />
The cold resistance test showed that the 12 species tested exhibited a broad damage<br />
spectrum from zero <strong>to</strong> 100% (Körner and Alsos). We concluded that dur<strong>in</strong>g the<br />
grow<strong>in</strong>g season, freez<strong>in</strong>g temperatures of 7 °C would damage a significant fraction<br />
of the arctic flora. Given that 10 °C has been recorded for air temperature <strong>in</strong><br />
bioclimatic zone C <strong>in</strong> June, this means that earlier spr<strong>in</strong>g growth <strong>in</strong> the course of<br />
global warm<strong>in</strong>g at an otherwise unchanged likelihood of the occurrence of such an<br />
extreme events would lead <strong>to</strong> massive losses of tissue and above ground productivity.<br />
Our survey confirms knowledge from the Alps for the critical range of temperature <strong>to</strong><br />
be explored <strong>in</strong> a more detailed assessment The study also <strong>in</strong>dicates that it matters a<br />
lot which species are exam<strong>in</strong>ed. Overall, the data appear <strong>to</strong> match the summer<br />
freez<strong>in</strong>g <strong>to</strong>lerance known for alp<strong>in</strong>e <strong>plant</strong>s of the temperate zone (Körner 2003) and<br />
do not <strong>in</strong>dicate a greater frost hard<strong>in</strong>ess for these high arctic <strong>plant</strong>s as had been<br />
suggested from experiments with Saxifraga oppositifolia under controlled growth<br />
conditions (Robberecht and Junttila 1992).<br />
References<br />
Alsos, I.G., Eidesen, P.B., Ehrich, D., Skrede, I., Westergaard, K., Jacobsen, G.H.,<br />
Landvik, J.Y., Taberlet, P., Brochmann, C. 2007: Frequent LongDistance Plant<br />
Colonization <strong>in</strong> the Chang<strong>in</strong>g <strong>Arctic</strong>. Science 316: 1606 – 1609<br />
Bråthen, K. A. & Hagberg, O. 2004: More efficient estimation of <strong>plant</strong> biomass.<br />
Journal of Vegetation Science, 15: 653660<br />
Böcher, T. W. 1963: Phy<strong>to</strong>geography of middle west Greenland. Meddelelser om<br />
Grønland, 148<br />
Elvebakk, A. 2005: A vegetation map of <strong>Svalbard</strong> on the scale 1 : 3.5 mill.<br />
Phy<strong>to</strong>coenologia 35: 951967<br />
Fabbro T. & Körner C. 2004: Altitud<strong>in</strong>al differences <strong>in</strong> flower traits and reproductive<br />
allocation. Flora 199: 7081<br />
Fox, J.F. 1992: Responses of diversity and growth form dom<strong>in</strong>ance <strong>to</strong> fertility <strong>in</strong><br />
Alaskan <strong>tundra</strong> fellfield communities. <strong>Arctic</strong> and Alp<strong>in</strong>e research 24:233237<br />
Gelt<strong>in</strong>g, P. 1934: Studies on the vascular <strong>plant</strong>s of east Greenland between Franz<br />
Joseph Fjord and Dove Bay (Lat. 73° 15’ – 76° 20’ N.). Meddelelser om Grønland,<br />
101<br />
7
Gough, L., Shaver, G.R., Carroll, J., Royer, D.L. & Laundre, J.A. 2000: Vascular<br />
<strong>plant</strong> species richness <strong>in</strong> Alaskan arctic <strong>tundra</strong>: the importance of soil pH. Journal of<br />
Ecology 88: 5466<br />
Gould, W.A. & Walker, M.D. 1999: Plant communities and landscape diversity along<br />
a Canadian <strong>Arctic</strong> river. Journal of Vegetation Science 10: 537548<br />
Grace, J. B. 1999: The fac<strong>to</strong>rs controll<strong>in</strong>g species density <strong>in</strong> herbaceous <strong>plant</strong><br />
communities: an assessment. Perspectives <strong>in</strong> Plant Ecology, Evolution and<br />
Systematics 2: 128<br />
Grime, J.P. 1973: Control of species density <strong>in</strong> herbaceous vegetation. J. Environ.<br />
Manage. 1: 151–167<br />
Hodk<strong>in</strong>son, I. D., Coulson, S. J. & Webb, N. R. 2003: Community assembly along<br />
proglacial chronosequences <strong>in</strong> the high Arcic: vegetation and soil development <strong>in</strong><br />
northwest <strong>Svalbard</strong>. Journal of Ecology 91, 651663<br />
Jonasson, S. 1992: Plantresponses <strong>to</strong> fertilization and species removal <strong>in</strong> <strong>tundra</strong><br />
related <strong>to</strong> ommunity structure and clonality. Oikos 63: 420429<br />
Jones. G. & Henry, G. H. R. 2003: Primary <strong>plant</strong> succession on recently deglaciated<br />
terra<strong>in</strong> <strong>in</strong> the Canadian High <strong>Arctic</strong>. Journal of Biogeography 30, 277296<br />
Karlsen, S. R. & A. Elvebakk 2003: A method us<strong>in</strong>g <strong>in</strong>dica<strong>to</strong>r <strong>plant</strong>s <strong>to</strong> map local<br />
climatic variation <strong>in</strong> the Kangerlussuaq/Scoresby Sund area, East Greenland.<br />
Journal of Biogeography 30: 14691491<br />
Kullman, L. 2000. Treelimit rise and recent warm<strong>in</strong>g: a geoecological case study from the<br />
Swedish Scandes. Norsk. geografisk Tidsskrift 54: 4959<br />
Körner C. 1989. The nutritional status of <strong>plant</strong>s from high altitudes. A worldwide<br />
comparison. Oecologia: 81: 379391<br />
Körner, C. 2003: Alp<strong>in</strong>e <strong>plant</strong> Life. Spr<strong>in</strong>ger, Berl<strong>in</strong><br />
Marte<strong>in</strong>sdóttir, B. & Arnesen, G. 2006: Species richness of vascular <strong>plant</strong>s and<br />
cryp<strong>to</strong>games <strong>in</strong> the High <strong>Arctic</strong>: no universal pattern observed <strong>in</strong> relation <strong>to</strong> primary<br />
productivity. Pp. 1122 <strong>in</strong> I.S. Jónsdóttir: Explor<strong>in</strong>g <strong>plant</strong>ecological patterns at different<br />
spatial scales <strong>in</strong> <strong>Svalbard</strong>. UNIS publication series 20061, www.unis.no<br />
Matthews, J. A. 1992: The <strong>ecology</strong> of recently deglaciated terra<strong>in</strong>. A geoecological<br />
approach <strong>to</strong> glacier forelands and primary succession. Cambridge, Cambridge<br />
University Press<br />
Moreau, M., Laffly, D., Joly, D. & Brossard, T. 2005: Analysis of <strong>plant</strong> colonization<br />
on an arctic mora<strong>in</strong>e s<strong>in</strong>ce the end of the little Ice Age us<strong>in</strong>g remotely sensed data<br />
and a Bayesian approach. Remote Sens<strong>in</strong>g of Environment 99, 244253<br />
PAF. 2007: Checklist of the Panarctic Flora (PAF). Draft version. I: Elven, R.,<br />
Murray, D. F., Razzhiv<strong>in</strong>, V. & Yurtsev, B. A. (red.). Oslo, Univ. of Oslo<br />
Palmer, M.W. 1994: Variation <strong>in</strong> species richness: <strong>to</strong>wards a unification of<br />
hypotheses. Folia Geobotanica & Phy<strong>to</strong>taxonomica 29: 511–530<br />
Rannie, W. F. 1986: Summer air temperature and number of vascular species <strong>in</strong> arctic<br />
Canada. <strong>Arctic</strong> 39: 133137<br />
8
Raup, H. M. 1965: The flower<strong>in</strong>g <strong>plant</strong>s and ferns of the Mesters Vig district,<br />
northeast Greenland. Meddelelser om Grønland, 166<br />
Raup, H. M. 1969: The relation of the vascular flora <strong>to</strong> some fac<strong>to</strong>rs of site <strong>in</strong> the<br />
Mester Vig district, northeast Greenland. Meddelelser om Grønland, 176: 180<br />
Robberecht, R. & Junttila, O. 1992: The Freez<strong>in</strong>g Response of an <strong>Arctic</strong> Cushion<br />
Plant, Saxifraga caespi<strong>to</strong>sa L.: Acclimation, Freez<strong>in</strong>g Tolerance and Ice Nucleation.<br />
Ann Bot 70:129135<br />
Svoboda, J., Henry, G. H. R. 1987: Succession <strong>in</strong> marg<strong>in</strong>al arctic environments.<br />
<strong>Arctic</strong> and Alp<strong>in</strong>e Research 19, No 4, 373384<br />
Sørensen, T. 1933: The vascular <strong>plant</strong>s of East Greenland from 71° 00’ <strong>to</strong> 73° 30’ N.<br />
Meddelelser om Grønland. 101<br />
Walker, M. D. 1995: Patterns and causes of <strong>Arctic</strong> <strong>plant</strong> community diversity. <strong>Arctic</strong><br />
and alp<strong>in</strong>e biodiversity: Pattern, causes and ecosystem consequences. In : F. S.<br />
Chap<strong>in</strong> III and C. Körner. Berl<strong>in</strong>, Spr<strong>in</strong>gerVerlag: 320<br />
Walker, M. D., Wahren, H. C., Hollister R. D., Henry, G. H. R., Ahlquist, L. E.,<br />
Alatalo,<br />
J. M., BretHarte, S. M., Calef, M. P., Callaghan, T. V., Carroll, A. B., Epste<strong>in</strong>, H.<br />
E., Jónsdóttir, I. S., Kle<strong>in</strong>, J. A., Magnússon, B., Molau, U., Oberbauer, S. F., Rewa<br />
S. P., Rob<strong>in</strong>son, C. H., Shaver, G. R., Sud<strong>in</strong>g, K. N., Thompson, , C. C., Tolvanen,<br />
A., Totland, Ø., Turner, P. L., Tweedie, C. E., Webber, P. J. & Wookey, P. A. 2006:<br />
Plant community responses <strong>to</strong> experimental warm<strong>in</strong>g across the <strong>tundra</strong> biome.<br />
Proceed<strong>in</strong>gs of the National Academy of Sciences of the Unites States of America<br />
103, 13421346<br />
van der Welle, M.E.W., Vermeulen, P.J., Shaver, G.R. & Berendse, F. 2003: Fac<strong>to</strong>rs<br />
determ<strong>in</strong><strong>in</strong>g <strong>plant</strong> species richness <strong>in</strong> Alaskan arctic <strong>tundra</strong>. Journal of Vegetation<br />
Science 14: 711720<br />
Young S.B. 1971: The vascular flora of St. Lawrence Island with special reference <strong>to</strong><br />
floristic zonation <strong>in</strong> the arctic regions. Contrib Gray Herb 201:11115<br />
9
Biodiversity <strong>in</strong> the High <strong>Arctic</strong>: species richness at<br />
selected sites <strong>in</strong> <strong>Svalbard</strong>, 7880°N<br />
Henrik An<strong>to</strong>nsson 1 , Marte Holten Jørgensen 2 , and Ane Christensen Tange 3<br />
1 Department of Plant and Environmental Sciences, Göteborg University. Box 460 S405 30 Göteborg,<br />
Sweden. Email: henrik.an<strong>to</strong>nsson@dpes.gu.se. 2 Program for Molecular Ecology and Biosystematics,<br />
Department of Biology, University of Oslo, P.O. Box 1066 Bl<strong>in</strong>dern, NO0316 Oslo, Norway.<br />
3 Department of Biology, Norwegian University of Science and Technology, NTNU NO7491<br />
Trondheim, Norway.<br />
Abstract<br />
Biodiversity is <strong>to</strong>day greatly endangered by human activities, particularly <strong>in</strong> the<br />
vulnerable <strong>Arctic</strong>. We studied 15 <strong>plant</strong> communities <strong>in</strong> the arctic archipelago of<br />
<strong>Svalbard</strong> (7880°N) distributed <strong>in</strong> three different bioclimatic zones <strong>in</strong> search for<br />
differences <strong>in</strong> species richness, and causes for these. We recorded biodiversity as po<strong>in</strong>t<br />
frame <strong>in</strong>terceptions (0.25 m 2 ; 25 po<strong>in</strong>ts), species present <strong>in</strong> frames, and species lists<br />
for each site visited, and compared them with major environmental fac<strong>to</strong>rs; soil<br />
temperature, soil moisture, soil pH, exposure, slope angle, bioclimatic zones, and<br />
productivity. The result<strong>in</strong>g dataset was analysed us<strong>in</strong>g KruskalWallis tests, Kendall’s<br />
τ correlations, ANOVA and ord<strong>in</strong>ation methods (PCA and RDA). Our results suggest<br />
that: species diversity, on a landscape as well as local scale, decreases <strong>in</strong> relation <strong>to</strong><br />
bioclimatic zones (from C <strong>to</strong> A). Ord<strong>in</strong>ation methods implied that species richness is<br />
correlated with bioclimatic zones, soil temperature, production and ground cover. We<br />
conclude that biodiversity <strong>in</strong> the <strong>Arctic</strong> is highly scaledependent and that this model<br />
needs more test<strong>in</strong>g, <strong>in</strong> order for policymakers <strong>to</strong> make wise decisions on conservation<br />
of <strong>Arctic</strong> environments.<br />
Keywords: <strong>Arctic</strong>, bioclimatic zones, biodiversity, <strong>plant</strong>s, species richness, <strong>Svalbard</strong><br />
Introduction<br />
Human activities are reduc<strong>in</strong>g the number of species worldwide at a rapid pace with<br />
potentially devastat<strong>in</strong>g effects on ecosystem services, and <strong>in</strong> the long run economical<br />
and social consequences (Hooper et al. 2005). Climate changes <strong>in</strong>duce migration of<br />
species, loss of some species, replacement of some and arrival of <strong>in</strong>vad<strong>in</strong>g species <strong>in</strong><strong>to</strong><br />
<strong>plant</strong> communities. Proof for this pattern has been published from numerous sites<br />
along the <strong>tundra</strong> and the <strong>Arctic</strong>, from experimental warn<strong>in</strong>g experiments (Walker et<br />
al.2006), as well as real changes <strong>in</strong> vegetation (Kullman 2000, Truong 2003). This<br />
may cause largescale changes <strong>in</strong> community composition, which surely will have a<br />
detrimental effect on arctic and alp<strong>in</strong>e ecosystems. Concerns for loss of biodiversity<br />
are raised throughout the world and <strong>in</strong>vestigations on what fac<strong>to</strong>rs are most important<br />
<strong>in</strong> determ<strong>in</strong><strong>in</strong>g biodiversity are heavily debated <strong>in</strong> the scientific community. Increas<strong>in</strong>g<br />
our knowledge on this issue is not merely of academic <strong>in</strong>terest, but of great importance<br />
<strong>in</strong> order <strong>to</strong> predict short and longterm effects of climate change on arctic <strong>tundra</strong>.<br />
The first general model concern<strong>in</strong>g what determ<strong>in</strong>es <strong>plant</strong> diversity was developed by<br />
Grime (1973). His humpback or <strong>in</strong>termediate disturbance model of <strong>plant</strong> species<br />
density predicted that species richness is depend<strong>in</strong>g on level of stress and production.<br />
Follow<strong>in</strong>g Grime, a large number of studies on this <strong>to</strong>pic have been published, most of<br />
11
them support<strong>in</strong>g his theory (e.g., Hus<strong>to</strong>n 1979, Tilman 1982, Taylor 1990). In<br />
summary, the majority of theories and hypotheses accentuate <strong>in</strong>termediate levels of<br />
productivity, disturbance, pH and other abiotic fac<strong>to</strong>rs as yield<strong>in</strong>g the highest levels of<br />
species richness. The issue is, however, very complex, and more than 100 hypotheses<br />
on variables controll<strong>in</strong>g species richness have been presented throughout the years<br />
(Palmer 1994), and variance <strong>in</strong> species density is often poorly expla<strong>in</strong>ed by predic<strong>to</strong>r<br />
variables (Grace 1999).<br />
Although conta<strong>in</strong><strong>in</strong>g a vascular <strong>plant</strong> flora of about 2000 taxa of vascular <strong>plant</strong>s<br />
(Elven et al. 2007), and at least another 1000 taxa of bryophytes and lichens, the arctic<br />
flora conta<strong>in</strong>s fewer species than ecosystems of lower latitudes (Gas<strong>to</strong>n et al. 1998).<br />
Walker (1995) propose that there is a f<strong>in</strong>epored filter of the extreme environmental<br />
conditions present <strong>in</strong> the <strong>Arctic</strong>, effectively exclud<strong>in</strong>g many <strong>plant</strong> species from<br />
establishment <strong>in</strong> this region. Studies on variation of species richness along abiotic<br />
gradients <strong>in</strong> arctic and alp<strong>in</strong>e communities po<strong>in</strong>t out temperature (Young 1971, Rannie<br />
1986, Walker 1995), soil moisture (Gould & Walker 1999, Michalet et al. 2002), soil<br />
acidity (Gould & Walker 1999, Gough et al. 2000, Roem & Berendse 2000),<br />
productivity (Fox 1992, Jonasson 1992, Theodose & Bowman 1997, Gough et al.<br />
2002, Grytnes 2002, van der Welle et al. 2003, Constanza et al. 2007) as important<br />
fac<strong>to</strong>rs for species richness, and that local conditions play a crucial role (e.g., Gough et<br />
al. 2000).<br />
Our aim was <strong>to</strong> <strong>in</strong>vestigate the major fac<strong>to</strong>rs determ<strong>in</strong><strong>in</strong>g vascular <strong>plant</strong> diversity <strong>in</strong><br />
different communities along a latitud<strong>in</strong>al gradient <strong>in</strong> the High <strong>Arctic</strong>, expect<strong>in</strong>g a<br />
decrease <strong>in</strong> species richness mov<strong>in</strong>g northwards through the bioclimatic zones C, B,<br />
and A (CAVM Team 2003). <strong>From</strong> our general hypothesis, the follow<strong>in</strong>g predictions<br />
were outl<strong>in</strong>ed: Biodiversity is correlated with bioclimatic zone, community biovolume<br />
(as a substitute for biomass) is correlated with bioclimatic zone and species richness,<br />
and species richness is correlated with soil moisture and soil acidity.<br />
Material and methods<br />
Study sites and data collection<br />
Sites were chosen accord<strong>in</strong>g <strong>to</strong> latitude, bioclimatic zone (Elvebakk et al. 1999,<br />
CAVM team 2003, Elvebakk 2005), vegetation type, and microclimatic conditions<br />
along the western and northern coast of <strong>Svalbard</strong> (Table 1; Figure 1).<br />
In our study we <strong>in</strong>cluded Florabukta as bioclimatic zone A, even though it is <strong>in</strong> the<br />
border between zone A and B. For vegetation analysis three different measures were<br />
used for biodiversity; 1.) Species density: not<strong>in</strong>g every vascular <strong>plant</strong> <strong>in</strong>dividual hit<br />
when us<strong>in</strong>g a needle and po<strong>in</strong>t frames (50x50 cm 2 ; 25 po<strong>in</strong>ts; see Bråthen & Hagberg<br />
2004), 2.) Species richness: not<strong>in</strong>g all vascular <strong>plant</strong> species found with<strong>in</strong> the frame<br />
and 3.) Total species list: not<strong>in</strong>g all vascular <strong>plant</strong> species found <strong>in</strong> each site, an area of<br />
roughly 300 x 300 m, consist<strong>in</strong>g of the same vegetation type. For each frame the<br />
follow<strong>in</strong>g abiotic fac<strong>to</strong>rs were measured; slope angle, exposure, organic soil depth,<br />
soil temperature, soil moisture, and soil pH. Slope angle was measured with an<br />
<strong>in</strong>cl<strong>in</strong>ometer with the precision of 2°; exposure was recorded with a compass, def<strong>in</strong>ed<br />
as the direction <strong>in</strong> which the slope was fac<strong>in</strong>g; organic soil depth was measured with a<br />
ruler after digg<strong>in</strong>g a soil profile, soil temperature was measured with a thermometer at<br />
approximately 10 cm depth <strong>to</strong> calibrate for recent and rapid changes. Soil moisture<br />
was estimated <strong>in</strong> the field by digg<strong>in</strong>g the f<strong>in</strong>gers <strong>in</strong> the soil and determ<strong>in</strong><strong>in</strong>g moisture<br />
12
along a scale where 1 = dry, 2 = mesic, and 3 = wet. For soil pH, soil samples were<br />
taken <strong>in</strong> the field and analyzed <strong>in</strong>doors with a pH meter. Cover was estimated <strong>in</strong> the<br />
field as percentage of the frame, for vascular <strong>plant</strong>s, lichens, bryophytes, cryp<strong>to</strong>gam<br />
crust, and bare ground. In addition, mean canopy height of vascular <strong>plant</strong>s was<br />
estimated (<strong>in</strong> centimetres) <strong>in</strong> the frame. As a substitute for biomass, vascular<br />
biovolume was calculated for each site and frame as the canopy height (cm) multiplied<br />
by vascular <strong>plant</strong> cover (%). It has been shown <strong>in</strong> a study by L<strong>in</strong>dblad (2007), that<br />
vascular <strong>plant</strong> height was a better measure than biomass <strong>to</strong> expla<strong>in</strong> vascular <strong>plant</strong><br />
diversity <strong>in</strong> a midalp<strong>in</strong>e, Sub<strong>Arctic</strong> <strong>plant</strong> community. Similarly, Gough et al. (2000),<br />
found a unimodalshaped correlation of canopy height and species richness and<br />
density. This suggests that us<strong>in</strong>g biovolume is a measure at least as good as biomass.<br />
Lady Frankl<strong>in</strong>fjorden<br />
Biscayarhuken<br />
Florabukta<br />
Re<strong>in</strong>sdyrflya<br />
Mayerbreen<br />
Fjortende julibreen<br />
Ossian Sarsfjellet<br />
Colesdalen<br />
Kapp Thordsen<br />
Figure 1. Sites <strong>in</strong>cluded <strong>in</strong> this study.<br />
At each site, at least three replicate frame analyses were made (Table 1). For some of<br />
the measures (cover and soil moisture), subjective estimations were used. This was<br />
carried out by a large group of people tak<strong>in</strong>g turns and the preced<strong>in</strong>g calibration of<br />
methods may have been <strong>in</strong>sufficient <strong>to</strong> make sure that everybody carried out<br />
measurements <strong>in</strong> the exact same way. This should be kept <strong>in</strong> m<strong>in</strong>d when <strong>in</strong>terpret<strong>in</strong>g<br />
the data.<br />
13
Site ID<br />
Table 1. Sites analysed <strong>in</strong> this study.<br />
Name<br />
Date<br />
1607/1/1 Kapp Thordsen 16.07.2007 8709800, 33X 0511516 C Mesic heath 3<br />
1607/1/2 Kapp Thordsen 16.07.2007 8709858, 33X 0511838 C Calcarious fen 3<br />
1707/1/23 Mayerbreen 17.07.2007 8800608, 33X 0440870 B Old mora<strong>in</strong>e area 7<br />
1707/2/1 Fjortende Julibreen 17.07.2007 8786090, 33X 0439992 B Birdcliff 3<br />
1707/2/2 Fjortende Julibreen 17.07.2007 8786090, 33X 0433912 B Dry heath 3<br />
1807/1/12 Biscayarhuken 18.07.2007 8864496, 33X 0448709 B Dry heath 5<br />
1807/2/12 Re<strong>in</strong>sdyrflya 18.07.2007 8863020, 33X 0478260 B Mesic heath 6<br />
1907/1/1 Florabukta 19.07.2007 8888054, 33X 0571330 A Birdcliff 3<br />
1907/1/2 Florabukta 19.07.2007 8887920, 33X 0571369 A Mesic heath 3<br />
1907/1/3 Florabukta 19.07.2007 8887344, 33X 0571431 A Polar <strong>desert</strong> 3<br />
2007/1/3 Lady Frankl<strong>in</strong>fjorden 20.07.2007 8901644, 33X 0587985 A Mesic heath 3<br />
2107/1/3 Ossian Sarsfjellet 21.07.2007 8762902, 33X 0445660 C Mesic heath 3<br />
2107/2/12 Ossian Sarsfjellet 21.07.2007 8763388, 33X 0445378 C Birdcliff 4<br />
2207/1/15 Colesdalen 22.07.2007 8670162, 33X 0502830 C Mesic heath 18<br />
2207/1/6 Colesdalen 22.07.2007 8670038, 33X 0502916 C Mire 4<br />
14<br />
UTM<br />
coord<strong>in</strong>ates<br />
Bioclimatic<br />
zone<br />
Vegetation<br />
type<br />
Data analysis<br />
Shannon’s diversity <strong>in</strong>dex H was calculated us<strong>in</strong>g the species density results and the<br />
statistical package PAST (Hammer et al. 2001). The <strong>in</strong>dex was used as a measure of<br />
species diversity <strong>in</strong> all analyses. KruskalWallis onecriterion variance analysis<br />
(Kruskal & Wallis 1952) was run with the same program, group<strong>in</strong>g the plots accord<strong>in</strong>g<br />
<strong>to</strong> bioclimatic zones a priori (zone A=1, B=2, C=3). Both species composition and<br />
number of species was tested, as well as a comparison of the different sites. Kendall’s<br />
τ correlations (e.g., Conover, 1998) were calculated for chosen measures us<strong>in</strong>g PAST.<br />
Significance level was reduced with Bonferonni corrections for multiple tests of<br />
<strong>in</strong>dependent variables (e.g., Abdi, 2007). The species richness dataset was clustered<br />
us<strong>in</strong>g simple match<strong>in</strong>g similarity and unweighted pair group method with arithmetic<br />
mean (UPGMA) <strong>in</strong> NTSYSpc 2.02h (Rohlf, 1999).<br />
Ord<strong>in</strong>ation analyses of results per site were performed us<strong>in</strong>g Canoco 4.5 (Biometris –<br />
Plant Research International, Wagen<strong>in</strong>gen). Environmental fac<strong>to</strong>rs were chosen based<br />
on the Kendall’s τ correlations, and all data <strong>in</strong>cluded were transformed<br />
logarithmically. A detrended correspondence analysis (DCA) was run <strong>to</strong> test<br />
distribution of the data. Be<strong>in</strong>g l<strong>in</strong>ear, the species data (Shannon’s H, species density,<br />
species richness, and <strong>to</strong>tal species list) were analysed with a pr<strong>in</strong>cipal component<br />
analysis (PCA), and environmental data were added a posteriori. Redundancy analysis<br />
(RDA) was used <strong>to</strong> f<strong>in</strong>d explana<strong>to</strong>ry effects of the environmental fac<strong>to</strong>rs, and these<br />
were tested with a Markov Cha<strong>in</strong> Monte Carlo (MCMC) permutation test.<br />
Analysis of variance (one way ANOVA) was run us<strong>in</strong>g S PLUS 6.2 for W<strong>in</strong>dows<br />
(Insightful Corp.). All data were transformed logarithmically before runn<strong>in</strong>g the<br />
analysis. All species measures were compared with the abiotic measures <strong>in</strong>cluded <strong>in</strong><br />
the ord<strong>in</strong>ation analyses. In the ANOVA, fac<strong>to</strong>rs were divided <strong>in</strong><strong>to</strong> evenly sized groups.<br />
Tukey HSD post hoc analyses were run when ANOVA gave significant results (for<br />
No. of plots
details see Crawley 2002). The PCA, RDA and ANOVA analysis were performed<br />
us<strong>in</strong>g site means <strong>in</strong> order <strong>to</strong> <strong>in</strong>clude the <strong>to</strong>tal species list.<br />
Results<br />
Species richness, species density and <strong>to</strong>tal species list are summarised <strong>in</strong> Figure 2, and<br />
complete lists are <strong>in</strong> Appendix 1. We found 25, 32, and 49 species <strong>in</strong> <strong>to</strong>tal <strong>in</strong> zones A,<br />
B, and C, respectively. More species were registered us<strong>in</strong>g presence/absence <strong>in</strong> frame<br />
(species richness) as measure, than the po<strong>in</strong>t frame hits (species density) <strong>in</strong> all sites<br />
(Figure 2). The KruskalWallis test gave no significant results when group<strong>in</strong>g the<br />
species richness per frame accord<strong>in</strong>g <strong>to</strong> bioclimatic zones (H=5.039; Hc=5.11;<br />
p=0.0805). Species richness was, however, significantly different among sites<br />
(H=30.48; Hc=30.91; p=0.0066).<br />
Figure 2. Summary of species data. Box plot of species density, species richness and <strong>to</strong>tal<br />
species lists grouped accord<strong>in</strong>g <strong>to</strong> bioclimatic zones.<br />
Kendall’s τ correlations are given <strong>in</strong> Table 2. The only biodiversity measure<br />
significantly correlated with any environmental fac<strong>to</strong>rs, was species density which was<br />
positively correlated with bioclimatic zones, mean<strong>in</strong>g that the number of species<br />
decreases go<strong>in</strong>g from zone C <strong>to</strong> B <strong>to</strong> A, and negatively correlated with latitude.<br />
The UPGMA analysis clustered the sites more or less accord<strong>in</strong>g <strong>to</strong> bioclimatic zones<br />
and vegetation types (not shown). The sites from zone A and B were clustered<br />
<strong>to</strong>gether and <strong>in</strong>cluded also a small cluster with zone C (the heath sites 1607/1/1 and<br />
2107/1/3, and the calcareous fen site 1607/1/2), whereas the rema<strong>in</strong><strong>in</strong>g sites from zone<br />
C clustered <strong>to</strong>gether; the species rich sites <strong>in</strong> Colesdalen (2207) and the birdcliff site <strong>in</strong><br />
Ossian Sarsfjellet.<br />
15
Table 2. Kendall’s τ correlations among selected measures. The lower triangle gives the correlation coefficients, the upper gives the probabilities. Significance is<br />
calculated with Bonferonni corrections for multiple tests (p
The significant results from ANOVA are given <strong>in</strong> Table 3. The Shannon’s H <strong>in</strong>dex as<br />
well as the species density was highest where there was low (0.006.00%) and<br />
<strong>in</strong>termediate (7.0036.00%) amount of bare ground and <strong>in</strong> sparse (10.00 cm) organic soil.<br />
Table 3. Significant results from ANOVA analysis.<br />
Bare ground cover Organic soil depth<br />
df Fvalue pvalue df Fvalue pvalue<br />
Shannon’s H 2 7.56 0.008 3 5.36 0.016<br />
Species density 2 6.65 0.011 3 5.65 0.013<br />
The PCA ord<strong>in</strong>ation showed correlation between species richness and <strong>to</strong>tal species list,<br />
and between Shannon’s H and species density (Fig. 3). 81.6% of the variation <strong>in</strong> the<br />
data was expla<strong>in</strong>ed by the first axis and 11.8% by the second axis. There was a<br />
positive correlation between all of the follow<strong>in</strong>g variables: organic soil depth,<br />
bioclimatic zone, temperature and vascular biovolume. Bare ground was negatively<br />
correlated with the variables mentioned above. pH was not correlated with the other<br />
environmental variables. The sites were not significantly distributed accord<strong>in</strong>g <strong>to</strong> the<br />
environmental data.<br />
0.8 1.0<br />
<strong>to</strong>tal species list<br />
species richness<br />
13<br />
org. soil depth<br />
2<br />
bioclimatic zone<br />
14 4<br />
9<br />
15<br />
Shannon's H<br />
species density<br />
temperature 8<br />
1<br />
pH<br />
1.0 1.0<br />
17<br />
7<br />
3<br />
vasc. biovolume<br />
5<br />
6<br />
12<br />
10<br />
bare ground<br />
Figure 3. PCA analysis of biodiversity and chosen environmental data. Axis 1 spans 81.6% of<br />
the variation and axis 2 spans 11.8%. The sites are marked accord<strong>in</strong>g <strong>to</strong> bioclimatic<br />
zones: A – black, B – grey, and C – white.<br />
11
The RDA ord<strong>in</strong>ation (Fig. 4) showed overall the same trends as the PCA ord<strong>in</strong>ation.<br />
The MCMC run <strong>in</strong> RDA gave no significant result for the degree of explanation<br />
(p=0.0740) from the environmental data. 26.0% of the variation <strong>in</strong> the data was<br />
expla<strong>in</strong>ed by the first axis and 4.4% of the variation <strong>in</strong> the data was expla<strong>in</strong>ed by the<br />
second axis <strong>in</strong> RDA. The sites were somewhat separated accord<strong>in</strong>g <strong>to</strong> bioclimatic<br />
zones along the first axis, and bioclimatic zones expla<strong>in</strong>ed 20% of the variation <strong>in</strong> the<br />
MCMC test, although not significantly (p=0.0740). All measures of diversity showed a<br />
positive correlation with <strong>in</strong>creas<strong>in</strong>g bioclimatic zone (from A <strong>to</strong> C), although not<br />
significantly. There was a relationship between bioclimatic zones and the degree of<br />
bare ground and the layer of organic soil. There was less bare ground (3 ± 2 %) and a<br />
deeper layer of organic soil (10.21 ± 6.21 cm) <strong>in</strong> zone C, than zone A (49 ± 35 %, 2.54<br />
± 2.95 cm, respectively). Zone B was <strong>in</strong>termediate (12 ± 13 %, 5.00 ± 3.22 cm,<br />
respectively). There was also a trend <strong>in</strong> <strong>in</strong>creased soil temperature and vascular<br />
biovolume <strong>in</strong> zone C (6.59 ± 1.68ºC, 1.56 ± 0.58, respectively) compared <strong>to</strong> zone A<br />
(3.93 ± 0.49ºC, 0.39 ± 0.25, respectively).<br />
1.0 1.0<br />
11<br />
8<br />
bare ground<br />
10<br />
9<br />
3<br />
5<br />
7<br />
vasc. biovolume<br />
6<br />
13<br />
temperature<br />
12<br />
4<br />
0.8 1.0<br />
14<br />
18<br />
Shannon's H<br />
species density org. soil depth<br />
bioclimatic zone<br />
15<br />
2<br />
species richness<br />
pH<br />
<strong>to</strong>tal species list<br />
Figure 4. RDA analysis of biodiversity and chosen environmental fac<strong>to</strong>rs. Axis 1 spans 26.0%<br />
of the variation, and axis 2 spans 4.4%. The sites are marked accord<strong>in</strong>g <strong>to</strong> bioclimatic<br />
zones: A – black, B – grey, and C – white.<br />
Discussion<br />
Our measures of biodiversity (species richness, species density, Shannon’s H <strong>in</strong>dex<br />
and <strong>to</strong>tal species list) did not correspond perfectly <strong>to</strong> the different abiotic variables, but<br />
we feel the follow<strong>in</strong>g statements are robust: 1) the value of the <strong>to</strong>tal species list is<br />
1
different among the three bioclimatic zones; 2) mean species richness per site is not<br />
significantly different among zones; and 3) species density is different among zones.<br />
Important when discuss<strong>in</strong>g biodiversity is the scale on which <strong>in</strong>vestigation is made.<br />
Compar<strong>in</strong>g biodiversity among sites is only possible when us<strong>in</strong>g the same scale. All<br />
three of our measures of biodiversity are records of αdiversity, def<strong>in</strong>ed as the<br />
diversity with<strong>in</strong> a stand or community. To make a mean<strong>in</strong>gful comparison between<br />
regions, it is important <strong>to</strong> operate on the same scale.<br />
The <strong>to</strong>tal species list showed an <strong>in</strong>crease <strong>in</strong> numbers when mov<strong>in</strong>g from bioclimatic<br />
zone A <strong>to</strong> C. This trend, though not significant <strong>in</strong> our study, is <strong>in</strong> l<strong>in</strong>e with previous<br />
studies from <strong>Svalbard</strong> (Marte<strong>in</strong>sdòttir & Arnesen 2006) and the <strong>Arctic</strong> <strong>in</strong> general<br />
(Young 1971, Walker 1995). This is a measure of the diversity at landscape level,<br />
<strong>in</strong>clud<strong>in</strong>g several sites with different vegetation types. Compar<strong>in</strong>g our data with the<br />
database for vascular <strong>plant</strong>s found on <strong>Svalbard</strong> (<strong>Svalbard</strong>databasen), there is a <strong>to</strong>tal of<br />
110 vascular <strong>plant</strong>s recorded from Colesdalen, situated <strong>in</strong> bioclimatic zone C, while<br />
Gustav V Land (zone A) has a record of 85 species, although the area is significantly<br />
larger. See also Table 4 for comparison with other arctic areas.<br />
On a smaller scale, when look<strong>in</strong>g at mean species richness per site, there is no<br />
significant difference between sites <strong>in</strong> different regions <strong>in</strong> our study. Most sites<br />
conta<strong>in</strong> between 17 and 27 species, which is correlat<strong>in</strong>g very well with a study from<br />
the Canadian <strong>Arctic</strong> by Franzen & Molau (1999). They found no trends of changes <strong>in</strong><br />
species richness when go<strong>in</strong>g from latitude 62° <strong>to</strong> 78°. In our study, cover<strong>in</strong>g a large<br />
gradient, we visited a restricted number of different vegetation types, and hence could<br />
not capture the full <strong>plant</strong> diversity of every site. In the field the plots were chosen <strong>to</strong><br />
cover one particular k<strong>in</strong>d of habitat (vegetation type) <strong>in</strong> each site.<br />
Species density (mean per site) is <strong>in</strong>creas<strong>in</strong>g when go<strong>in</strong>g from zone A <strong>to</strong> C (Table 2,<br />
Figure 2). This can be expla<strong>in</strong>ed by more scattered vegetation <strong>in</strong> bioclimatic zones A<br />
and B compared <strong>to</strong> C (Table 2), as supported by ANOVA analyses show<strong>in</strong>g significant<br />
relations between species density and bare ground, as well as the fact that fewer <strong>plant</strong>s<br />
are adapted <strong>to</strong> the harsh conditions present there (Körner 2003).<br />
Our results largely supported our first prediction, that biodiversity is correlated with<br />
bioclimatic zone and highlight the importance of scale when discuss<strong>in</strong>g biodiversity,<br />
as shown <strong>in</strong> the discussion above. <strong>From</strong> our results, and also when compar<strong>in</strong>g with<br />
Franzen & Molau (1999), it seems likely that most vegetation types <strong>in</strong> the <strong>Arctic</strong><br />
conta<strong>in</strong> roughly the same number of species, but differences among regions rema<strong>in</strong> on<br />
a larger scale (among bioclimatic zones), due <strong>to</strong> the degree of landscape heterogeneity<br />
and the number of different habitats available for <strong>plant</strong> species (see Table 4).<br />
The first part of our second prediction, concern<strong>in</strong>g community biovolume and<br />
bioclimatic zone also ga<strong>in</strong>ed support from our data. We found community biovolume<br />
<strong>to</strong> decrease with bioclimatic zone, but <strong>in</strong>creased biovolume did not significantly relate<br />
<strong>to</strong> any measure of biodiversity. This is consistent with the work of van der Welle et al.<br />
(2003), and Gough & al. (2000), which showed no correlation of biodiversity and<br />
productivity <strong>in</strong> the <strong>Arctic</strong>. On the other hand, a large number of studies support the<br />
view of a ‘hump back’ relationship of productivity and species richness <strong>in</strong> alp<strong>in</strong>e and<br />
arctic areas (Grytnes 2002, Theodose & Bowman 1997, Jonasson 1992). Constanza et<br />
19
al. (2007) found that at low temperatures (−2.1 °C annual mean), biodiversity was<br />
negatively correlated with net primary production. In <strong>Svalbard</strong> the annual mean<br />
temperature range from 7°C <strong>to</strong> 15°C, so our study does not confirm this view. In a<br />
fertilization experiment <strong>in</strong> borealalp<strong>in</strong>e Alaska, Fox (1992) found a change <strong>in</strong> growth<br />
form and species composition rather than effects on species richness. It is possible that<br />
community productivity, as well as other abiotic variables, may have a larger <strong>in</strong>fluence<br />
on species composition, rather than direct effects on species richness. Although our<br />
different measures of biodiversity is not clearly concordant, the observed pattern was<br />
that the dom<strong>in</strong>ant species, ma<strong>in</strong>ly woody perennials and dwarf shrubs, were the first <strong>to</strong><br />
disappear <strong>in</strong> the areas with harsher environmental conditions (zone B and A), whereas<br />
a fairly large number of species persist, but with very few <strong>in</strong>dividuals.<br />
Our prediction concern<strong>in</strong>g pH and species richness was not supported by our data,<br />
although the relationship between pH and species richness has been positively<br />
correlated <strong>in</strong> numerous studies from different vegetation types, such as arctic <strong>tundra</strong><br />
(Gough et al. 2000, Gould & Walker 1999), temperate heath and grassland (Roem &<br />
Berendse 2000) as well as <strong>Svalbard</strong> (Wenche et al. 2002). Our sample sites were,<br />
however, distributed with<strong>in</strong> a relatively narrow range of pH (5.58.5), thus the full<br />
effect of pH on species richness could not be studied.<br />
The prediction on soil moisture was not supported <strong>in</strong> our study. Explanations for this<br />
could be that it was measured on a coarse scale, where<strong>in</strong> most estimations of moisture<br />
turned out <strong>to</strong> be medium. In addition these measures also were heavily <strong>in</strong>fluenced by<br />
precipitation <strong>in</strong> the preced<strong>in</strong>g 24 hours.<br />
Our ord<strong>in</strong>ation tests (PCA and RDA) gave no significant results, but <strong>in</strong>dicated which<br />
fac<strong>to</strong>rs are most important <strong>in</strong> expla<strong>in</strong><strong>in</strong>g species richness. Bioclimatic zone and<br />
organic soil depth expla<strong>in</strong> the <strong>in</strong>creased species diversity. Bare ground cover is<br />
negatively correlated <strong>to</strong> all of our diversity measures. This is also <strong>in</strong> l<strong>in</strong>e with the<br />
results of our ANOVA. As <strong>to</strong> why we could not get a significant explanation, we<br />
suggest that different fac<strong>to</strong>rs may be act<strong>in</strong>g with different strength <strong>in</strong> different zones.<br />
Conclusion<br />
Differences <strong>in</strong> biodiversity are found when look<strong>in</strong>g at a landscape level and not at plot<br />
(α) level, among frames at different sites. Hence, what creates high biodiversity <strong>in</strong> the<br />
<strong>Arctic</strong> seems <strong>to</strong> be variation of habitats and vegetation types on the landscape. We<br />
welcome further studies on this explanation model, and conclude that if supported by<br />
more general data, this may be an important f<strong>in</strong>d<strong>in</strong>g concern<strong>in</strong>g vulnerable <strong>Arctic</strong><br />
ecosystems. If landscape heterogeneity is the major source of <strong>Arctic</strong> biodiversity,<br />
policymakers need <strong>to</strong> take this <strong>in</strong><strong>to</strong> consideration for future conservation of the <strong>Arctic</strong><br />
environment<br />
Acknowledgements<br />
We thank Inger Greve Alsos and David F. Murray for advices and comments through<br />
all the process, and the participants <strong>in</strong> the course AB326 <strong>Arctic</strong> Plant Ecology 2007<br />
for fruitful discussions.<br />
References<br />
Abdi, H. 2007: The Bonferonni and Šidák corrections for multiple comparisons. In:<br />
Salk<strong>in</strong>d, N. (Ed), Encyclopedia of Measurement and Statistics. Sage, Thousand Oaks<br />
20
Barrett, P.E. & Teeri, J.A. 1973: Vascular <strong>plant</strong>s of the Truelove Inlet region, Devon<br />
Island. <strong>Arctic</strong> 26: 5867<br />
Bay, C. 1992: A phy<strong>to</strong>geographical study of the vascular <strong>plant</strong>s of northern Greenland<br />
north of 74 degrees northern latitude. Meddelelser om Grønland Bioscience 36<br />
Beschel, R.E. 1963: Geobotanical studies on Axel Heiberg Island <strong>in</strong> 1962. Pp. 118 <strong>in</strong>:<br />
Müller, F. (Ed), Axel Heiberg Prelim<strong>in</strong>ary Rept. 19611962. McGill University<br />
Bill<strong>in</strong>gs, W.D. 1992: Phy<strong>to</strong>geographic and evolutionary potential of the arctic flora <strong>in</strong><br />
a chang<strong>in</strong>g climate. Pp: 5989 <strong>in</strong>: Chap<strong>in</strong> FS III, Jefferies RL, Reynolds, JF, Shaver<br />
GS, Svoboda J (Eds) <strong>Arctic</strong> ecosystems <strong>in</strong> a chang<strong>in</strong>g climate: an ecophysiological<br />
perspective. Academic Press, San Diego<br />
Bird, C.D. 1975: The lichen, bryophyte, and vascular <strong>plant</strong> flora and vegetation of the<br />
Land<strong>in</strong>g Lake area, Pr<strong>in</strong>ce Patrick Island, arctic Canada. Canadian Journal of Botany<br />
53: 719744<br />
Brassard, G. & Beschel, R.E. 1968: The vascular flora of Tanquary Fiord, northern<br />
Ellesmere Island, N.W.T. Canadian FieldNaturalist 82: 103113<br />
Brassard, G. & Lang<strong>to</strong>n, R.E. 1970: The flora and vegetation of Van Hauen Pass,<br />
northwestern Ellesmere Island. Canadian FieldNaturalist 84: 357364<br />
Bruggermann, P.F. & Calder, J.A. 1953: Botanical <strong>in</strong>vestigation <strong>in</strong> northeast<br />
Ellesmere Island, 1951. Canadian FieldNaturalist 67: 157174<br />
Bråthen, K.A. & Hagberg, O. 2004: more efficient estimation of <strong>plant</strong> biomass.Journal<br />
of Vegetation Science 15:653660<br />
CAVM(Circum<strong>polar</strong> <strong>Arctic</strong> Vegetation Map) Team. 2003: Circum<strong>polar</strong> <strong>Arctic</strong><br />
Vegetation Map. Scale 1:7 500 000. Conservation of <strong>Arctic</strong> Flora and Fauna (CAFF)<br />
Map no. 1 U.S. Fish and Wildlife service, Anchorage, Alaska<br />
Conover, W.J. 1998: Practical nonparametric statistics. John Wiley and Sons, New<br />
York<br />
Costanza, R., Fisher, B., Mulder, K., Liu, S. & Chris<strong>to</strong>pher, T. 2007: Biodiversity and<br />
ecosystem services: A multiscale empirical study of the relationship between<br />
species richness and net primary production. Ecological Economics 61: 478491<br />
Crawley, M. J. 2002: Staistical comput<strong>in</strong>g: an <strong>in</strong>troduction <strong>to</strong> data analysis us<strong>in</strong>g S<br />
plus. John Wiley and Sons Ltd., Chichester<br />
Elvebakk, A. 2005: A vegetation map of <strong>Svalbard</strong> on the scale 1:3.5 mill.<br />
Phy<strong>to</strong>coenologia 35: 951967<br />
Elvebakk, A., Elven, R. & Razzhiv<strong>in</strong>, V.Y. 1999: Delimitation, zonal and sec<strong>to</strong>rial<br />
subdivision of the <strong>Arctic</strong> for the Panarctic Flora Project. Det Norske Vitenskaps<br />
Akademi. I. Matematisk Naturvitenskapelig Klasse. Skrifter. Ny serie 38: 375386<br />
Elven, R., Murrey, D.F., Razzhiv<strong>in</strong>, V. & Yurtsev, B.A. 2007: Checklist for the<br />
Panarctic Flora (PAF): Vascular Plants. Draft Version. University of Oslo, Oslo<br />
Fox, J.F. 1992: Responses of diversity and growth form dom<strong>in</strong>ance <strong>to</strong> fertility <strong>in</strong><br />
Alaskan <strong>tundra</strong> fellfield communities. <strong>Arctic</strong> and Alp<strong>in</strong>e research 24:233237<br />
21
Franzèn, D. & Molau, U. 1999: Vascular <strong>plant</strong> diversity patterns <strong>in</strong> the Canadian<br />
<strong>Arctic</strong>. Polarforskn<strong>in</strong>gssekretariatets årsbok 1999: S<strong>to</strong>ckholm<br />
Gas<strong>to</strong>n, K.J, Blackburn, T.M, & Spicer, J.I. 1998: Rapoport’s rule: time for an<br />
epitaph? Trends <strong>in</strong> Ecology and Evolution 13: 7074<br />
Gough, L., Shaver, G.R., Carroll, J., Royer, D.L. & Laundre, J.A. 2000: Vascular <strong>plant</strong><br />
species richness <strong>in</strong> Alaskan arctic <strong>tundra</strong>: the importance of soil pH. Journal of<br />
Ecology 88: 5466<br />
Gould, W.A. & Walker, M.D. 1999: Plant communities and landscape diversity along<br />
a Canadian <strong>Arctic</strong> river. Journal of Vegetation Science 10: 537548<br />
Grace, J.B. 1999: The fac<strong>to</strong>rs controll<strong>in</strong>g species density <strong>in</strong> herbaceous <strong>plant</strong><br />
communities: an assessment. Perspectives <strong>in</strong> Plant Ecology, Evolution and<br />
Systematics 2: 128<br />
Grime, J.P. 1973: Control of species density <strong>in</strong> herbaceous vegetation. Journal of<br />
Environmental Management 1: 151–167<br />
Grytnes, J.A. 2002: F<strong>in</strong>escale vascular <strong>plant</strong> species richness <strong>in</strong> different alp<strong>in</strong>e<br />
vegetation types: relationships with biomass and cover. Journal of Vegetation<br />
Science 11:8792<br />
Hammer, Ø., Harper, D.A.T. & Ryan, P.D. 2001: PAST: Paleon<strong>to</strong>logical statistics<br />
software package for education and data analysis. Palaeon<strong>to</strong>logia Electronica 4: 9 pp<br />
Hooper, D.U., Chap<strong>in</strong>, F.S. III, Ewel, J.J., Hec<strong>to</strong>r, A., Inchausti, T., Lavorel, S.,<br />
Law<strong>to</strong>n, J.H., Lodge, D.M., Lorau, M., Naeem, S., Schmid, B., Setälä, H., Symstad,<br />
A.J., Vandermeer, J. & Wardle, D.A. 2005: Effects of biodiversity on ecosystem<br />
function<strong>in</strong>g: a consensus of current knowledge. Ecological Monographs 75: 335<br />
Hus<strong>to</strong>n, M.A. 1979: A general hypothesis of species diversity. American Naturalist<br />
113: 81–101<br />
Jonasson, S. 1992: Plant responses <strong>to</strong> fertilization and species removal <strong>in</strong> <strong>tundra</strong><br />
related <strong>to</strong>community structure and clonality. Oikos 63: 420429<br />
Kullman, L. 2000: Treelimit rise and recent warm<strong>in</strong>g: a geoecological case study<br />
from the Swedish Scandes. Norsk. geografisk Tidsskrift 54: 4959<br />
Körner, C. 2003: Alp<strong>in</strong>e <strong>plant</strong> life : functional <strong>plant</strong> <strong>ecology</strong> of high mounta<strong>in</strong><br />
ecosystems : Spr<strong>in</strong>ger Verlag, Berl<strong>in</strong><br />
Kruskal, W.H. & Wallis, W.A. 1952: Use of ranks <strong>in</strong> onecriterion variance analysis.<br />
Journal of the American Statistical Association 47: 583621<br />
L<strong>in</strong>dblad, K. 2007: Tundra Landscape Ecology – Diversity across scales. PhD thesis, Göteborg<br />
University. pp 48<br />
Marte<strong>in</strong>sdòttir, B. & Arnesen, G. 2006: Species richness of vascular <strong>plant</strong>s and<br />
cryp<strong>to</strong>gams <strong>in</strong> the High <strong>Arctic</strong>: no universal pattern observed <strong>in</strong> relation <strong>to</strong> primary<br />
productivity. Pp 1121 <strong>in</strong> Jònsdòttir, I.S. (ed), Explor<strong>in</strong>g <strong>plant</strong>ecological patterns at<br />
different spatial scales on <strong>Svalbard</strong>. <strong>Unis</strong> Publication Series 2006:1<br />
22
Michalet, R., Gandoy, C., Joud, D., Pages, J.P. & Choler, P. 2002: Plant community<br />
composition and biomass on calcareous and siliceous substrates <strong>in</strong> the northern<br />
French Alps: Comparative effects of soil chemistry and water status. <strong>Arctic</strong>,<br />
Antarctic and Alp<strong>in</strong>e Research 34: 102113<br />
Muc, M., Freedman, B. & Svoboda, J. 1989: Vascular <strong>plant</strong> communities of a <strong>polar</strong><br />
oasis at Alexandra Fiord (79 N), Ellesmere Island, Canada. Canadian Journal of<br />
Botany 67: 11261136<br />
Murray, D.F. 1997: Regional and local vascular <strong>plant</strong> diversity <strong>in</strong> the <strong>Arctic</strong>. Opera<br />
Botanica 132: 918<br />
Palmer, M.W. 1994: Variation <strong>in</strong> species richness: <strong>to</strong>wards a unification of<br />
hypotheses. Folia Geobotanica & Phy<strong>to</strong>taxonomica 29: 511–530<br />
Roem, W.J., Berendse, F. 2000: Soil acidity and nutrient supply ratio as possible<br />
fac<strong>to</strong>rs determ<strong>in</strong><strong>in</strong>g changes <strong>in</strong> <strong>plant</strong> species diversity <strong>in</strong> grassland and heathland<br />
communities. Biological Conservation 92: 151161<br />
Rohlf, F. 1999: NTSYSpc. Numerical taxonomy and multivariate analysis system.<br />
Exeter Software, New York<br />
Safronova, I.N. 1980: On the flora of Koteln'y Island (Novosibirsk Islands).<br />
Botanicheskiy Zhurnal 65: 544551. [In Russian]<br />
Safronova, I.N. 1983: Materials for the flora of Mebel and Hooker Islands (Franz<br />
Joseph Land). Botanicheskiy Zhurnal 68: 513518. [In Russian]<br />
Safronova, I.N. 1993: On the flora of Bolshevik Island (Severnaya Zemlya<br />
Archipelago). Botanicheskiy Zhurnal 78: 7984. [In Russian]<br />
Safronova, I.N. & Khodachek, E.A. 1989: On the flora and vegetation of Andrey,<br />
Uyed<strong>in</strong>eniya and Vize islands (northern <strong>Arctic</strong> Ocean). Botanicheskiy Zhurnal 74:<br />
10031011. [In Russian]<br />
Savile, D.B.O. 1959: The botany of Somerset Island, District of Frankl<strong>in</strong>. Canadian<br />
Journal of Botany 37: 9591002<br />
Savile, D.B.O. 1961: The botany of the northwestern Queen Elizabeth Islands.<br />
Canadian Journal of Botany 39: 909942<br />
Schofield, W.B. & Cody, W.J. 1955: Botanical <strong>in</strong>vestigations on coastal sourthern<br />
Cornwallis Island, Frankl<strong>in</strong> District, NTW. Canadian FieldNaturalist 69: 116128<br />
Soper, J.H. & Powell, J.M. 1985: Botanical studies <strong>in</strong> the Lake Hazon region, northern<br />
Ellesmere Island, Northwest Terri<strong>to</strong>ries, Canada. Canada National Museum of<br />
Natural Sciences Publications <strong>in</strong> Natural Sciences 5: 167<br />
Taylor, D.R., Aarssen, L.W. & Loehle, C. 1990: On the relationship between r/K<br />
selection and environmental carry capacity: a new habitat templet for <strong>plant</strong> life<br />
his<strong>to</strong>ry strategies. Oikos 58: 239–250<br />
Theodose , T.A. & Bowman, W.D. 1997: Nutrient availability, <strong>plant</strong> abundance, and<br />
species diversity <strong>in</strong> two alp<strong>in</strong>e <strong>tundra</strong> communities. Ecology 78: 18611872<br />
23
Tilman, D. 1982: Resource Competition and Community Structure. Pr<strong>in</strong>ce<strong>to</strong>n<br />
University Press, Pr<strong>in</strong>ce<strong>to</strong>n<br />
Truong, C. 2003: Ecology and genetics of the mounta<strong>in</strong> birch Betula pubescens ssp. <strong>to</strong>rtuosa at the limit<br />
of its geographical range <strong>in</strong> Northern Sweden: implication for treel<strong>in</strong>e ris<strong>in</strong>g <strong>in</strong> relation <strong>to</strong> climate<br />
change. Diploma Thesis, University of Neuchâtel, 56 pp<br />
Walker, M.D. 1995: Patterns and causes of arctic <strong>plant</strong> community diversity. Pp. 120<br />
<strong>in</strong> Chap<strong>in</strong>, F.S. III & Körner, C. (Eds). <strong>Arctic</strong> and Alp<strong>in</strong>e Biodiversity. Spr<strong>in</strong>ger<br />
Verlag, New York<br />
Walker, M. D., Wahren, H. C., Hollister R. D., Henry, G. H. R., Ahlquist, L. E.,<br />
Alatalo, J. M., BretHarte, S. M., Calef, M. P., Callaghan, T. V., Carroll, A. B.,<br />
Epste<strong>in</strong>, H. E., Jónsdóttir, I. S., Kle<strong>in</strong>, J. A., Magnússon, B., Molau, U., Oberbauer,<br />
S. F., Rewa S. P., Rob<strong>in</strong>son, C. H., Shaver, G. R., Sud<strong>in</strong>g, K. N., Thompson, , C.<br />
C., Tolvanen, A., Totland, Ø., Turner, P. L., Tweedie, C. E., Webber, P. J. &<br />
Wookey, P. A. 2006: Plant community responses <strong>to</strong> experimental warm<strong>in</strong>g across<br />
the <strong>tundra</strong> biome. Proceed<strong>in</strong>gs of the National Academy of Sciences of the Unites<br />
States of America 103, 13421346<br />
Wenche, E., Klanderud, K & Tommelstad, R. 2002: Plant community diversity at<br />
different scales <strong>in</strong> six localities on <strong>Svalbard</strong>. Pp 2240 <strong>in</strong> Jònsdòttir, I.S. (ed),<br />
Biodiversity <strong>in</strong> arctic <strong>plant</strong> communities. <strong>Unis</strong> Publication Series 2002:3<br />
van der Welle, M.E.W., Vermeulen, P.J., Shaver, G.R. & Berendse, F. 2003: Fac<strong>to</strong>rs<br />
determ<strong>in</strong><strong>in</strong>g <strong>plant</strong> species richness <strong>in</strong> Alaskan arctic <strong>tundra</strong>. Journal of Vegetation<br />
Science 14: 711720<br />
Young, S.B. 1971: The vascular flora of St. Lawrence Island with special reference <strong>to</strong><br />
floristic zonation <strong>in</strong> the arctic regions. Contributions from the Gray Herbarium 201:<br />
11115<br />
24
Appendix 1. Complete species lists from all sites. # means presens <strong>in</strong> the frames<br />
analysed at the site, * means po<strong>in</strong>t frame hit.<br />
1607/1/1; Kapp Thordsen; mesic heath; 8709800, 33X 0511516<br />
Alopecusus borealis Tr<strong>in</strong>.<br />
Arenaria pseudofrigida (Ostenf. & Dahl) Juz.<br />
*Bis<strong>to</strong>rta vivipara (L.) S.F.Gray<br />
Carex fulig<strong>in</strong>osa Schkuhr subsp. misandra (R.Br.) Nyman<br />
*Carex rupestris All.<br />
Cerastium arcticum Lange coll.<br />
Cochlearia groenlandica L. coll.<br />
#Draba fladnizensis Wulf.<br />
Draba lactea Adams<br />
Draba oxycarpa Sommerf.<br />
Draba subcapitata Simm.<br />
Dryas oc<strong>to</strong>petala L.<br />
#Equisetum arvense L. subsp. alpestre (Wahlenb.) Schönswetter & Elven<br />
*Equisetum variegatum Schleich. ex Weber & Mohr subsp. variegatum<br />
Juncus biglumis L.<br />
Luzula confusa L<strong>in</strong>deb.<br />
#Luzula nivalis (Laest.) Spreng.<br />
M<strong>in</strong>uartia rubella (Wahlenb.) Hiern<br />
Oxyria digyna (L.) Hill<br />
Papaver dahlianum Nordh. subsp. <strong>polar</strong>e (Tolm.) Elven & Ö.Nilsson<br />
Pedicularis dasyantha (Trautv.) Hadac<br />
*Pedicularis hirsuta L.<br />
Poa arctica R.Br.<br />
Potentilla pulchella R.Br. subsp. pulchella<br />
Pucc<strong>in</strong>ellia vahliana (Liebm.) Scribn. & Merr.<br />
Ranunculus sulphureus Sol.<br />
Sag<strong>in</strong>a nivalis (L<strong>in</strong>dbl.) Fr.<br />
*Salix <strong>polar</strong>is Wahlenb.<br />
Salix reticulata L.<br />
Saxifraga cespi<strong>to</strong>sa L. subsp. cespi<strong>to</strong>sa<br />
#Saxifraga hirculus L. subsp. compacta Hedberg<br />
*Saxifraga oppositifolia L. subsp. oppositifolia<br />
*Silene acaulis (L.) Jacq.<br />
Silene uralensis (Rupr.) Bocquet subsp. arctica (Th.Fr.) Bocquet<br />
*Stellaria longipes Goldie s.l.<br />
1607/1/2; Kapp Thordsen; calcarious fen, 8709858, 33X 0511838<br />
Alopecusus borealis Tr<strong>in</strong>.<br />
*Bis<strong>to</strong>rta vivipara (L.) S.F.Gray<br />
#Carex rupestris All.<br />
*Cerastium arcticum Lange coll.<br />
Cochlearia groenlandica L. coll.<br />
Coptidium lapponicum (L.) Tzvelev<br />
Coptidium x spitsbergense (Hadac) Elven<br />
*Equisetum arvense L. subsp. alpestre (Wahlenb.) Schönswetter & Elven<br />
Equisetum variegatum Schleich. ex Weber & Mohr subsp. variegatum<br />
25
Juncus biglumis L.<br />
Luzula confusa L<strong>in</strong>deb.<br />
Luzula nivalis (Laest.) Spreng.<br />
Oxyria digyna (L.) Hill<br />
*Pedicularis dasyantha (Trautv.) Hadac<br />
#Poa alp<strong>in</strong>a (L.) var. vivipara L.<br />
*Poa arctica R.Br.<br />
*Poa pratensis L. alpigena (Fr.) Hiit.<br />
Ranunculus sulphureus Sol.<br />
Ranunculus wilanderi (Nath.) Á.Löve & D.Löve<br />
*Salix <strong>polar</strong>is Wahlenb.<br />
Salix reticulata L.<br />
Saxifraga cespi<strong>to</strong>sa L. subsp. cespi<strong>to</strong>sa<br />
Saxifraga hieracifolia Waldst. & Kit. ex Willd. subsp. hieracifolia<br />
*Saxifraga hirculus L. subsp. compacta Hedberg<br />
*Saxifraga oppositifolia L. subsp. oppositifolia<br />
Saxifraga svalbardensis Øvstedal<br />
*Stellaria longipes Goldie s.l.<br />
1707/1/23; Mayerbreen; old mora<strong>in</strong>e area; 8800608, 33X 0440870<br />
*Cerastium arcticum Lange coll.<br />
Cochlearia groenlandica L. coll.<br />
#Draba alp<strong>in</strong>a L.<br />
*Draba corymbosa R.Br. ex DC.<br />
*Draba lactea Adams<br />
Draba oxycarpa Sommerf.<br />
*Luzula confusa L<strong>in</strong>deb.<br />
#Oxyria digyna (L.) Hill<br />
Papaver dahlianum Nordh. subsp. <strong>polar</strong>e (Tolm.) Elven & Ö.Nilsson<br />
*Poa alp<strong>in</strong>a (L.) var. vivipara L.<br />
*Poa arctica R.Br.<br />
*Poa pratensis L. alpigena (Fr.) Hiit.<br />
*Saxifraga cernua L.<br />
*Saxifraga cespi<strong>to</strong>sa L. subsp. cespi<strong>to</strong>sa<br />
*Saxifraga hyperborea R.Br.<br />
*Saxifraga nivalis L.<br />
*Stellaria longipes Goldie s.l.<br />
1707/2/1; Fjortende julibreen; birdcliff; 8786090, 33X 0439992<br />
Bis<strong>to</strong>rta vivipara (L.) S.F.Gray<br />
*Cerastium arcticum Lange coll.<br />
#Cerastium regelii Ostenf.<br />
Chrysosplenium tetrandrum (N. Lund) Th.Fr.<br />
#Cochlearia groenlandica L. coll.<br />
Draba corymbosa R.Br. ex DC.<br />
Draba nivalis Liljebl.<br />
*Draba norvegica Gunn.<br />
Erigeron humilis R.C.Graham<br />
Festuca rubra L. subsp. richardsonii (Hook.) Hultén<br />
Oxyria digyna (L.) Hill<br />
26
*Poa arctica R.Br.<br />
Potentilla hyparctica Malte subsp. hyparctica<br />
Ranunculus pygmaeus Wahlenb.<br />
*Salix <strong>polar</strong>is Wahlenb.<br />
Saxifraga cernua L.<br />
*Saxifraga cespi<strong>to</strong>sa L. subsp. cespi<strong>to</strong>sa<br />
*Saxifraga hieracifolia Waldst. & Kit. ex Willd. subsp. hieracifolia<br />
Saxifraga nivalis L.<br />
*Saxifraga oppositifolia L. subsp. oppositifolia<br />
*Silene acaulis (L.) Jacq.<br />
*Stellaria longipes Goldie s.l.<br />
Taraxacum brachycera<br />
s Dahlst.<br />
Trisetum spicatum (L.) K.Richt. subsp. spicatum<br />
1707/2/2; Fjortende julibreen; dry heath; 8786090, 33X 0433912<br />
*Cerastium arcticum Lange coll.<br />
Cerastium regelii Ostenf.<br />
Chrysosplenium tetrandrum (N.Lund) Th.Fr.<br />
Cochlearia groenlandica L. coll.<br />
Draba L. sp.<br />
Draba alp<strong>in</strong>a L.<br />
*Draba norvegica Gunn.<br />
Draba oxycarpa Sommerf.<br />
Luzula confusa L<strong>in</strong>deb.<br />
*Oxyria digyna (L.) Hill<br />
#Poa alp<strong>in</strong>a L. var. vivipara L.<br />
*Poa arctica R.Br.<br />
*Poa pratensis L. subsp. alpigena (Fr.) Hiit.<br />
Salix <strong>polar</strong>is Wahlenb.<br />
#Saxifraga cespi<strong>to</strong>sa L. subsp. cespi<strong>to</strong>sa<br />
Saxifraga hieracifolia Waldst. & Kit. ex Willd. subsp. hieracifolia<br />
Saxifraga oppositifolia L. subsp. oppositifolia<br />
Silene acaulis (L.) Jacq.<br />
Stellaria longipes Goldie s.l.<br />
#Taraxacum brachyceras Dahlst.<br />
1807/1/12; Biscayarhuken; dry heath; 8864496, 33X 0448709<br />
#Cardam<strong>in</strong>e bellidifolia L. subsp. bellidifolia<br />
*Cerastium arcticum Lange coll.<br />
*Cochlearia groenlandica L. coll.<br />
Draba corymbosa R.Br. ex DC.<br />
#Draba micropetala Hook.<br />
Draba subcapitata Simm.<br />
Luzula confusa L<strong>in</strong>deb.<br />
*Luzula nivalis (Laest.) Spreng.<br />
Oxyria digyna (L.) Hill<br />
Papaver dahlianum Nordh. subsp. <strong>polar</strong>e (Tolm.) Elven & Ö.Nilsson<br />
*Poa arctica R.Br.<br />
Potentilla hyparctica Malte subsp. hyparctica<br />
27
Pucc<strong>in</strong>ellia phryganodes (Tr<strong>in</strong>.) Scribn. & Merr. subsp. neoarctica<br />
Ranunculus pygmaeus Wahlenb.<br />
Ranunculus sulphureus Sol.<br />
*Salix <strong>polar</strong>is Wahlenb.<br />
#Saxifraga cespi<strong>to</strong>sa L. subsp. cespi<strong>to</strong>sa<br />
Saxifraga nivalis L.<br />
*Saxifraga rivularis L. subsp. rivularis<br />
*Silene acaulis (L.) Jacq.<br />
#Stellaria longipes Goldie s.l.<br />
Taraxacum arcticum (Trautv.) Dahlst.<br />
Trisetum spicatum (L.) K.Richt. subsp. spicatum<br />
1807/2/12; Re<strong>in</strong>sdyrflya; mesic heath; 8863020, 33X 0478260<br />
#Cardam<strong>in</strong>e bellidifolia L. subsp. bellidifolia<br />
*Cerastium arcticum Lange coll.<br />
*Cerastium regelii Ostenf.<br />
#Cochlearia groenlandica L. coll.<br />
*Draba corymbosa R.Br. ex DC.<br />
Draba fladnizensis Wulf.<br />
Draba oxycarpa Sommerf.<br />
*Draba subcapitata Simm.<br />
Equisetum variegatum Schleich. ex Weber & Mohr subsp. variegatum<br />
#Juncus biglumis L.<br />
Luzula confusa L<strong>in</strong>deb.<br />
*Luzula nivalis (Laest.) Spreng.<br />
M<strong>in</strong>uartia biflora (L.) Sch<strong>in</strong>tz. & Thell.<br />
*Oxyria digyna (L.) Hill<br />
Poa alp<strong>in</strong>a L. var. vivipara L.<br />
*Ranunculus pygmaeus Wahlenb.<br />
#Ranunculus sulphureus Sol.<br />
*Salix <strong>polar</strong>is Wahlenb.<br />
#Saxifraga cernua L.<br />
#Saxifraga cespi<strong>to</strong>sa L. subsp. cespi<strong>to</strong>sa<br />
*Saxifraga oppositifolia L. subsp. oppositifolia<br />
Saxifraga platysepala (Trautv.) Tolm.<br />
#Saxifraga tenuis (Wahlenb.) H.Sm.<br />
*Stellaria longipes Goldie s.l.<br />
1907/1/1; Florabukta, birdcliff; 8888054, 33X 0571330<br />
*Bis<strong>to</strong>rta vivipara (L.) S.F.Gray<br />
Cardam<strong>in</strong>e bellidifolia L. subsp. bellidifolia<br />
*Carex maritima Gunn. coll.<br />
*Cerastium arcticum Lange coll.<br />
Cerastium regelii Ostenf.<br />
*Cochlearia groenlandica L. coll.<br />
*Festuca rubra L. subsp. richardsonii (Hook.) Hultén<br />
Juncus biglumis L.<br />
#Luzula confusa L<strong>in</strong>deb.<br />
Luzula nivalis (Laest.) Spreng.<br />
M<strong>in</strong>uartia biflora (L.) Sch<strong>in</strong>tz. & Thell.<br />
28
*Poa arctica R.Br.<br />
Poa pratensis L. alpigena (Fr.) Hiit.<br />
Potentilla hyparctica Malte subsp. hyparctica<br />
*Ranunculus sulphureus Sol.<br />
Salix <strong>polar</strong>is Wahlenb.<br />
Saxifraga cespi<strong>to</strong>sa L. subsp. cespi<strong>to</strong>sa<br />
Saxifraga oppositifolia L. subsp. oppositifolia<br />
Saxifraga rivularis L. subsp. rivularis<br />
Stellaria humifusa Rottb.<br />
Stellaria longipes Goldie s.l.<br />
Taraxacum arcticum (Trautv.) Dahlst.<br />
1907/1/2; Florabukta; mesic heath; 8887920, 33X 0571369<br />
*Bis<strong>to</strong>rta vivipara (L.) S.F.Gray<br />
Cardam<strong>in</strong>e bellidifolia L. subsp. bellidifolia<br />
Carex maritima Gunn. coll.<br />
*Cerastium arcticum Lange coll.<br />
Cerastium regelii Ostenf.<br />
#Draba lactea Adams<br />
*Festuca rubra L. subsp. richardsonii (Hook.) Hultén<br />
*Luzula confusa L<strong>in</strong>deb.<br />
*Luzula nivalis (Laest.) Spreng.<br />
#M<strong>in</strong>uartia biflora (L.) Sch<strong>in</strong>tz. & Thell.<br />
#M<strong>in</strong>uartia rubella (Wahlenb.) Hiern<br />
Papaver dahlianum Nordh. subsp. <strong>polar</strong>e (Tolm.) Elven & Ö.Nilsson<br />
*Poa arctica R.Br.<br />
Potentilla hyparctica Malte subsp. hyparctica<br />
Ranunculus pygmaeus Wahlenb.<br />
#Ranunculus sulphureus Sol.<br />
*Salix <strong>polar</strong>is Wahlenb.<br />
*Saxifraga cernua L.<br />
*Saxifraga cespi<strong>to</strong>sa L. subsp. cespi<strong>to</strong>sa<br />
Saxifraga nivalis L.<br />
Saxifraga oppositifolia L. subsp. oppositifolia<br />
1907/1/3; Florabukta; <strong>polar</strong> <strong>desert</strong>; 8887344, 33X 0571431<br />
*Cerastium arcticum Lange coll.<br />
#Cochlearia groenlandica L. coll.<br />
#Draba subcapitata Simm.<br />
Juncus biglumis L.<br />
*Luzula nivalis (Laest.) Spreng.<br />
*M<strong>in</strong>uartia biflora (L.) Sch<strong>in</strong>tz. & Thell.<br />
#M<strong>in</strong>uartia rubella (Wahlenb.) Hiern<br />
#Papaver dahlianum Nordh. subsp. <strong>polar</strong>e (Tolm.) Elven & Ö.Nilsson<br />
#Poa hartzii Gand.<br />
#Potentilla hyparctica Malte subsp. hyparctica<br />
Pucc<strong>in</strong>ellia angustata (R.Br.) E.L.Rand & Redfield<br />
*Salix <strong>polar</strong>is Wahlenb.<br />
#Saxifraga cernua L.<br />
#Saxifraga cespi<strong>to</strong>sa L. subsp. cespi<strong>to</strong>sa<br />
29
#Saxifraga nivalis L.<br />
*Saxifraga oppositifolia L. subsp. oppositifolia<br />
#Saxifraga platysepala (Trautv.) Tolm.<br />
Saxifraga tenuis (Wahlenb.) H.Sm.<br />
2007/1/3; Lady Frankl<strong>in</strong>fjorden; mesic heath; 8901644, 33X 0587985<br />
#Cardam<strong>in</strong>e bellidifolia L. subsp. bellidifolia<br />
#Draba micropetala Hook.<br />
*Luzula confusa L<strong>in</strong>deb.<br />
#Papaver dahlianum Nordh. subsp. <strong>polar</strong>e (Tolm.) Elven & Ö.Nilsson<br />
#Saxifraga cernua L.<br />
Saxifraga foliolosa R.Br.<br />
Saxifraga rivularis L. subsp. rivularis<br />
*Stellaria longipes Goldie s.l.<br />
2107/1/3; Ossian Sarsfjellet; mesic heath; 8762902, 33X 0445660<br />
Arenaria pseudofrigida (Ostenf. & Dahl) Juz.<br />
#Bis<strong>to</strong>rta vivipara (L.) S.F.Gray<br />
Carex fulig<strong>in</strong>osa Schkuhr subsp. misandra (R.Br.) Nyman<br />
Carex nard<strong>in</strong>a Fr. subsp. hepburnii (Boott) Á.Löve, D.Löve & B.M.Kapoor<br />
*Carex rupestris All.<br />
*Cassiope tetragona (L.) D.Don subsp. tetragona<br />
*Dryas oc<strong>to</strong>petala L.<br />
#Luzula nivalis (Laest.) Spreng.<br />
*Salix <strong>polar</strong>is Wahlenb.<br />
Saxifraga cernua L.<br />
*Saxifraga oppositifolia L. subsp. oppositifolia<br />
*Silene acaulis (L.) Jacq.<br />
Trisetum spicatum (L.) K.Richt. subsp. spicatum<br />
2107/2/12; Ossian Sarsfjellet; birdcliff; 8763388, 33X 0445378<br />
Arenaria pseudofrigida (Ostenf. & Dahl) Juz.<br />
*Bis<strong>to</strong>rta vivipara (L.) S.F.Gray<br />
Carex maritima Gunn. coll.<br />
*Cerastium arcticum Lange coll.<br />
*Cerastium regelii Ostenf.<br />
Chrysosplenium tetrandrum (N.Lund) Th.Fr.<br />
Cochlearia groenlandica L. coll.<br />
*Comas<strong>to</strong>ma tenellum (Rottb.) Toyok.<br />
Deschampsia alp<strong>in</strong>a (L.) Roem & Schultes<br />
Draba arctica J.Vahl subsp. arctica<br />
#Draba glabella Pursh<br />
Draba norvegica Gunn.<br />
Dryas oc<strong>to</strong>petala L.<br />
*Erigeron humilis R.C.Graham<br />
*Euphrasia wettste<strong>in</strong>ii G.Gussarova<br />
*Festuca rubra L. subsp. richardsonii (Hook.) Hultén<br />
Oxyria digyna (L.) Hill<br />
*Poa alp<strong>in</strong>a L. var. vivipara L.<br />
*Poa arctica R.Br.<br />
30
*Poa glauca J.Vahl.<br />
*Poa pratensis L. alpigena (Fr.) Hiit.<br />
*Potentilla hyparctica Malte subsp. hyparctica<br />
Potentilla pulchella R.Br. subsp. pulchella<br />
*Ranunculus aff<strong>in</strong>is R.Br.<br />
*Salix <strong>polar</strong>is Wahlenb.<br />
*Saxifraga cernua L.<br />
#Saxifraga cespi<strong>to</strong>sa L. subsp. cespi<strong>to</strong>sa<br />
Saxifraga hieracifolia Waldst. & Kit. ex Willd. subsp. hieracifolia<br />
Saxifraga oppositifolia L. subsp. oppositifolia<br />
#Silene acaulis (L.) Jacq.<br />
Silene <strong>in</strong>volucrata (Cham. & Schltdl.) Bocquet subsp. furcata (Raf.) V.V.Petrovsky &<br />
Elven<br />
Silene uralensis (Rupr.) Bocquet subsp. arctica (Th.Fr.) Bocquet<br />
*Stellaria longipes Goldie s.l.<br />
*Taraxacum brachyceras Dahlst.<br />
#Trisetum spicatum (L.) K.Richt. subsp. spicatum<br />
2207/1/15; Colesdalen; mesic heath; 8670162, 33X 0502830<br />
*Alopecusus borealis Tr<strong>in</strong>.<br />
*Betula nana L. subsp. <strong>tundra</strong>rum (Perfil.) Á.Löve & D.Löve<br />
#Bis<strong>to</strong>rta vivipara (L.) S.F.Gray<br />
Campanula rotundifolia L. subsp. gieseckiana (Vest) Mela & Cajander<br />
#Cardam<strong>in</strong>e bellidifolia L. subsp. bellidifolia<br />
Cassiope tetragona (L.) D.Don subsp. tetragona<br />
*Cerastium arcticum Lange coll.<br />
*Cerastium arcticum x regelii<br />
*Dryas oc<strong>to</strong>petala L.<br />
*Equisetum arvense L. subsp. alpestre (Wahlenb.) Schönswetter & Elven<br />
*Euphrasia wettste<strong>in</strong>ii G.Gussarova<br />
*Festuca rubra L. subsp. richardsonii (Hook.) Hultén<br />
*Hierochloe alp<strong>in</strong>a (Sw.) Roem. & Schult. subsp. alp<strong>in</strong>a<br />
Koeniga islandica L.<br />
*Luzula confusa L<strong>in</strong>deb.<br />
Luzula nivalis (Laest.) Spreng.<br />
#M<strong>in</strong>uartia rubella (Wahlenb.) Hiern<br />
*Pedicularis hirsuta L.<br />
#Poa alp<strong>in</strong>a L. var. vivipara L.<br />
*Poa arctica R.Br.<br />
*Salix <strong>polar</strong>is Wahlenb.<br />
#Saxifraga hieracifolia Waldst. & Kit. ex Willd. subsp. hieracifolia<br />
Saxifraga svalbardensis Øvstedal<br />
*Stellaria longipes Goldie s.l.<br />
Trisetum spicatum (L.) K.Richt. subsp. spicatum<br />
*Vacc<strong>in</strong>ium ulig<strong>in</strong>osum L. subsp. microphyllum Lange<br />
2207/1/6; Colesdalen; mire; 8670038, 33X 0502916<br />
*Alopecusus borealis Tr<strong>in</strong>.<br />
*Bis<strong>to</strong>rta vivipara (L.) S.F.Gray<br />
*Cerastium arcticum x regelii<br />
31
*Coptidium lapponicum (L.) Tzvelev<br />
Coptidium x spitsbergense (Hadac) Elven<br />
#Dupotia fisheri R.Br.<br />
*Equisetum arvense L. subsp. alpestre (Wahlenb.) Schönswetter & Elven<br />
#Eriophorum scheuchzeri Hoppe subsp. arcticum Novoselova<br />
*Euphrasia wettste<strong>in</strong>ii G.Gusarova<br />
*Luzula confusa L<strong>in</strong>deb.<br />
#Luzula nivalis (Laest.) Spreng.<br />
#Pedicularis hirsuta L.<br />
*Poa arctica R.Br.<br />
*Ranunculus hyperboreus Rottb. subsp. arnellii Scheutz<br />
*Salix <strong>polar</strong>is Wahlenb.<br />
#Saxifraga foliolosa R.Br.<br />
#Saxifraga hieracifolia Waldst. & Kit. ex Willd subsp. hieracifolia<br />
*Saxifraga svalbardensis Øvstedal<br />
32
Life <strong>in</strong> the <strong>Arctic</strong> – a struggle for survival?<br />
Simone Lang 1 , Merete Wiken Dees 2 and Kathr<strong>in</strong> Bockmühl 3<br />
1 Systems Ecology, Faculteit der Aard en Levenswetensschappen, Vrije Universiteit Amsterdam, De<br />
Boelelaan 1085, NL1081 HV Amsterdam, The Netherlands, simone.lang@<strong>ecology</strong>.falw.vu.nl,<br />
2 Institutt for <strong>plant</strong>e og miljøvitenskap, Universitetet for miljø og biovitenskap, NO1432 Ås, Norway,<br />
mwdees@student.umb.no, 3 Department of biology, University of Bergen, Allégaten 41, NO5001<br />
Bergen, Norway, kathr<strong>in</strong>.bockmuhl@student.uib.no<br />
Abstract<br />
Are widespread <strong>plant</strong>s <strong>in</strong> the <strong>Arctic</strong> widespread due <strong>to</strong> their wide ecological amplitude<br />
or due <strong>to</strong> a widespread habitat? To address this question, ecological amplitudes of<br />
<strong>plant</strong> species across the <strong>Arctic</strong> were <strong>in</strong>vestigated. Vascular <strong>plant</strong> species composition<br />
and abiotic fac<strong>to</strong>rs were recorded <strong>in</strong> 88 plots at 29 sites <strong>in</strong> 10 different regions on<br />
<strong>Svalbard</strong>. For each species the ecological amplitude was recorded accord<strong>in</strong>g <strong>to</strong> Raups<br />
study carried out at Mesters Vig on North East Greenland <strong>in</strong> 1969. The ecological<br />
amplitudes of <strong>plant</strong> species occurr<strong>in</strong>g on both <strong>Svalbard</strong> and Mesters Vig district were<br />
compared. Some differences were found, but this was not the case when <strong>Svalbard</strong> was<br />
compared <strong>to</strong> the entire Greenland. pH and bioclimatic zones proved <strong>to</strong> be the driv<strong>in</strong>g<br />
fac<strong>to</strong>rs for <strong>plant</strong> distribution on <strong>Svalbard</strong>. The thermophilic annual Euphrasia<br />
wettste<strong>in</strong>ii seems <strong>to</strong> be a sensitive <strong>in</strong>dica<strong>to</strong>r for current climate change scenarios. Our<br />
study showed that widespread taxa do not au<strong>to</strong>matically possess wide amplitudes on<br />
<strong>Svalbard</strong> and vice versa.<br />
Introduction<br />
Climate change at high latitudes is predicted <strong>to</strong> be greater and more rapid than <strong>in</strong> any<br />
other region on Earth. Accord<strong>in</strong>g <strong>to</strong> the (ACIA 2006) not only will temperatures<br />
change (Przybylak 2007) but also precipitation is expected <strong>to</strong> <strong>in</strong>crease <strong>in</strong> wide regions<br />
<strong>in</strong> the <strong>Arctic</strong>. Recent observations and experimental studies have supplied evidence<br />
that arctic <strong>plant</strong>s and ecosystems react substantially <strong>to</strong> ris<strong>in</strong>g temperatures (Walker et<br />
al. 2006). Increas<strong>in</strong>g temperatures and ra<strong>in</strong>fall might <strong>in</strong>duce permafrost melt<strong>in</strong>g,<br />
lead<strong>in</strong>g <strong>to</strong> a changed hydrology and unstable substrates.<br />
<strong>Arctic</strong> <strong>plant</strong>s are exposed <strong>to</strong> extreme amplitudes of environmental fac<strong>to</strong>rs: early snow<br />
and frost, drought, w<strong>in</strong>d abrasion and extreme temperatures on open patches (Bill<strong>in</strong>gs<br />
& Mooney 1968). Slope <strong>in</strong>stability can occur as s<strong>to</strong>chastic mass flows as well as slow<br />
cont<strong>in</strong>uous process, depend<strong>in</strong>g upon the geomorphic circumstances. Low temperature<br />
and short grow<strong>in</strong>g seasons result <strong>in</strong> vegetation dom<strong>in</strong>ated by longlived perennials<br />
that reproduce through vegetative growth, while annuals are rare (Bill<strong>in</strong>gs & Mooney<br />
1968, Savile 1972). The flora of <strong>Svalbard</strong> consists of about 170 flower<strong>in</strong>g <strong>plant</strong><br />
species and only two of those are annual species: the cold <strong>to</strong>lerant Koenigia islandica<br />
and the rare, thermophilic hemiparasitic species Euphrasia wettste<strong>in</strong>ii (Brochmann &<br />
Steen 1999). Euphrasia wettste<strong>in</strong>ii occurs at its northern limit on <strong>Svalbard</strong>.<br />
Thermophilic annuals may be good <strong>in</strong>dica<strong>to</strong>rs for climate change due <strong>to</strong> their short<br />
33
esponse curve. With ris<strong>in</strong>g temperatures an <strong>in</strong>crease <strong>in</strong> population size can be<br />
expected.<br />
What are the limits for <strong>plant</strong> distribution <strong>in</strong> the <strong>Arctic</strong>? Various biotic and abiotic<br />
fac<strong>to</strong>rs such as temperature and moisture regimes, nutrient supply, competition,<br />
dispersal limitation, seedl<strong>in</strong>g survival, <strong>to</strong> name only a few, restrict <strong>plant</strong> life <strong>in</strong> the<br />
<strong>Arctic</strong>. Yet can we conclude a ‘struggle for survival’ or are we observ<strong>in</strong>g rather well<br />
adapted <strong>plant</strong> species be<strong>in</strong>g able <strong>to</strong> withstand extremely harsh conditions? Alsos et al.<br />
(2007) showed that dispersal of <strong>plant</strong>s is not a limit<strong>in</strong>g fac<strong>to</strong>r <strong>in</strong> the <strong>Arctic</strong>. A variety<br />
of studies on ecological amplitudes of <strong>plant</strong> species has been conducted <strong>in</strong> various<br />
parts of the <strong>Arctic</strong> and elsewhere (Coudun & Gegout 2005, Saetersdal & Birks 1997).<br />
Karlsen & Elvebakk (2003) grouped species <strong>in</strong> Greenland accord<strong>in</strong>g <strong>to</strong> their m<strong>in</strong>imum<br />
temperature and soil pH preferences. Are ecological amplitudes derived from such<br />
studies applicable across the <strong>Arctic</strong>? Ellenbergs (Ellenberg et al. 1991) <strong>in</strong>dica<strong>to</strong>r<br />
values, be<strong>in</strong>g developed for middle Europe <strong>in</strong>clud<strong>in</strong>g the Alps, needed <strong>to</strong> be modified<br />
when applied <strong>to</strong> other regions such as England (Hill et al. 2000). The same situation<br />
may arise when compar<strong>in</strong>g <strong>plant</strong> taxa occurr<strong>in</strong>g at different locations <strong>in</strong> the <strong>Arctic</strong>.<br />
Raup (1969) conducted a study of <strong>plant</strong> behaviour at Mester Vig, North East<br />
Greenland where he <strong>in</strong>vestigated the effects of disturbance, moisture and <strong>to</strong>tal <strong>plant</strong><br />
cover on <strong>plant</strong> distribution. No attempt has been made <strong>to</strong> replicate his study <strong>in</strong> other<br />
parts of the <strong>Arctic</strong> compar<strong>in</strong>g the ecological amplitudes of the same <strong>plant</strong> taxa. If we<br />
are <strong>to</strong> understand, generalise and model <strong>plant</strong> responses <strong>to</strong> climate change we will<br />
need <strong>to</strong> identify their ecological amplitudes <strong>in</strong> response <strong>to</strong> numerous biotic and abiotic<br />
fac<strong>to</strong>rs at a multitude of locations <strong>in</strong> the <strong>Arctic</strong>.<br />
In this study we attempt <strong>to</strong> assess the ecological amplitudes of arctic vascular <strong>plant</strong><br />
species on <strong>Svalbard</strong> <strong>in</strong> terms of their site fac<strong>to</strong>rs such as substrate, moisture,<br />
disturbance and temperature range. <strong>Svalbard</strong> is especially suitable for this study s<strong>in</strong>ce<br />
it covers three <strong>Arctic</strong> bioclimatic zones from <strong>polar</strong> <strong>desert</strong>s <strong>in</strong> zone A with extremely<br />
low productivity <strong>to</strong> relatively productive <strong>tundra</strong> <strong>in</strong> zone C. In addition, a great variety<br />
of substrates and geomorphological processes facilitates a record<strong>in</strong>g of species at their<br />
ecological optimum and also at their extremes (Jónsdóttir 2005). We furthermore<br />
compare the amplitudes of the species found both on <strong>Svalbard</strong> and the Mesters Vig<br />
District <strong>in</strong> Greenland accord<strong>in</strong>g <strong>to</strong> Raup’s record<strong>in</strong>g method.<br />
In our study we address the follow<strong>in</strong>g questions:<br />
1. Are widespread <strong>plant</strong>s <strong>in</strong> the <strong>Arctic</strong> widespread due <strong>to</strong> their wide ecological<br />
amplitude or due <strong>to</strong> a widespread habitat?<br />
1. Do the same species from <strong>Svalbard</strong> and Greenland on similar landscapes differ<br />
<strong>in</strong> their ecological amplitude?<br />
2. Will the thermophilic species Euphrasia wettste<strong>in</strong>ii expand its range if the<br />
mean July isotherme <strong>in</strong>creases by 1 degree Kelv<strong>in</strong>?<br />
Methods<br />
Study area<br />
<strong>Svalbard</strong> is an archipelago situated <strong>in</strong> the High <strong>Arctic</strong> at 74/81°N and 10/30°E. Ten<br />
localities along the northwest coast of Spitsbergen and the westcoast of<br />
34
Nordaustlandet (7880°N) were studied dur<strong>in</strong>g the period of 16.22. July 2007 (Figure<br />
1). The localities covered the three bioclimatic zones of <strong>Svalbard</strong> accord<strong>in</strong>g <strong>to</strong><br />
Elvebakk (Elvebakk 1999, Elvebakk 2005) <strong>in</strong>clud<strong>in</strong>g a wide variety of habitats. Two<br />
of the sites were located <strong>in</strong> zone A, four were located <strong>in</strong> zone B and four <strong>in</strong> zone C<br />
(Table 1). Zone A, B and C represent the arctic <strong>polar</strong> <strong>desert</strong> zone, the northern arctic<br />
<strong>tundra</strong> zone and the middle arctic <strong>tundra</strong> zone, respectively.<br />
Table 1. Bioclimatic zones, general vegetation and bedrock type for the regions <strong>in</strong> <strong>Svalbard</strong><br />
assessed <strong>in</strong> the study.<br />
Region Bioclimatic<br />
zone<br />
Site<br />
(# of<br />
plots)<br />
General<br />
vegetation<br />
35<br />
Site<br />
description<br />
Bedrock pH1<br />
Lady<br />
1 (3) 5,25<br />
Frankl<strong>in</strong>fjorden A 2 (3) Luzula confusa Polar <strong>desert</strong> Acidic 5,27<br />
3 (3)<br />
5,47<br />
1 (3)<br />
5,45<br />
Florabukta B (A)2<br />
Mesic Luzula Underneath Alkal<strong>in</strong>e<br />
nivalis Bird cliff circumneutral<br />
2 (3) Next <strong>to</strong><br />
Bird cliff<br />
6,21<br />
3 (3)<br />
Polar <strong>desert</strong><br />
7,90<br />
1 (5) Young<br />
6,53<br />
Mayerbreen B<br />
Mesic Luzula mora<strong>in</strong>e Acidic<br />
2 (3) confusa Old mora<strong>in</strong>e<br />
6,73<br />
3 (4)<br />
6,93<br />
Fjortende<br />
1 (3) Bird cliff Acidic 7,16<br />
Julibreen B 2 (3)<br />
7,06<br />
1 (3) Hill, north<br />
5,46<br />
Biscayarhuken B<br />
Mesic Luzula fac<strong>in</strong>g slope Acidic<br />
2 (2) confusa Hill, south<br />
fac<strong>in</strong>g slope<br />
5,46<br />
1 (3) Poa alp<strong>in</strong>a Snow bed Sligthly acidic 6,10<br />
Re<strong>in</strong>sdyrsflya B 2 (3)<br />
6,51<br />
1 (3) Mesic Dryas Heath Weakly acidic 7,33<br />
Kapp Thordsen C 2 (3) Calcarious fens 6,48<br />
1 (3)<br />
8,31<br />
Kongsbreen C<br />
Cassiope Very young Acidic <strong>to</strong><br />
tetragona mora<strong>in</strong>e alkal<strong>in</strong>e<br />
2 (3) Intermediate<br />
mora<strong>in</strong>e<br />
cirucumneutral 8,41<br />
3 (3)<br />
Established<br />
vegetation<br />
7,92<br />
1 (2) Luzula confusa Underneath Acidic <strong>to</strong> 7,78<br />
Ossian Sars C 2 (2)<br />
bird cliff alkal<strong>in</strong>e<br />
cirucumneutral<br />
7,99<br />
1 (4) 5,84<br />
C 2 (4) Dryas Heath<br />
5,75<br />
3 (4) Cassiope<br />
5,72<br />
Colesdalen<br />
4 (4) tetragona<br />
Weakly acidic 5,57<br />
5 (2)<br />
5,41<br />
6 (4)<br />
Fen<br />
5,71<br />
1<br />
pH was measured <strong>in</strong> this study<br />
2<br />
At the border between A and B
N<br />
Biscayarhuken<br />
Florabukta<br />
Re<strong>in</strong>sdyrsflya<br />
Mayerbreen<br />
Fjortende Julibreen<br />
Ossian Sars<br />
Kongsbreen<br />
Kapp Thordsen<br />
Colesdalen<br />
Figure 1. Map of <strong>Svalbard</strong> show<strong>in</strong>g the sampl<strong>in</strong>g sites.<br />
36<br />
Lady Frankl<strong>in</strong>fjorden
The percentage area of different substrate types of <strong>Svalbard</strong> was estimated by means<br />
of the prelim<strong>in</strong>ary substrate map of <strong>Svalbard</strong> (Arnesen, personal communication)<br />
us<strong>in</strong>g GIPM Version 2.2.1.1. The pixels of each substrate category were counted and<br />
expressed as percentage area <strong>in</strong> relation <strong>to</strong> the pixel sum of entire <strong>Svalbard</strong>. The<br />
dom<strong>in</strong>ant substrate type is weakly acidic and covers 14.1% of entire <strong>Svalbard</strong>. Acidic<br />
substrates cover 6.1%, followed by the alkal<strong>in</strong>e circumneutral type with 5.4%. The<br />
rema<strong>in</strong><strong>in</strong>g substrate consists of sediments (3.6%), sal<strong>in</strong>e steppe substrate (0.1%) and<br />
undef<strong>in</strong>ed substrate (0.2%). <strong>Svalbard</strong> is dom<strong>in</strong>ated by glaciers occupy<strong>in</strong>g 67.5% of<br />
the surface area.<br />
Meteorological data<br />
Data from the meteorological station at <strong>Svalbard</strong> Airport (MET 2007) were used <strong>to</strong><br />
calculate the <strong>in</strong>crease <strong>in</strong> mean summer temperatures for the last ten years (1997<br />
2007). Figure 2 shows a simplified model of the temperature data us<strong>in</strong>g a l<strong>in</strong>ear<br />
regression. In the period 19972007 mean summer temperatures <strong>in</strong>creased with a rate<br />
of 0.16 K per year. As a comparison the mean summer temperature of the last normal<br />
period (19611990) is <strong>in</strong>cluded <strong>in</strong> the diagram.<br />
Degrees Celsius<br />
7<br />
6<br />
5<br />
4<br />
3<br />
2<br />
1<br />
0<br />
1997<br />
1998<br />
Mean summer temperature at <strong>Svalbard</strong> Airport<br />
1999<br />
2000<br />
2001<br />
2002<br />
2003<br />
2004<br />
37<br />
2005<br />
2006<br />
2007<br />
Mean temperatures<br />
Regression model<br />
Mean summer temperature<br />
19611990<br />
Figure 2. Mean summer (June, July and august) temperature at <strong>Svalbard</strong> airport (R 2 = 0.52).<br />
Study species<br />
The annual thermophilic Euphrasia wettste<strong>in</strong>ii G.Gusarova belongs <strong>to</strong> the family<br />
Scrophulariaceae. The species was earlier treated as E. frigida Pugsley (PAF 2007).<br />
Euphrasia wettste<strong>in</strong>ii is a root hemiparasite, but it is still unclear which hosts the<br />
<strong>Svalbard</strong>populations are parasitis<strong>in</strong>g (Alsos et al. 2004). Some hemiparasites are<br />
reported with only one host. However, E. wettste<strong>in</strong>ii is found physically connected <strong>to</strong><br />
a variety of hosts or it may grow unconnected <strong>to</strong> a host (Seel & Press 1993).<br />
Euphrasia wettste<strong>in</strong>ii is ma<strong>in</strong>ly selfpoll<strong>in</strong>at<strong>in</strong>g. The <strong>plant</strong>s are found <strong>in</strong> closed <strong>plant</strong><br />
communites, therefore open<strong>in</strong>gs <strong>in</strong> the cover are needed <strong>to</strong> expose the soil and provide<br />
a seed bed. Some disturbance which causes small open patches <strong>in</strong> the growth sites is<br />
needed for establishment of the seeds (Molau 1993, Seel & Press 1993). Reproduc<strong>in</strong>g<br />
by seeds may be of advantage <strong>to</strong> survive unfavourable w<strong>in</strong>ter times, but a long series
of cold summers can be term<strong>in</strong>al for a population of Euphrasia depend<strong>in</strong>g on their<br />
seed longevity which may only last for a few years.<br />
Euphrasia wettste<strong>in</strong>ii was first recorded near the hot spr<strong>in</strong>g <strong>in</strong> Bockfjord (Rønn<strong>in</strong>g<br />
1961). In 1998 one patch of E. wettste<strong>in</strong>ii was discovered <strong>in</strong> Colesdalen (Alsos et al.<br />
2004) and one at Ossian Sars five years later (Alsos). In 2002 a detailed <strong>in</strong>vestigation<br />
of the flora <strong>in</strong> Colesdalen was carried out and n<strong>in</strong>e patches of E. wettste<strong>in</strong>ii were<br />
discovered. All the patches except two were less than 2 m 2 . E. wettste<strong>in</strong>ii is assigned<br />
<strong>to</strong> the Red List category endangered (Bakken et al. 2006).<br />
Vegetation data<br />
Two <strong>to</strong> six sites were selected with<strong>in</strong> each of the ten localities and a <strong>to</strong>tal of 88 plots<br />
were chosen among sites. The plots were randomly chosen for unbiased application of<br />
plot sampl<strong>in</strong>g. Exceptions from the random selection of plots were the Euphrasia<br />
sites on Ossian Sars and Colesdalen. The plots <strong>in</strong> these two regions were subjectively<br />
selected <strong>to</strong> <strong>in</strong>clude patches of E. wettste<strong>in</strong>ii. The size of the entire patch of E.<br />
wettste<strong>in</strong>ii at Ossian Sars was 1m x 2m. Thus only two plots with and two without E.<br />
wettste<strong>in</strong>ii were recorded. Ten plots with E. wettste<strong>in</strong>ii and ten exclud<strong>in</strong>g the species<br />
were assessed <strong>in</strong> Colesdalen. The po<strong>in</strong>t <strong>in</strong>tercept method was used <strong>to</strong> record the<br />
vascular species with<strong>in</strong> each plot (Bråthen & Hagberg 2004). At each site, 50 cm x 50<br />
cm plots with 25 po<strong>in</strong>ts of equal <strong>in</strong>tercepts of 10 cm were used. All vascular <strong>plant</strong>s<br />
<strong>to</strong>uched by the needle at each po<strong>in</strong>t were recorded. Each taxon was counted only once<br />
at any one po<strong>in</strong>t. Two <strong>to</strong> four replicate plots per site were recorded <strong>to</strong> obta<strong>in</strong> an<br />
adequate representation of the community. Additional species <strong>in</strong> the plot were<br />
recorded and counted as 0.5 hits. The <strong>to</strong>tal vegetation cover <strong>in</strong> the plots was estimated<br />
<strong>in</strong> percent vascular <strong>plant</strong> cover, bryophyte cover, lichen cover, bare ground/rocks and<br />
cryp<strong>to</strong>gram crust cover. The black and white cryp<strong>to</strong>gam crust consisted of a mixture<br />
of cyanobacteria, white crus<strong>to</strong>se lichens and a few m<strong>in</strong>ute bryophytes. Species names<br />
of the vascular <strong>plant</strong>s followed PAF (2007).<br />
A distribution estimate for each species was calculated <strong>to</strong> test whether species are<br />
truly widespread on <strong>Svalbard</strong>. <strong>Svalbard</strong> is divided <strong>in</strong> 26 districts. For the species<br />
encountered <strong>in</strong> the field a count per district was carried out us<strong>in</strong>g the <strong>Svalbard</strong><br />
database (Alsos, personal communication). The <strong>Svalbard</strong> database <strong>in</strong>cludes all<br />
specimens recorded <strong>in</strong> Norwegian herbaria as well as a list of species for particular<br />
sites. The count per district was used as a distribution estimate of each species. Poa<br />
alp<strong>in</strong>a var. vivipara and P. alp<strong>in</strong>a var. alp<strong>in</strong>a were comb<strong>in</strong>ed <strong>to</strong> P. alp<strong>in</strong>a. The<br />
northernmost distribution limit was based on P. alp<strong>in</strong>a var. vivipara which extends<br />
further north. In the district count of Poa arctica both P. arctica ssp. caespitans and<br />
P. arctica var. vivipara were <strong>in</strong>cluded.<br />
Abiotic data<br />
Abiotic data were assessed per plot. Organic soil depth was measured and divided <strong>in</strong><strong>to</strong><br />
the three categories of low (02 cm), medium (25 cm) and high (>5 cm) organic soil<br />
depth. Permafrost measurements could not be consistently taken at all sites and were<br />
therefore not <strong>in</strong>cluded <strong>in</strong> the analysis. Soil temperature was measured at 10 cm soil<br />
depth us<strong>in</strong>g a handheld digital thermometer. Slope and exposure of the plots were<br />
assessed us<strong>in</strong>g a compass. For pH measurements soil samples were taken from the<br />
uppermost 5 cm of the soil regardless of organic or m<strong>in</strong>eral orig<strong>in</strong> s<strong>in</strong>ce this layer<br />
constitutes the ma<strong>in</strong> root<strong>in</strong>g zone for the <strong>plant</strong>s. The samples were kept cool and<br />
38
processed with<strong>in</strong> 24 hours. Equal amounts <strong>in</strong> volume of both soil and deionised water<br />
were mixed <strong>in</strong> a flask. After repeated shak<strong>in</strong>g for 1 hour, pH was measured by us<strong>in</strong>g<br />
an electronic pHmeter. The pH values were divided <strong>in</strong><strong>to</strong> three categories of low (<<br />
5.2), medium (5.27.0) and high (> 7.0) pH. This division corresponds <strong>to</strong> Karlsen and<br />
Elvebakk (2003). The def<strong>in</strong>ition of substrates follows the prelim<strong>in</strong>ary substrate map<br />
of <strong>Svalbard</strong> (Arnesen, personal communication). Raup did not <strong>in</strong>clude pH<br />
measurements <strong>in</strong> his study at the Mesters Vig district. Data from Karlsen & Elvebakk<br />
(2003) were used for the <strong>Svalbard</strong> Greenland comparison.<br />
The soil moisture with<strong>in</strong> each plot was assessed accord<strong>in</strong>g <strong>to</strong> Raup (1969) by feel<strong>in</strong>g<br />
the soil with the f<strong>in</strong>gers. Follow<strong>in</strong>g categories were used:<br />
1. low (dry, no feel<strong>in</strong>g of dampness <strong>to</strong> the f<strong>in</strong>gers)<br />
2. medium (moist, wet the f<strong>in</strong>gers when handled)<br />
3. high (wet, water can be squeezed from the soil)<br />
4. very high (wet, water is freely dripp<strong>in</strong>g from soil sample)<br />
The disturbance gradient was separated <strong>in</strong><strong>to</strong> two categories established by Raup<br />
(1969). He dist<strong>in</strong>guished between frost disturbance (sorted or nonsorted circles) and<br />
nonfrost disturbance (erosion, slope <strong>in</strong>stability). Although be<strong>in</strong>g a frost<strong>in</strong>itiated<br />
process, Raup <strong>in</strong>cluded solifluction <strong>in</strong><strong>to</strong> the nonfrost disturbance processes s<strong>in</strong>ce<br />
<strong>plant</strong> roots are located <strong>in</strong> the upper layer of the slid<strong>in</strong>g soil and thus not disturbed by<br />
the slow soil movement. The categories for both frost and nonfrost disturbance were<br />
divided <strong>in</strong><strong>to</strong>:<br />
1. stable (no visual disturbance, no bare ground)<br />
2. medium (bare ground visible <strong>in</strong>dicat<strong>in</strong>g cryoturbation and enabl<strong>in</strong>g erosion)<br />
3. unstable (bare ground dom<strong>in</strong>at<strong>in</strong>g, active cryoturbation or erosion, no<br />
consolidation of soil recognisable)<br />
Statistical analysis<br />
To f<strong>in</strong>d the ma<strong>in</strong> abiotic fac<strong>to</strong>rs determ<strong>in</strong><strong>in</strong>g species distribution, a DCA, CA and<br />
CCA ord<strong>in</strong>ation were carried out us<strong>in</strong>g Canoco (Canoco for W<strong>in</strong>dows 4.5, 1999). Hits<br />
per species obta<strong>in</strong>ed by the po<strong>in</strong>t <strong>in</strong>tercept method were used as the species fac<strong>to</strong>r.<br />
Environmental fac<strong>to</strong>rs <strong>in</strong>cluded pH, soil temperature, organic soil depth, moisture,<br />
frost and nonfrost disturbance and <strong>to</strong>tal vascular <strong>plant</strong> cover. For ord<strong>in</strong>ation the<br />
values and not the categories for pH and organic soil depth were used. S<strong>in</strong>ce soil<br />
temperature was measured only once at each site be<strong>in</strong>g strongly dependant on current<br />
weather conditions, bioclimatic zones A <strong>to</strong> C were used <strong>to</strong> replace soil temperature <strong>in</strong><br />
a second ord<strong>in</strong>ation. Bioclimatic zones are def<strong>in</strong>ed as subdivisions of the <strong>Arctic</strong><br />
reflect<strong>in</strong>g climatic gradients (Elvebakk 1999). They <strong>in</strong>tegrate climatic measurements<br />
over a longer time period thus greatly improv<strong>in</strong>g the comparison between the different<br />
localities used <strong>in</strong> this study. The dummy variables for bioclimatic zones were<br />
numbered 1 <strong>to</strong> 3 for zone A <strong>to</strong> C accord<strong>in</strong>g <strong>to</strong> ris<strong>in</strong>g temperatures. Subdivision of<br />
arctic reflect<strong>in</strong>g climatic gradients.<br />
We assumed that the species was temperature dependant so we wanted <strong>to</strong> test whether<br />
soil temperature could be a fac<strong>to</strong>r differ<strong>in</strong>g between plots. Differences <strong>in</strong> soil<br />
temperature for the plots at Colesdalen where E. wettste<strong>in</strong>ii was grow<strong>in</strong>g compared <strong>to</strong><br />
the plots exclud<strong>in</strong>g the species were tested by carry<strong>in</strong>g out a ttest us<strong>in</strong>g SPlus® 6.2<br />
for W<strong>in</strong>dows (Insightful Corp. Seattle, WA, USA, 2003).<br />
39
Results<br />
Ecological amplitudes of vascular <strong>plant</strong> species on <strong>Svalbard</strong><br />
The DCA ord<strong>in</strong>ation revealed that the length of the gradient was larger than four.<br />
Thus a PCA based on species show<strong>in</strong>g a l<strong>in</strong>ear response along a gradient could not be<br />
carried out. The Monte Carlo Permutation test obta<strong>in</strong>ed from a CCA proved that soil<br />
temperature was not significant (p = 0.078) whereas bioclimatic zones used as a<br />
temperature proxy showed high significance (p = 0.002). The variable bioclimatic<br />
zone was consequently used <strong>in</strong> the follow<strong>in</strong>g analysis. The Monte Carlo Permutation<br />
test showed that all environmental variables except frost and nonfrost were<br />
significant (Table 2).<br />
Table 2. Significance values of the environmental variables <strong>in</strong> the Monte Carlo Permutation<br />
test.<br />
pvalue Fratio<br />
pH 0.002 3.93<br />
Bioclimatic zone 0.002 3.89<br />
Vascular <strong>plant</strong> cover 0.002 2.84<br />
Organic soil depth 0.002 2.51<br />
Moisture 0.024 1.84<br />
Frost disturbance 0.158 1.26<br />
Nonfrost disturbance 0.362 1.04<br />
The CA correlation matrix revealed that the bioclimatic zone was weakly correlated<br />
with all other fac<strong>to</strong>rs except pH (Table 3).<br />
Table 3. CA correlation matrix based on hits per species. Environmental variables used are<br />
bioclimatic zones, organic soil depth, moisture, nonfrost disturbance, frost<br />
disturbance, pH and <strong>to</strong>tal vascular <strong>plant</strong> cover.<br />
Bioclimatic Organic Soil Nonfrost Frost pH Vascular<br />
zone<br />
soil depth moisture disturbace disturbance<br />
Plant Cover<br />
Bioclimatic zone 1<br />
Organic soil depth 0.2106 1<br />
Soil moisture<br />
Nonfrost<br />
0.2990 0.1529 1<br />
disturbance 0.2093 0.1290 0.0554 1<br />
Frost disturbance 0.1469 0.1441 0.1514 0.0524 1<br />
pH<br />
Vascular <strong>plant</strong><br />
0.0965 0.0820 0.2484 0.1482 0.0170 1<br />
cover 0.3060 0.0954 0.0203 0.0791 0.1125 0.1192 1<br />
Figure 3 illustrates the driv<strong>in</strong>g fac<strong>to</strong>rs of <strong>plant</strong> distribution on <strong>Svalbard</strong>. The first and<br />
second axis expla<strong>in</strong>ed 7.8% and 7% of the variation, respectively.<br />
The two noncorrelated fac<strong>to</strong>rs pH and bioclimatic zone were regarded as the ma<strong>in</strong><br />
fac<strong>to</strong>rs for <strong>plant</strong> distribution on <strong>Svalbard</strong>. Species were sorted accord<strong>in</strong>g <strong>to</strong> their pH<br />
ranges and each pH range subsequently divided <strong>in</strong><strong>to</strong> four groups follow<strong>in</strong>g their<br />
northernmost (scattered or frequent) occurrence <strong>in</strong> the bioclimatic zones A – D (PAF<br />
2007). Thus both the ma<strong>in</strong> distribution limit and the temperature limitation were<br />
comb<strong>in</strong>ed <strong>in</strong> one table (Table 4). Bioclimatic zone D does not occur on <strong>Svalbard</strong>. It is<br />
<strong>in</strong>cluded <strong>in</strong> the table <strong>to</strong> be consistent regard<strong>in</strong>g the northernmost ma<strong>in</strong> <strong>plant</strong><br />
40
distribution. The complete results for the ecological amplitudes of 67 species on<br />
<strong>Svalbard</strong> are found <strong>in</strong> Appendix 1.<br />
As can be seen <strong>in</strong> Table 4, the smallest group consists of <strong>plant</strong>s with the widest<br />
amplitude <strong>in</strong> pH range, most of them with a northernmost occurrence <strong>in</strong> bioclimatic<br />
zone A.<br />
Twentyeight species show a medium range for pH values medium <strong>to</strong> high whereas<br />
only one <strong>plant</strong>, Luzula confusa, has a medium range for pH levels from low <strong>to</strong><br />
medium. The emphasis of the distribution limit focuses on the northernmost<br />
bioclimatic zone A.<br />
No taxon can be found for the group with narrow range and low pH. Twentyone<br />
species show a narrow range for medium pH. Thirteen taxa are found <strong>in</strong> the group<br />
with preferences for high pH only. In all groups a tendency can be seen that the<br />
category <strong>in</strong>clud<strong>in</strong>g most taxa for a given pH range displays its northernmost ma<strong>in</strong><br />
distribution limit <strong>in</strong> bioclimatic zone A.<br />
Figure 3. CA ord<strong>in</strong>ation of hits per species (67 <strong>in</strong> <strong>to</strong>tal) <strong>in</strong> 88 plots, located on <strong>Svalbard</strong>, <strong>in</strong><br />
relation <strong>to</strong> environmental variables. Stars <strong>in</strong>dicate significant variables. Sample and<br />
species labels were omitted <strong>in</strong> the figure. First and second axis expla<strong>in</strong>ed 7.8% and<br />
7%, respectively.<br />
41
A potential substrate area could be calculated for each species know<strong>in</strong>g the species<br />
specific pH range by summ<strong>in</strong>g the percentage area of acidic, weakly acidic and/or<br />
alkal<strong>in</strong>e circumneutral substrate occurr<strong>in</strong>g on <strong>Svalbard</strong>. These were set <strong>in</strong> relation <strong>to</strong><br />
the distribution estimate of each species (Figure 4).<br />
The number of species occurr<strong>in</strong>g on all substrates is low and corresponds <strong>to</strong> the<br />
species with the widest pH range from acidic <strong>to</strong> alkal<strong>in</strong>e circumneutral substrate<br />
material (Table 4). All of the species <strong>in</strong> this group show a wide distribution. On all<br />
substrate type comb<strong>in</strong>ations more than half of the species of each group are<br />
distributed over ten districts, except the acidic weakly acidic with Luzula confusa as<br />
the only group member.<br />
42
High pH amplitude<br />
Medium pH amplitude<br />
Narrow pH amplitude<br />
Table 4. pH <strong>to</strong>lerance of 67 <strong>plant</strong> species on <strong>Svalbard</strong> sorted by bioclimatic zones.<br />
Low <strong>to</strong> high pH<br />
zone A zone B zone C zone D<br />
Cerastium arcticum Salix <strong>polar</strong>is None None<br />
Poa arctica<br />
Saxifraga cespi<strong>to</strong>sa ssp. cespi<strong>to</strong>sa<br />
Low <strong>to</strong> medium pH<br />
zone A zone B zone C zone D<br />
Luzula confusa None None None<br />
medium <strong>to</strong> high pH<br />
zone A zone B zone C zone D<br />
Bis<strong>to</strong>rta vivipara Equisetum arvense ssp. alpestre<br />
Equisetum variegatum ssp.<br />
Carex maritima<br />
Cerastium regelii<br />
variegatum Carex rupestris<br />
Cochlearia groenlandica Festuca rubra ssp. richardsonii Draba norvegica<br />
Luzula nivalis Poa alp<strong>in</strong>a Dryas oc<strong>to</strong>petala<br />
Micranthes nivalis Poa pratensis ssp. alpigena Euphrasia wettste<strong>in</strong>ii<br />
Micranthes hieracifolia ssp.<br />
M<strong>in</strong>uartia rubella<br />
hieracifolia<br />
Oxyria digyna M<strong>in</strong>uartia biflora<br />
Papaver dahlianum ssp.<strong>polar</strong>e Pedicularis dasyantha<br />
Saxifraga cernua Taraxacum brachyceras<br />
Saxifraga hirculus ssp. compacta<br />
Saxifraga oppositifolia ssp.<br />
oppositifolia Unknown zone:<br />
Silene acaulis Cerastium regelii x arcticum<br />
Stellaria crassipes<br />
Low pH<br />
None<br />
Medium pH<br />
zone B zone B zone C zone D<br />
Alopecurus borealis Dupontia fisheri Coptidium lapponicum<br />
Vacc<strong>in</strong>ium ulig<strong>in</strong>osum ssp.<br />
Betula nana ssp. <strong>tundra</strong>rum<br />
Cardam<strong>in</strong>e bellidifolia ssp. bellidifolia Eriophorum scheuchzeri coll. microphyllum<br />
Draba alp<strong>in</strong>a Hierochloe alp<strong>in</strong>a ssp. alp<strong>in</strong>a<br />
Draba corymbosa Pedicularis hirsuta<br />
Ranunculus hyperboreus ssp.<br />
Draba lactea<br />
arnellii<br />
Draba micropetala Saxifraga rivularis ssp. rivularis<br />
Juncus biglumis<br />
Micranthes foliolosa<br />
Micranthes tenuis<br />
Ranunculus pygmaeus<br />
Ranunculus sulphureus<br />
Saxifraga hyperborea<br />
high pH<br />
zone A zone B zone C<br />
Cassiope tetragona ssp.<br />
zone D<br />
Draba subcapitata Draba glabella<br />
tetragona Comas<strong>to</strong>ma tenellum<br />
Phippsia algida Poa glauca Draba fladnizensis<br />
Poa abbreviata ssp. abbreviata Trisetum spicatum ssp. spicatum Erigeron humilis<br />
Potentilla hyparctica ssp. hyparctica Ranunculus arcticus<br />
Saxifraga platysepala<br />
43
no. of districts<br />
30<br />
25<br />
20<br />
15<br />
10<br />
5<br />
0<br />
alkal<strong>in</strong>e<br />
circumneutral (5.4%)<br />
weakly acidic (14.1%)<br />
<strong>in</strong>creas<strong>in</strong>g substrate area def<strong>in</strong>ed by species pH range<br />
44<br />
Weakly acidic – alkal<strong>in</strong>e<br />
circumneutral (19.5%)<br />
acidic – weakly<br />
acidic (20.2%)<br />
acidic – alkal<strong>in</strong>e<br />
Circumneutral Circumneutral (25.6%)<br />
Figure 4. Occurrence of species <strong>in</strong> districts <strong>in</strong> relation <strong>to</strong> sum of pH def<strong>in</strong>ed substrate area.<br />
Comparison of ecological amplitudes of selected species from <strong>Svalbard</strong> and<br />
Greenland, with special emphasis on the Mesters Vig district, NE Greenland<br />
Dur<strong>in</strong>g the fieldwork on <strong>Svalbard</strong> 67 species were observed <strong>in</strong> <strong>to</strong>tal, of which 45 had<br />
previously also been studied <strong>in</strong> Greenland. The ecological amplitudes of the species<br />
present on both <strong>Svalbard</strong> and at Mesters Vig were compared. Different ecological<br />
amplitudes were found for ten species (Table 5). For the complete list and ecological<br />
amplitude of <strong>plant</strong> taxa occurr<strong>in</strong>g on both <strong>Svalbard</strong> and Mesters Vig, NE Greenland,<br />
see Appendix 2.<br />
Betula nana ssp. <strong>tundra</strong>rum on <strong>Svalbard</strong> was observed <strong>in</strong> plots with 8090 % <strong>to</strong>tal<br />
vascular <strong>plant</strong> cover. At Mesters Vig, the species was found <strong>to</strong> be grow<strong>in</strong>g at all<br />
categories from low <strong>to</strong> high density of <strong>to</strong>tal vascular <strong>plant</strong> cover. In addition, B. nana<br />
showed a broader amplitude on <strong>Svalbard</strong> regard<strong>in</strong>g nonfrost disturbance than at<br />
Mesters Vig. Cardam<strong>in</strong>e bellidifolia ssp. bellidifolia on <strong>Svalbard</strong> was found <strong>to</strong> grow<br />
on stable <strong>to</strong> medium stable ground with respect <strong>to</strong> frost disturbance whereas at<br />
Mesters Vig the species only occurred on stable substrate. On <strong>Svalbard</strong>, Cochlearia<br />
groenlandica displayed a broader amplitude regard<strong>in</strong>g <strong>to</strong>tal vascular <strong>plant</strong> cover than<br />
the species at Mesters Vig. M<strong>in</strong>uartia rubella and Poa abbreviata ssp. abbreviata<br />
were both grow<strong>in</strong>g on medium moist soil on <strong>Svalbard</strong>, while they occurred on soil<br />
with low moisture content at Mesters Vig. Phippsia algida was found on <strong>Svalbard</strong> on<br />
stable ground with frost disturbance whereas it occurred on medium disturbed<br />
substrate at Mesters Vig. Poa pratensis ssp. alpigena and Saxifraga cespi<strong>to</strong>sa ssp.<br />
cespi<strong>to</strong>sa possessed on <strong>Svalbard</strong> a broader amplitude regard<strong>in</strong>g the vascular <strong>plant</strong><br />
cover than at Mesters Vig. Micranthes foliolosa ssp. foliolosa was present <strong>in</strong> this<br />
study at a s<strong>in</strong>gle site occurr<strong>in</strong>g with 5060 % <strong>to</strong>tal vascular <strong>plant</strong> cover. At Mesters
Vig, the species was recorded <strong>in</strong> places with 120 % vascular <strong>plant</strong> cover. Micranthes<br />
hieracifolia ssp. hieracifolia on <strong>Svalbard</strong> showed a lower <strong>to</strong>lerance <strong>to</strong> frost<br />
disturbance and a slightly higher <strong>to</strong>lerance with respect <strong>to</strong> nonfrostdisturbance<br />
compared <strong>to</strong> the Mesters Vig district.<br />
Table 5. Ecological amplitude of ten selected species occurr<strong>in</strong>g on both <strong>Svalbard</strong> (blue) and<br />
Greenland (red). The th<strong>in</strong> l<strong>in</strong>es represent not observed but suggested parts of the<br />
respective amplitudes. The discussed differences are marked <strong>in</strong> light blue.<br />
Species<br />
110<br />
1120<br />
2130<br />
<strong>to</strong>tal <strong>plant</strong> cover moisture frost dist.<br />
3140<br />
4150<br />
5160<br />
6170<br />
Regard<strong>in</strong>g the pH, Karlsen & Elvebakk (2003) did not f<strong>in</strong>d any species grow<strong>in</strong>g<br />
solely on acidic substrates which corresponds <strong>to</strong> our f<strong>in</strong>d<strong>in</strong>gs. Table 6 shows a<br />
comparison of the results for species be<strong>in</strong>g present <strong>in</strong> both the Karlsen & Elvebakk<br />
study and ours. The assigned pH range for species on <strong>Svalbard</strong> is narrower for Betula<br />
nana ssp. <strong>tundra</strong>rum, Draba alp<strong>in</strong>a, Draba glabella and Eriophorum scheuchzeri<br />
coll. Different pH ranges were found for the species Cassiope tetragona ssp.<br />
45<br />
7180<br />
8190<br />
low<br />
medium<br />
high<br />
stable<br />
medium<br />
unstable<br />
stable<br />
nonfrost<br />
dist.<br />
Betula nana ssp. <strong>tundra</strong>rum 2 1<br />
Cardam<strong>in</strong>e bellidifolia ssp.<br />
Bellidifolia 9 6<br />
Cochlearia groenlandica 8 5<br />
Micranthes foliolosa 1 1<br />
Micranthes hieracifolia ssp.<br />
Hieracifolia 5 3<br />
M<strong>in</strong>uartia rubella 4 4<br />
Phippsia algida 1 1<br />
Poa abbreviata ssp.<br />
Abbreviate 1 1<br />
Poa pratensis ssp. alpigena 6 5<br />
Saxifraga cespi<strong>to</strong>sa ssp.<br />
Cespi<strong>to</strong>sa 24 12<br />
medium<br />
unstable<br />
presence <strong>in</strong> plots (<strong>to</strong>tal: 88)<br />
presence per site (<strong>to</strong>tal: 29)
tetragona, Erigeron humilis, M<strong>in</strong>uartia biflora and Trisetum spicatum ssp. spicatum.<br />
These species occurred at one site with a pH greater than 7.<br />
Table 6. Comparison of pH ranges (C: calcareous (pH >7); N: neutral (pH 5.27.0); A: acidic<br />
(pH
Table 7. Presents of possible host species of Euphrasia wettste<strong>in</strong>ii <strong>in</strong> the plots at Ossian Sars<br />
and Colesdalen.<br />
Species Plot with<br />
Euphrasia<br />
(n = 2)<br />
47<br />
Ossian Sars Colesdalen<br />
Plot without<br />
Euphrasia<br />
(n = 2)<br />
Plot with<br />
Euphrasia<br />
(n = 10)<br />
Plot without<br />
Euphrasia<br />
(n = 10)<br />
Bis<strong>to</strong>rta vivipara 100% 100% 100% 90%<br />
Festuca rubra ssp. richardsonii 100% 50% 100% 80%<br />
Poa arctica 50% 20% 10%<br />
Salix <strong>polar</strong>is 50% 90% 70%<br />
Equisetum arvense ssp. alpestre 100% 100%<br />
Stellaria crassipes 50% 50% 90% 80%<br />
Trisetum spicatum ssp. spicatum 100% 30% 30%<br />
Luzula confusa <br />
Alopecurus borealis 80% 80%<br />
Mean soil temperature (10 cm depth) 8,5°C 7,8°C 6,1°C 5,0°C<br />
Discussion<br />
Comparison of ecological amplitudes of selected species from <strong>Svalbard</strong> and<br />
Greenland, with special emphasis on the Mesters Vig district, NE Greenland<br />
The range of this study limited our observations of the habitat types <strong>in</strong> which species<br />
might be able <strong>to</strong> grow. Species with narrow ecological amplitudes might show<br />
broader amplitudes than recorded here. To avoid mis<strong>in</strong>terpretation or generalization of<br />
a species’ ecological amplitude we focused <strong>in</strong> this comparison on species with<br />
broader ecological amplitudes or different noncongruent amplitudes visàvis<br />
Mesters Vig.<br />
Ten of the observed species <strong>in</strong> <strong>Svalbard</strong> showed differences <strong>in</strong> their ecological<br />
amplitudes <strong>in</strong> comparison <strong>to</strong> the same species found at Mesters Vig. However,<br />
comparisons with the distribution map of <strong>Svalbard</strong> (Elvebakk 2005, Hultén & Fries<br />
1986) revealed that all but Poa pratensis ssp. alpigena and Saxifraga cespi<strong>to</strong>sa ssp.<br />
cespi<strong>to</strong>sa, were widespread beyond the areas we visited. Poa pratensis ssp. alpigena<br />
and Saxifraga cespi<strong>to</strong>sa ssp. cespi<strong>to</strong>sa displayed wider ecological amplitudes on<br />
<strong>Svalbard</strong> than at Mesters Vig. Cardam<strong>in</strong>e bellidifolia ssp. bellidifolia and Micranthes<br />
hieracifolia ssp. hieracifolia showed broader ecological amplitudes on <strong>Svalbard</strong> than<br />
at Mesters Vig <strong>in</strong> terms of their <strong>to</strong>lerance <strong>to</strong> frost disturbance. Cochlearia<br />
groenlandica and Micranthes foliolosa were associated with a wider range of <strong>to</strong>tal<br />
vascular <strong>plant</strong> cover be<strong>in</strong>g wider on <strong>Svalbard</strong>. However, literature research (Böcher<br />
1963, Gelt<strong>in</strong>g 1934, Raup 1965, Raup 1969, Sørensen 1933) provided evidence that<br />
no difference <strong>in</strong> ecological amplitudes exists for a given taxon present on both<br />
<strong>Svalbard</strong> and Greenland when compar<strong>in</strong>g all of Greenland (Böcher 1963, Raup 1965).<br />
The ma<strong>in</strong> difference found was the <strong>plant</strong>s <strong>to</strong>lerance <strong>to</strong> frost disturbance. The species<br />
at Mesters Vig seem <strong>to</strong> have wider amplitudes regard<strong>in</strong>g frost disturbance compared
with the species occurr<strong>in</strong>g on <strong>Svalbard</strong>. Although Mesters Vig is located slightly more<br />
south than <strong>Svalbard</strong>, frost disturbance is the major geomorphologic process<br />
determ<strong>in</strong><strong>in</strong>g <strong>plant</strong> life there. Frost crack<strong>in</strong>g and heav<strong>in</strong>g are widespread processes<br />
operat<strong>in</strong>g <strong>in</strong> the Mesters Vig (Washburn 1969). Most of the localities we sampled on<br />
<strong>Svalbard</strong> did not show a high degree of frost disturbance. The process of frost<br />
disturbance depends on <strong>to</strong>pography, rock material, temperature, moisture and snow<br />
cover. Time may be of importance when frost patterns develop very slowly<br />
(Washburn 1973). Old exposed landscape surfaces where frost features are<br />
predom<strong>in</strong>ant were not assessed <strong>in</strong> this study expla<strong>in</strong><strong>in</strong>g part of the differences <strong>in</strong> the<br />
results.<br />
The species at Mesters Vig tend <strong>to</strong> exhibit a wider <strong>to</strong>lerance on the moisture gradient<br />
compared <strong>to</strong> <strong>Svalbard</strong>. This may be due <strong>to</strong> the limited dataset of this study. Soil<br />
moisture measurements were conducted only once with most measurements show<strong>in</strong>g<br />
medium soil moisture. M<strong>in</strong>uartia rubella and Poa abbreviata ssp. abbreviata were<br />
grow<strong>in</strong>g on medium moist substrate on <strong>Svalbard</strong> <strong>in</strong> contrast <strong>to</strong> the Mesters Vig district<br />
where both species were present at low soil moisture. At Florabukta where the plots<br />
were recorded, precipitation led <strong>to</strong> overestimation of soil moisture. If low soil<br />
moisture contents is typical at this location, an underestimation of the moisture<br />
amplitude for all species present at this site is likely.<br />
For Betula nana ssp. <strong>tundra</strong>rum broader amplitudes with respect <strong>to</strong> <strong>to</strong>tal <strong>plant</strong> cover<br />
were observed on Greenland compared <strong>to</strong> <strong>Svalbard</strong>. S<strong>in</strong>ce this species is rare on<br />
<strong>Svalbard</strong>, these differences may be due simply <strong>to</strong> limited observations.<br />
Phippsia algida was found on <strong>Svalbard</strong> on stable with respect <strong>to</strong> frost disturbance <strong>in</strong><br />
contrast <strong>to</strong> the Mesters Vig district where the species was grow<strong>in</strong>g on medium<br />
disturbed substrates. This difference can partly be due <strong>to</strong> limited observations on<br />
<strong>Svalbard</strong>. In the Mesters Vig district it is possible that stable, nonfrost disturbed<br />
ground is rarely present.<br />
Ow<strong>in</strong>g <strong>to</strong> the fact that its taxonomy has been heavily revised dur<strong>in</strong>g past years,<br />
Cerastium arcticum was not compared s<strong>in</strong>ce we cannot be certa<strong>in</strong> what we found on<br />
<strong>Svalbard</strong> is the same taxon as at Mesters Vig. Morphological variation is high with<strong>in</strong><br />
the complex, and the species are not clearly dist<strong>in</strong>guishable (Hagen 2001). Thus it<br />
rema<strong>in</strong>s unclear <strong>to</strong> which species Raup referred <strong>in</strong> his study at Mesters Vig.<br />
Different pH ranges for the species Cassiope tetragona ssp. tetragona, Erigeron<br />
humilis, M<strong>in</strong>uartia biflora and Trisetum spicatum ssp. spicatum were observed at one<br />
site with a pH clearly higher than 7, <strong>in</strong> contrast <strong>to</strong> the report by Karlsson & Elvebakk<br />
(2003) of acidic <strong>to</strong> weakly acidic pH ranges for the same taxa. However, Cassiope<br />
tetragona ssp. tetragona is known <strong>to</strong> grow at sites with limes<strong>to</strong>ne <strong>in</strong>fluence <strong>in</strong> sub<br />
arctic habitats <strong>in</strong> northern Sweden (Lid et al. 2005).<br />
The pH range recorded <strong>in</strong> this study seems <strong>to</strong> be <strong>to</strong>o narrow for the species Betula<br />
nana ssp. <strong>tundra</strong>rum, Draba alp<strong>in</strong>a, Draba glabella and Eriophorum scheuchzeri<br />
coll. when compar<strong>in</strong>g <strong>to</strong> Karlsson & Elvebakk (2003). This may be due <strong>to</strong> the fact that<br />
these species were recorded at one site only. These differences might disappear when<br />
apply<strong>in</strong>g a larger dataset.<br />
48
Tak<strong>in</strong>g all of Greenland <strong>in</strong><strong>to</strong> account taxa occurr<strong>in</strong>g both on <strong>Svalbard</strong> and Greenland<br />
tend <strong>to</strong> show the same overall ecological amplitude regardless of low or high arctic<br />
environment. However, further studies are necessary <strong>to</strong> verify this statement. As yet,<br />
generalisations of ecological amplitudes of <strong>plant</strong> taxa for the entire <strong>Arctic</strong> should be<br />
considered with care.<br />
Ecological amplitudes of vascular <strong>plant</strong> species on <strong>Svalbard</strong><br />
The results show that the majority of the species over all pH ranges exhibit their ma<strong>in</strong><br />
distribution limit <strong>in</strong> bioclimatic zone A. Regard<strong>in</strong>g pH amplitudes very few <strong>plant</strong>s<br />
(five species) seem <strong>to</strong> be able <strong>to</strong> grow at low pH (< 5.2) values. Most prefer medium<br />
<strong>to</strong> high pH substrates (62 species). This reflects the substrate availability on <strong>Svalbard</strong><br />
with weakly acidic substrates (pH 5.27.0) cover<strong>in</strong>g the largest area.<br />
Cerastium arcticum, Poa arctica, Saxifraga cespi<strong>to</strong>sa ssp. cespi<strong>to</strong>sa and Salix <strong>polar</strong>is<br />
are truly widespread species with a wide ecological amplitude <strong>in</strong> terms of both pH and<br />
temperature. In addition, they show a wide <strong>to</strong>lerance concern<strong>in</strong>g <strong>to</strong>tal <strong>plant</strong> cover (10<br />
90%) and a medium range for disturbance and moisture (s. Appendix 1). Species<br />
which are restricted <strong>to</strong> bioclimatic zone C or D and exhibit a narrow pH amplitude are<br />
less widespread.<br />
More than half of the species <strong>in</strong> each substrate group except the acidic and weakly<br />
acidic substrate group are widespread on <strong>Svalbard</strong>. All three substrate types occur <strong>in</strong><br />
each bioclimatic zone on <strong>Svalbard</strong>. Thus the substrate type does not appear <strong>to</strong> limit<br />
distribution of species on <strong>Svalbard</strong>.<br />
Luzula confusa and Poa arctica, although widespread on the species distribution map<br />
of <strong>Svalbard</strong>, received relatively low values <strong>in</strong> the district count per species. This may<br />
be due <strong>to</strong> an underrepresentation of the taxa <strong>in</strong> the <strong>Svalbard</strong> database which served as<br />
a basis for the district count.<br />
Ecological amplitudes of a few selected species were compared <strong>to</strong> the vegetation type<br />
map (Arnesen, personal communication), species distribution map and substrate map<br />
of <strong>Svalbard</strong> (Arnesen, personal communication) <strong>to</strong> verify our f<strong>in</strong>d<strong>in</strong>gs. Our study<br />
shows that Luzula confusa prefers substrates of low <strong>to</strong> medium pH. The substrate on<br />
Nordaustlandet, where the Luzula confusa vegetation type is dom<strong>in</strong>ant, consists<br />
ma<strong>in</strong>ly of acidic substrate types reflect<strong>in</strong>g the species preferences. In addition, the<br />
distribution map shows that Luzula confusa doesn’t occur <strong>in</strong> the area of alkal<strong>in</strong>e<br />
circumneutral substrates but is present on acidic and weakly acidic substrates. The<br />
medium <strong>to</strong> high pH values which were recorded for Papaver dahlianum ssp. <strong>polar</strong>e,<br />
are congruent with its occurrence <strong>in</strong> the Papaver <strong>polar</strong> <strong>desert</strong> where partly alkal<strong>in</strong>e<br />
and weakly acidic substrates are dom<strong>in</strong>ant. The mesic Luzula nivalis vegetation type<br />
of bioclimatic zone B relates <strong>to</strong> weakly acidic and alkal<strong>in</strong>e substrates and the assigned<br />
pH range of Luzula nivalis. The distribution of the Poa alp<strong>in</strong>a snow beds corresponds<br />
<strong>to</strong> a substrate higher <strong>in</strong> pH which is expressed <strong>in</strong> the species pH <strong>to</strong>lerance of medium<br />
<strong>to</strong> high pH values. On the species distribution map, Papaver dahlianum ssp. <strong>polar</strong>e,<br />
Luzula nivalis and Poa alp<strong>in</strong>a are ma<strong>in</strong>ly distributed <strong>in</strong> areas with weakly acidic <strong>to</strong><br />
alkal<strong>in</strong>e circumneutral substrates match<strong>in</strong>g their ecological pH amplitudes. The<br />
Cassiope tetragona ssp. tetragona vegetation type, occurr<strong>in</strong>g on weakly acidic<br />
substrates, is less well expressed <strong>in</strong> our data where a narrow pH range of high pH<br />
values was recorded for C. tetragona ssp. tetragona. However, the species distribution<br />
49
and substrate map show a clear occurrence of Cassiope tetragona ssp. tetragona on<br />
alkal<strong>in</strong>e circumneutral substrates. Overall, the data from this study are consistent<br />
despite the relatively small dataset.<br />
We concentrated on the variables pH and bioclimatic zone s<strong>in</strong>ce zone was weakly<br />
correlated <strong>to</strong> all other fac<strong>to</strong>rs except pH. Accord<strong>in</strong>gly, species categories could have<br />
been devised <strong>in</strong> relation <strong>to</strong> the variables be<strong>in</strong>g significant <strong>in</strong> the Monte Carlo<br />
Permutation Test (s. Table 2) such as <strong>to</strong>tal vascular <strong>plant</strong> cover, organic soil depth and<br />
moisture. Moisture, though measured on a s<strong>in</strong>gle day can be expected <strong>to</strong> be an<br />
important fac<strong>to</strong>r separat<strong>in</strong>g <strong>plant</strong> species distribution. The nonsignificance of frost<br />
and nonfrost disturbance <strong>in</strong> the CCA might be expla<strong>in</strong>ed by our choice of habitats.<br />
The study sites were often situated <strong>in</strong> areas with fairly well established vegetation.<br />
Highly unstable nonfrost conditions were rarely recorded even <strong>in</strong> newly deglaciated<br />
areas <strong>in</strong> the forefront of glaciers. Old landscape surfaces, hav<strong>in</strong>g long been<br />
deglaciated and therefore show<strong>in</strong>g features of high frost activity, are absent <strong>in</strong> this<br />
study, thus unstable frost disturbance conditions were not recorded.<br />
Despite above mentioned restrictions and a limited dataset for vascular <strong>plant</strong>s we were<br />
able <strong>to</strong> draw some conclusions about <strong>plant</strong> species distribution on <strong>Svalbard</strong>. Plant<br />
distribution <strong>in</strong> the <strong>Arctic</strong> is limited by a variety of abiotic fac<strong>to</strong>rs (Savile 1960). A few<br />
of them like pH, temperature, organic soil depth, soil moisture and the biotic fac<strong>to</strong>r<br />
vascular <strong>plant</strong> cover were analysed. A m<strong>in</strong>ority of species was found <strong>to</strong> be widely<br />
spread and cover<strong>in</strong>g a wide pH amplitude. The majority of species possessed narrow<br />
<strong>to</strong> medium amplitudes regard<strong>in</strong>g pH, yet they were widespread on <strong>Svalbard</strong>.<br />
Widespread <strong>plant</strong>s <strong>in</strong> the <strong>Arctic</strong> are not necessarily widespread due <strong>to</strong> their wide<br />
ecological amplitude but due <strong>to</strong> a widespread habitat. Plants with narrow ecological<br />
amplitudes might even have advantages regard<strong>in</strong>g niche differentiation of <strong>plant</strong><br />
species as has been shown by McKane et al. (2002) concern<strong>in</strong>g nitrogen sources <strong>in</strong><br />
arctic <strong>tundra</strong>. Instead of struggl<strong>in</strong>g for survival <strong>plant</strong> taxa seem well adapted <strong>to</strong> their<br />
often harsh environmental conditions <strong>in</strong> the <strong>Arctic</strong>. Alternative lifestyles of both<br />
generalists’ and specialists’ behaviour with respect <strong>to</strong> their ecological amplitude<br />
facilitates this adaptation.<br />
Study species Euphrasia wettste<strong>in</strong>ii<br />
Possible host species of E. wettste<strong>in</strong>ii were exam<strong>in</strong>ed <strong>in</strong> this study. Bis<strong>to</strong>rta vivipara,<br />
Salix <strong>polar</strong>is and the gram<strong>in</strong>oids Poa arctica and Luzula confusa were the most frequent<br />
species. However, only Bis<strong>to</strong>rta vivipara and Poa arctica were present with ≥ 50% at<br />
both Ossian Sars and Colesdalen suggest<strong>in</strong>g that Bis<strong>to</strong>rta vivipara and Poa arctica are<br />
host species of E. wettste<strong>in</strong>ii. This is be supported by previous studies on <strong>Svalbard</strong><br />
and the mounta<strong>in</strong> Sandalsnuten at F<strong>in</strong>se (Euphrasia frigida was studied at F<strong>in</strong>se. Due<br />
<strong>to</strong> taxonomical changes, E. wettste<strong>in</strong>ii is the new name used for the species found <strong>in</strong><br />
<strong>Svalbard</strong>). Studies from <strong>Svalbard</strong> proposed that Salix <strong>polar</strong>is and Bis<strong>to</strong>rta vivipara<br />
among others, are with<strong>in</strong> host range of E. wettste<strong>in</strong>ii (Alsos & Lund 1999, Alsos et al.<br />
2004). Results from Sandalsnuten at F<strong>in</strong>se revealed that Bis<strong>to</strong>rta vivipara and species<br />
from the genera Poa and Salix are likely host species of E. wettste<strong>in</strong>ii (Nyléhn &<br />
Totland 1999). Plots with E. wettste<strong>in</strong>ii were similar <strong>in</strong> species composition <strong>to</strong> those<br />
plots without E. wettste<strong>in</strong>ii. Thus E. wettste<strong>in</strong>ii may have the potential <strong>to</strong> spread <strong>to</strong> a<br />
wider area with use of different host species.<br />
50
The temperature measurements at 10 cm soil depth <strong>in</strong> the plots with E. wettste<strong>in</strong>ii<br />
showed a higher temperature (~0.51 °C) <strong>in</strong> comparison <strong>to</strong> the plots without E.<br />
wettste<strong>in</strong>ii, however, the ttest showed no significance.<br />
One patch of E. wettste<strong>in</strong>ii was found at Colesdalen <strong>in</strong> 1998 and n<strong>in</strong>e patches were<br />
discovered <strong>in</strong> 2002 (Alsos & Lund 1999, Alsos et al. 2004). This <strong>in</strong>crease <strong>in</strong> patches<br />
correlates with the temperature diagram which shows a peak <strong>in</strong> 1998 and one <strong>in</strong> 2002<br />
due <strong>to</strong> <strong>in</strong>creased summer temperature. By July 2007 the n<strong>in</strong>e patches had spread <strong>to</strong><br />
one big cont<strong>in</strong>uous patch. Is the spread of E. wettste<strong>in</strong>ii <strong>in</strong> Colesdalen a consequence<br />
of <strong>in</strong>creased mean summer temperature on <strong>Svalbard</strong>? It is worth not<strong>in</strong>g on the<br />
mounta<strong>in</strong> Sandalsnuten at F<strong>in</strong>se <strong>in</strong> Norway, growth and seed production of E.<br />
wettste<strong>in</strong>ii were largely temperature dependent (Nyléhn & Totland 1999). However,<br />
the effect of temperature on the spread of E. wettste<strong>in</strong>ii must be <strong>in</strong>direct due <strong>to</strong><br />
<strong>in</strong>creased growth and quality of the host <strong>plant</strong> caused by elevated temperature. As a<br />
consequence, the population of E. wettste<strong>in</strong>ii could actually decrease due <strong>to</strong> <strong>in</strong>creased<br />
competition if we assume that a warmer climate leads <strong>to</strong> a denser vegetation cover.<br />
However, temperatures on <strong>Svalbard</strong> may have <strong>to</strong> rise substantially before this process<br />
will take effect. Increased temperatures and changes <strong>in</strong> species composition can lead<br />
<strong>to</strong> disappearance of some of the host species of E. wettste<strong>in</strong>ii and <strong>in</strong>troduction of new<br />
species. Due <strong>to</strong> the broad host range of E. wettste<strong>in</strong>ii one can assume that this might<br />
not <strong>in</strong>fluence the ability <strong>to</strong> have proper species <strong>in</strong> the surround<strong>in</strong>gs <strong>to</strong> parasitise<br />
(Nyléhn & Totland 1999, Seel & Press 1993).<br />
Dense patches of E. wettste<strong>in</strong>ii <strong>in</strong> Colesdalen were observed near bare ground ma<strong>in</strong>ly<br />
caused by frost disturbance. Open soil patches are needed for seed establishment<br />
(Molau 1993, Seel & Press 1993). Longterm consequences of climatic changes may<br />
lead <strong>to</strong> less frost disturbance and, consequently, fewer open soil patches. The result<strong>in</strong>g<br />
dense vegetation cover may limit the growth of E. wettste<strong>in</strong>ii <strong>in</strong> some places.<br />
The thermophilic annual E. wettste<strong>in</strong>ii has not only the potential <strong>to</strong> spread when mean<br />
July temperatures are ris<strong>in</strong>g by 1 degree Kelv<strong>in</strong>, this be<strong>in</strong>g the temperature <strong>in</strong>crease<br />
be<strong>in</strong>g observed for the last ten years, but is already expand<strong>in</strong>g its habitat.<br />
Conclusion<br />
Species on <strong>Svalbard</strong> and Greenland possess the same ecological amplitudes,<br />
regardless of their occurrence <strong>in</strong> the Low or High <strong>Arctic</strong>. Widespread species on<br />
<strong>Svalbard</strong> do not necessarily possess wide ecological amplitudes and widespread <strong>plant</strong>s<br />
do not naturally display wide ecological amplitudes. These conclusions may be of<br />
major <strong>in</strong>terest when consider<strong>in</strong>g species responses <strong>to</strong> climate change. A variety of<br />
arctic species may have ecological amplitudes large enough <strong>to</strong> accommodate for<br />
climate change. A population of the thermophilic annual Euphrasia wettste<strong>in</strong>ii seems<br />
<strong>to</strong> be spread<strong>in</strong>g, perhaps due <strong>to</strong> ris<strong>in</strong>g temperatures on <strong>Svalbard</strong>, thereby <strong>in</strong>dicat<strong>in</strong>g<br />
early signs of climate change <strong>in</strong> the <strong>Arctic</strong>.<br />
References<br />
ACIA. 2006: <strong>Arctic</strong> Climate Impact Assessment: Scientific Report Cambridge.<br />
51
Alsos, I. G. 2007: Frequent LongDistance Plant Colonization <strong>in</strong> the Chang<strong>in</strong>g <strong>Arctic</strong>.<br />
Science, 316.<br />
Alsos, I. G. personal communication: Euphrasia wettste<strong>in</strong>ii.<br />
Alsos, I. G. & Lund, L. 1999: Fjelløyentrøst Euphrasia frigida funnet i Colesdalen,<br />
<strong>Svalbard</strong>. Blyttia, 57: 36.<br />
Alsos, I. G., Westergaard, K., Lund, L. & Sandbakk, B. E. 2004: Floraen i Colesdalen,<br />
<strong>Svalbard</strong>. Blyttia, 62: 142150.<br />
Arnesen, G. personal communication: Substrate map of <strong>Svalbard</strong>.<br />
Bakken, T., Kålås, J. & Viken, Å. 2006: Norsk Rødliste 2006.<br />
Bill<strong>in</strong>gs, W. D. & Mooney, H. A. 1968: The <strong>ecology</strong> of arctic and alp<strong>in</strong>e <strong>plant</strong>s.<br />
Biological Reviews, 43: 481529.<br />
Brochmann, C. & Steen, S. W. 1999: Sex and genes <strong>in</strong> the flora of <strong>Svalbard</strong>—<br />
implications for conservation biology and climate change. Matematisk<br />
Naturvitenskapelig Klasse, Skrifter, 38: 3372.<br />
Bråthen, K. A. & Hagberg, O. 2004: More efficient estimation of <strong>plant</strong> biomass.<br />
Journal of Vegetation Science, 15: 653660.<br />
Böcher, T. W. 1963: Phy<strong>to</strong>geography of middle west Greenland. Meddelelser om<br />
Grønland, 148.<br />
Canoco for W<strong>in</strong>dows 4.5. 1999<br />
Coudun, C. & Gegout, J. C. 2005: Ecological behaviour of herbaceous forest species<br />
along a pH gradient: a comparison between oceanic and semicont<strong>in</strong>ental regions <strong>in</strong><br />
northern France. Global Ecology and Biogeography, 14: 263270.<br />
Ellenberg, H., Weber, H. E., Düll, R., Wirth, V., Werner, W. & Paulissen, D. (red.).<br />
1991: Zeigerwerte der Pflanzen <strong>in</strong> Mitteleuropa. Scripta Geobotanica 18 (Lehrstul<br />
für Geobotanik der Universität Gött<strong>in</strong>gen). Gött<strong>in</strong>gen.<br />
Elvebakk, A. 1999: Bioclimatic delimitation and subdivision of the <strong>Arctic</strong>.<br />
Matematisk Naturvitenskaplig Klasse, skrifter, 38: 81112.<br />
Elvebakk, A. 2005: A vegetation map of <strong>Svalbard</strong> on the scale 1:3.5 mill.<br />
Phy<strong>to</strong>coenologia, 35: 951967.<br />
Gelt<strong>in</strong>g, P. 1934: Studies on the vascular <strong>plant</strong>s of east Greenland between Franz<br />
Joseph Fjord and Dove Bay (Lat. 73° 15’ – 76° 20’ N.). Meddelelser om Grønland,<br />
101.<br />
Hagen, A. R. 2001: Transatlantic dispersal and phylogeography of Cerastium<br />
arcticum (Caryophyllaceae) <strong>in</strong>ferred from RAPD and SCAR markers. American<br />
Journal of Botany, 88: 103112.<br />
Hill, M., Roy, D., Mountford, J. & Bunce, R. 2000: Extend<strong>in</strong>g Ellenberg's Indica<strong>to</strong>r<br />
Values <strong>to</strong> a New Area: An Algorithmic Approach. The Journal of Applied Ecology,<br />
37: 315.<br />
52
Hultén, E. & Fries, M. 1986: Atlas of North European Vascular Plants North of the<br />
Tropic of Cancer. Königste<strong>in</strong>, Koeltz Scientific Books.<br />
Jónsdóttir, I. S. 2005: Terrestrial ecosystems on <strong>Svalbard</strong>: heterogeneity, complexity<br />
and fragility from an arctic island perspective. Biology and Environmen:<br />
proceed<strong>in</strong>gs of the Royal Irish Academy, 105B: 155165.<br />
Karlsen, S. R. & Elvebakk, A. 2003: A method us<strong>in</strong>g <strong>in</strong>dica<strong>to</strong>r <strong>plant</strong>s <strong>to</strong> map local<br />
climatic variation <strong>in</strong> the Kangerlussuaq/Scoresby Sund area, East Greenland.<br />
Journal of Biogeography, 30: 14691491.<br />
Lid, J., Lid, D. T. & Elven, R. 2005: Norsk flora, Det Norske Samlaget. 1014 s.<br />
McKane, R., Johnson, L., Shaver, G. & Nadelhoffer, K. 2002: Resourcebased niches<br />
provide a basis for <strong>plant</strong> species diversity and dom<strong>in</strong>ance <strong>in</strong> arctic <strong>tundra</strong>. Nature,<br />
415: 6871.<br />
MET. 2007: Døgnverdier <strong>Svalbard</strong> Lufthavn, Me<strong>to</strong>rologisk <strong>in</strong>stitutt. Lokalisert 26.07.<br />
2007 på World Wide Web:<br />
http://met.no/observasjoner/svalbard/<strong>Svalbard</strong>Lufthavn/<strong>in</strong>dex.html?stasjon.<br />
Molau, U. 1993: Phenology and reproductive <strong>ecology</strong> <strong>in</strong> six subalp<strong>in</strong>e species of<br />
Rh<strong>in</strong>anthoideae (Scrophulariaceae). Opera Bot., 121: 717.<br />
Nyléhn, J. & Totland, Ø. 1999: Effects of temperature and natural disturbance on<br />
growth, reproduction and population density <strong>in</strong> the alp<strong>in</strong>e annual hemiparasite<br />
Euphrasia frigida. <strong>Arctic</strong>, Antarctic and Alp<strong>in</strong>e Research, 31: 259263.<br />
PAF. 2007: Checklist of the Panarctic Flora (PAF). Draft version. I: Elven, R.,<br />
Murray, D. F., Razzhiv<strong>in</strong>, V. & Yurtsev, B. A. (red.). Oslo, Univ. of Oslo.<br />
Przybylak, R. 2007: Recent air temperature changes <strong>in</strong> the arctic. Annals of<br />
Glaciology, 46: 316324.<br />
Raup, H. M. 1965: The flower<strong>in</strong>g <strong>plant</strong>s and ferns of the Mesters Vig district,<br />
northeast Greenland. Meddelelser om Grønland, 166.<br />
Raup, H. M. 1969: The relation of the vascular flora <strong>to</strong> some fac<strong>to</strong>rs of site <strong>in</strong> the<br />
Mester Vig district, northeast Greenland. Meddelelser om Grønland, 176: 180.<br />
Rønn<strong>in</strong>g, O. I. 1961: Some new contributions <strong>to</strong> the flora of <strong>Svalbard</strong>. Norsk<br />
Polar<strong>in</strong>stitutt Skrifter, 124: 120.<br />
Saetersdal, M. & Birks, H. J. 1997: A comparative ecological study of Norwegian<br />
mounta<strong>in</strong> <strong>plant</strong>s <strong>in</strong> relation <strong>to</strong> possible future climatic change. Journal of<br />
Biogeography, 24: 127152.<br />
Savile, D. B. O. 1960: Limitations of the competitive exclusion pr<strong>in</strong>ciple. Science,<br />
132: 1761.<br />
Savile, D. B. O. 1972: <strong>Arctic</strong> Adaptations <strong>in</strong> Plants. Småtrykk, 20.<br />
Seel, W. E. & Press, M. C. 1993: Influence of the host on three sub<strong>Arctic</strong> annual<br />
facultative root hemiparasites. New Phy<strong>to</strong>logist, 125: 131138.<br />
Sørensen, T. 1933: The vascular <strong>plant</strong>s of East Greenland from 71° 00’ <strong>to</strong> 73° 30’ N.<br />
Meddelelser om Grønland. 101.<br />
53
Walker, M., Wahren, C., Hollister, R., Henry, G., Ahlquist, L., Alatalo, J., Bret<br />
Harte, M., Calef, M., Callaghan, T., Carroll, A., Epste<strong>in</strong>, H., Jonsdottir, I., Kle<strong>in</strong>, J.,<br />
Magnusson, B., Molau, U., Oberbauer, S., Rewa, S., Rob<strong>in</strong>son, C., Shaver, G.,<br />
Sud<strong>in</strong>g, K., Thompson, C., Tolvanen, A., Totland, O., Turner, P., Tweedie, C.,<br />
Webber, P. & Wookey, P. 2006: <strong>From</strong> The Cover: Plant community responses <strong>to</strong><br />
experimental warm<strong>in</strong>g across the <strong>tundra</strong> biome. Proceed<strong>in</strong>gs of the National<br />
Academy of Sciences of the United States of America, 103: 13421346.<br />
Washburn, A. L. 1969: Weather<strong>in</strong>g, frost action, and patterned ground <strong>in</strong> the Mesters<br />
Vig district, northeast Greenland. Denmark. Meddelelser om Grönland, 176:1303.<br />
Washburn, A. L. 1973: Periglacial processes and environment. New York, St.<br />
Mart<strong>in</strong>'s Press. 320 s.<br />
54
Recruitment along retreat<strong>in</strong>g glaciers<br />
Unni Vik 1 Ingel<strong>in</strong>n Aarnes 2 Eike Müller 3<br />
1 University of Oslo, Department of Biology, Program for Molecular Ecology and Biosystematics, 0316<br />
Oslo,NO, 2 University of Bergen, Department of Biology, Ecological and Environmental Change<br />
Research Group, 5020 Bergen, NO 3 The University Centre <strong>in</strong> <strong>Svalbard</strong>, <strong>Arctic</strong> Biology, 9171<br />
Longyearbyen, NO<br />
Abstract<br />
Glacier forelands are excellent models for study<strong>in</strong>g primary successions but relatively<br />
few have been <strong>in</strong>vestigated <strong>in</strong> the High <strong>Arctic</strong>. This study <strong>in</strong>vestigates differences <strong>in</strong><br />
the succession patterns <strong>in</strong> three bioclimatic zones on <strong>Svalbard</strong>. The species occurrence<br />
was recorded on mora<strong>in</strong>es of different ages at Nordre Frankl<strong>in</strong>breen, Mayerbreen, and<br />
Kongsbreen situated <strong>in</strong> bioclimatic zone A (<strong>Arctic</strong> <strong>polar</strong> <strong>desert</strong>), B (Northern arctic<br />
<strong>tundra</strong>) and C (Middle arctic <strong>tundra</strong>). Species composition was sampled us<strong>in</strong>g three <strong>to</strong><br />
six plots (50 x 50 cm) on each mora<strong>in</strong>e as well as by compil<strong>in</strong>g a <strong>to</strong>tal species list.<br />
The glacier forelands <strong>in</strong> bioclimatic zone B and C follow the expected succession<br />
pattern of species substitution with time. In bioclimatic zone A no clear succession<br />
pattern could be found. Species richness <strong>in</strong>creases <strong>in</strong> bioclimatic zone B and C with<br />
time whilst <strong>in</strong> bioclimatic zone A it is comparatively constant and several species<br />
occur irrespective of mora<strong>in</strong>es’ age. Additional studies of glacier foreland <strong>in</strong><br />
bioclimatic zone A are needed <strong>to</strong> confirm the generality of this pattern.<br />
Introduction<br />
<strong>Arctic</strong> areas are expected <strong>to</strong> experience major changes due <strong>to</strong> global warm<strong>in</strong>g <strong>in</strong> the<br />
com<strong>in</strong>g years (ACIA 2005). Apart from the major climate alternations (ice ages),<br />
arctic <strong>plant</strong>s must have experienced rapid climate oscillations (Brochmann & Steen<br />
1999) as they occurred more frequent than expected both with<strong>in</strong> colder and warmer<br />
stages (Taylor et al. 1993). Strategies of arctic <strong>plant</strong>s <strong>to</strong> survive and ma<strong>in</strong>ta<strong>in</strong> genetic<br />
diversity dur<strong>in</strong>g rapid changes are predom<strong>in</strong>antly those <strong>in</strong>volv<strong>in</strong>g modes of<br />
reproduction (sexual or clonal) and development of high ploidy levels.<br />
Plants have <strong>in</strong>dividualistic responses <strong>to</strong> this expected change (Erschbamer 2007). A<br />
study <strong>in</strong> the Alps revealed that pioneer species are particularly vulnerable <strong>to</strong> global<br />
warm<strong>in</strong>g (Erschbamer 2007). Walker et al. (2006) tested the responses of <strong>tundra</strong><br />
species <strong>to</strong> experimental warm<strong>in</strong>g and projected a possible loss of as much as 40% of<br />
the current <strong>tundra</strong> vegetation by 2100. It is likely that freshly deglaciated terra<strong>in</strong> will<br />
provide pioneer species with a sanctuary dur<strong>in</strong>g climate change, and conserve parts of<br />
the biodiversity <strong>in</strong> the <strong>Arctic</strong> (Moreau, submitted). If this is the case, then it is<br />
probable that arctic species which are unable <strong>to</strong> colonize mora<strong>in</strong>es are more<br />
vulnerable <strong>to</strong> climate changes.<br />
Polyploidy represents a mechanism of adaptation and speciation (Stebb<strong>in</strong>s 1971,<br />
Lumaret 1988). Estimated numbers of polyploid angiosperms are between 47% and<br />
70% (Grant 1981). The proportion of <strong>plant</strong> taxa with a higher ploidy level<br />
(polyploids) is <strong>in</strong> general show<strong>in</strong>g an <strong>in</strong>creas<strong>in</strong>g trend at higher latitudes <strong>in</strong> the<br />
55
northern hemisphere (Brochmann et al. 2004). In addition, the proportion of<br />
polyploids seems <strong>to</strong> be particularly high <strong>in</strong> previously glaciated areas. Out of the 161<br />
species <strong>in</strong>digenous <strong>to</strong> <strong>Svalbard</strong>, 78% are polyploids (Brochmann & Steen 1999). One<br />
reason for this high number is that polyploidy secures the ma<strong>in</strong>tenance of genetic<br />
diversity <strong>in</strong> marg<strong>in</strong>al and climatically unstable environments (Brochmann & Steen<br />
1999). Therefore, it can be expected that polyploid species occur more frequently on<br />
newly deglaciated terra<strong>in</strong> than diploid species.<br />
In harsh environments, such as the <strong>Arctic</strong>, with high variability <strong>in</strong> space and time,<br />
particularly <strong>in</strong> the length of the grow<strong>in</strong>g season, sexual reproduction appears <strong>to</strong> be<br />
selected for (Bliss & Gold 1999). However, it has been found that seedl<strong>in</strong>g mortality<br />
is very high on glacier forelands (Niederfr<strong>in</strong>iger et al. 2000), and thus it is possible<br />
that there is a difference <strong>in</strong> the extent of sexual reproduction amongst species that<br />
specialize <strong>in</strong> coloniz<strong>in</strong>g freshly deglaciated terra<strong>in</strong> compared <strong>to</strong> other areas <strong>in</strong> the<br />
High <strong>Arctic</strong>.<br />
The most significant characteristic of the <strong>Arctic</strong> is the absence of trees for climatic<br />
reasons (Körner 2003). In the High <strong>Arctic</strong> (bioclimatic zone A, B and C) even erect<br />
shrubs are absent. Thus, the succession <strong>in</strong> the High <strong>Arctic</strong> differs significantly from<br />
vegetation development <strong>in</strong> tree and shrubdom<strong>in</strong>ated areas. Vegetations without trees<br />
and erect shrubs can be <strong>in</strong>fluenced and altered by fac<strong>to</strong>rs more easily and have<br />
different pathways for succession depend<strong>in</strong>g on the fac<strong>to</strong>rs alter<strong>in</strong>g the development.<br />
The use of glacier forelands <strong>to</strong> study succession by substitut<strong>in</strong>g space for time is a<br />
well established approach (Matthews 1992). Primary succession <strong>in</strong> the <strong>Arctic</strong> follows<br />
patterns that are also seen <strong>in</strong> glacier forefields <strong>in</strong> Norway and the Alps (Matthews<br />
1992). Species richness <strong>in</strong>creases with time <strong>in</strong> <strong>Svalbard</strong>, despite a loss of mid<br />
successional species (Hodk<strong>in</strong>son et al. 2003). Oppositely, studies <strong>in</strong> the central Alps<br />
found that species richness reaches a peak at 4050 years and decl<strong>in</strong>es <strong>to</strong>wards the<br />
climax (Raff et al. 2006). This early peak <strong>in</strong> species richness has been observed <strong>in</strong><br />
studies conducted <strong>in</strong> Norway, the Alps (Matthews 1992) and <strong>in</strong> the Canadian <strong>Arctic</strong><br />
(bioclimatic zone C) (Jones & Henry 2003). This fall <strong>in</strong> richness after the early peak<br />
is often attributed <strong>to</strong> competition <strong>in</strong> areas where environmental conditions are<br />
favourable and ground cover is close <strong>to</strong> 100%, whilst <strong>in</strong> more severe conditions an<br />
absence of a dist<strong>in</strong>ct peak can reflect that <strong>plant</strong>s at all successional stages experience<br />
rather uniform conditions (Matthews 1992).<br />
Observations of succession on glacial forelands on <strong>Svalbard</strong> <strong>in</strong> bioclimatic zone B and<br />
C have shown that there is a clear relationship between species changes and time<br />
(Moreau, submitted). However, Jones and Henry (2003) concluded that succession<br />
may not follow the expected directional replacement of species with time <strong>in</strong> more<br />
extreme <strong>polar</strong><strong>desert</strong> environments. There have been few studies <strong>in</strong> the High <strong>Arctic</strong><br />
and so far no studies have been conducted <strong>in</strong> bioclimatic zone A.<br />
This study used glacial forelands <strong>to</strong> record primary succession patterns <strong>in</strong> three<br />
bioclimatic zones on <strong>Svalbard</strong> <strong>in</strong>vestigated whether or not species richness <strong>in</strong>creases<br />
with time <strong>in</strong> the High <strong>Arctic</strong>. Is there is a difference <strong>in</strong> the extent of sexual<br />
reproduction and polyploidy among species, occurr<strong>in</strong>g on freshly deglaciated terra<strong>in</strong><br />
than elsewhere on <strong>Svalbard</strong>?<br />
56
Figure 1. Location of the three glacier forelands and a site rich <strong>in</strong> species.<br />
Sites<br />
<strong>Svalbard</strong> is highly <strong>in</strong>fluenced by warm north Atlantic currents and is warmer than<br />
other areas at such high latitudes. The Archipelago covers several bioclimatic zones<br />
(Elvebakk 1999) and has a varied climate: The mean (19611990) July temperature<br />
varies between 1.9° – 6.5° C and the mean annual precipitation is between 190490<br />
mm (Norsk meterologisk <strong>in</strong>stitutt). There are 164 vascular species present at <strong>Svalbard</strong><br />
(Rønn<strong>in</strong>g 1996) (161 accord<strong>in</strong>g <strong>to</strong> Brochmann & Steen 1999).<br />
Three glacier forelands (Fig. 1) were studied. The three bioclimatic regions are very<br />
different <strong>in</strong> both climate and vegetation (see Tab.1 and 2). Nordre Frankl<strong>in</strong>breen <strong>in</strong><br />
Frankl<strong>in</strong>fjorden at Nordaustlandet is situated <strong>in</strong> bioclimatic zone A. With the<br />
exception of the youngest mora<strong>in</strong>e it was difficult <strong>to</strong> dist<strong>in</strong>guish <strong>in</strong>dividual mora<strong>in</strong>e<br />
ridges. Four sites were picked <strong>in</strong> this area; only the youngest mora<strong>in</strong>e was a clearly<br />
def<strong>in</strong>ed ridge. The ma<strong>in</strong> vegetation <strong>in</strong> the region is Luzula confusa <strong>polar</strong> <strong>desert</strong><br />
(Elvebakk 2005).<br />
In zone B, Mayerbreen <strong>in</strong> Krossfjorden, two lateral mora<strong>in</strong>es were studied. The young<br />
mora<strong>in</strong>e has gentle slopes and consists of bedrock with a relatively th<strong>in</strong> mora<strong>in</strong>al<br />
cover. The analysis was conducted on stable summits. The older mora<strong>in</strong>e extends <strong>to</strong><br />
approximately 100 meters above sea level and has a steep northwest fac<strong>in</strong>g slope.<br />
The ma<strong>in</strong> vegetation <strong>in</strong> the region is mesic acidic Luzula confusa <strong>tundra</strong> (Elvebakk<br />
2005)<br />
At Kongsbreen <strong>in</strong> Kongsfjorden three mora<strong>in</strong>es were studied. A very recently<br />
deglaciated mora<strong>in</strong>e, an <strong>in</strong>termediateage mora<strong>in</strong>e, that represents the glacier front <strong>in</strong><br />
1869 (Lamont 1876 <strong>in</strong> Lefauconnier 1991,) and an old mora<strong>in</strong>e. These occur with<strong>in</strong><br />
57
an enclave of bioclimatic zone C with<strong>in</strong> zone B. Cassiope tetragona <strong>tundra</strong> is the ma<strong>in</strong><br />
vegetation type (Elvebakk 2005).<br />
Colesdalen <strong>in</strong> Isfjorden is not a glacier foreland area; it is situated <strong>in</strong> bioclimatic zone<br />
C and is considered among the most species rich sites <strong>in</strong> all of <strong>Svalbard</strong>. The site was<br />
<strong>in</strong>cluded <strong>to</strong> have a diversity reference for well established, rich arctic <strong>tundra</strong><br />
vegetation. One southfac<strong>in</strong>g slope dom<strong>in</strong>ated by Cassiope tetragona was analysed.<br />
For appropriate comparison 9 out of 22 plots were used.<br />
Table 1. Characteristics of study sites <strong>in</strong>clud<strong>in</strong>g ma<strong>in</strong> vegetation types.<br />
Vegetation Type<br />
Estimated<br />
distance <strong>to</strong> Bioclimatic<br />
Site Slope of Mora<strong>in</strong>e<br />
(Elvebakk, 2005)<br />
Glacier* Zone Date<br />
Nordre<br />
Frankl<strong>in</strong>breen<br />
Northwest Luzula confusa Polar Desert 300 m 1200 m A 20.07.2007<br />
Mayerbreen Southwest Luzula confusa Mesic acidic Tundra 300 m 650 m B 17.07.2007<br />
Kongsbreen South / southwest Cassiope tetragona Tundra 800 m 2500 m C 21.07.2007<br />
*Distances estimated us<strong>in</strong>g ArcGIS, lowest number represents the distance from the youngest mora<strong>in</strong><br />
<strong>to</strong> tha glacier, highest the distance <strong>to</strong> plots <strong>in</strong> established vegetation.<br />
Table 2. Overview of all sites studied <strong>in</strong> the survey and coord<strong>in</strong>ates of sample plot areas.<br />
Site Abbreviation Location (UTM)<br />
Altitude<br />
(masl) Age # Plots<br />
Nordre<br />
Frankl<strong>in</strong>breen<br />
N1 33x 0588861/8901802 53 Younger mora<strong>in</strong>e 3<br />
Nordre<br />
Frankl<strong>in</strong>breen<br />
N2 33x 0588725/8901772 57 Older mora<strong>in</strong>e 3<br />
Nordre<br />
Frankl<strong>in</strong>breen<br />
N3** 33x 0588282/8901964 23<br />
Established vegetation with<br />
nutrient <strong>in</strong>put<br />
<br />
Nordre<br />
Frankl<strong>in</strong>breen<br />
N4 33x 0587985/8901644 12 Established vegetation 3<br />
Mayerbreen M1 33x 0440859/8800766 25 Younger mora<strong>in</strong>e 5<br />
Mayerbreen M2* 33x 0440870/8800608 87 Older mora<strong>in</strong>e 3<br />
Mayerbreen M3* 33x 0440825/8800578 100 Older mora<strong>in</strong>e 4<br />
Kongsbreen K1 33x 0447365/8761710 22 Young mora<strong>in</strong>e 3<br />
Kongsbreen K2** 33x 0446509/8761654 47 Young mora<strong>in</strong>e <br />
Kongsbreen K3 33x 0445660/8762902 120 Intermediate mora<strong>in</strong>e 3<br />
Kongsbreen K4 33x 0445378/8763388 70 Established vegetation 3<br />
*At these two sites sample plots were taken but occur <strong>in</strong> the <strong>to</strong>tal species list as one site, ** Recorded<br />
at the <strong>to</strong>tal species list as separate site but no plots analysed<br />
58
Methods<br />
The vegetation was analysed with the <strong>in</strong>tercept po<strong>in</strong>t frame analysis (Bråthen &<br />
Hageberg 2004). At each site a number between three and six plots were analyzed<br />
us<strong>in</strong>g a 50 x 50 cm steel frame with a grid of 10 cm. Vascular <strong>plant</strong>s were recorded at<br />
25 cross sections of the grid, x. The plots were distributed randomly with<strong>in</strong> a specified<br />
homogenous vegetation unit. The overall vegetation cover <strong>in</strong>clud<strong>in</strong>g vascular <strong>plant</strong>s,<br />
bryophytes, lichens, cryp<strong>to</strong>gram crust and bare ground was estimated by eye on a ten<br />
percent step scale. Additionally, all species present at each site were recorded. Plant<br />
communities were visually evaluated and all <strong>plant</strong> species grow<strong>in</strong>g with<strong>in</strong> the<br />
homogenous communities were listed. The size of the homogenous areas varied<br />
depend<strong>in</strong>g on <strong>plant</strong> composition <strong>in</strong> the communities. Small scale changes <strong>in</strong> <strong>plant</strong><br />
communities result<strong>in</strong>g from microhabitats produce m<strong>in</strong>or dissimilarities, which were<br />
accepted with<strong>in</strong> homogenous areas.<br />
To obta<strong>in</strong> an approximate chronological control of the mora<strong>in</strong>es, aerial pho<strong>to</strong>s, maps<br />
with dated tem<strong>in</strong>al positions and lichenometry were used. Lichenometry is based on<br />
the assumption that the growth rate of crus<strong>to</strong>se lichen species (most often<br />
Rhizocarpon rhizocarpon) has a l<strong>in</strong>ear relationship with time (Matthews 1992), i.e.<br />
larger thalli are older than smaller ones. Growth curves have been constructed for<br />
many areas as the growth pattern varies <strong>in</strong> different areas (Bradwell and Armstrong<br />
2007). Growth curves are made by measur<strong>in</strong>g lichens grow<strong>in</strong>g on substrates of known<br />
ages, for example graves<strong>to</strong>nes (Matthews 1992). If crus<strong>to</strong>se lichen is found on the<br />
surface be<strong>in</strong>g studied, an age estimate can be made. In this study the mean of the five<br />
largest thalli of Rhizocarpon found on each site were compared <strong>to</strong> the local lichen<br />
growth curve for NorthWest Spitsbergen (Werner 1991).<br />
To compare <strong>plant</strong> diversity between sites the alpha (i.e. species richness) diversity of<br />
vascular <strong>plant</strong>s as described <strong>in</strong> Whittaker (1972) was calculated us<strong>in</strong>g presents/<br />
absence data. Additionally, the Shannon’s diversity <strong>in</strong>dex H and the species evenness<br />
(Shannon’s evenness <strong>in</strong>dex also known as Pielou's evenness <strong>in</strong>dex) were computed<br />
(see Tab. 3). For the derivation of Shannon’s <strong>in</strong>dex frequency data of the <strong>in</strong>tercept<br />
po<strong>in</strong>t frame analysis and the program PAST was applied (Hammer & Harper 2003).<br />
The different numbers of plots recorded at each site resulted <strong>in</strong> an unbalanced design,<br />
for data analysis only data of the first three recorded plots at each site were used. With<br />
a small number of plots recorded at each site, plot data were applied only for<br />
calculat<strong>in</strong>g α diversity, Shannon’s H and E <strong>in</strong>dices.<br />
Observed frequencies of polyploid and diploid species as well as clonal and sexual<br />
reproduction were compared <strong>to</strong> the data from <strong>Svalbard</strong> (Brochmann & Steen 1999)<br />
us<strong>in</strong>g the Gtest for reasonable size (see Tab. 3). For analys<strong>in</strong>g diploid and polyploid<br />
ratios as well as sexual and clonal ratios, the <strong>to</strong>tal species list of each site has been<br />
used. The property of each species (polyploidy, reproduction mode) was derived from<br />
Brochmann & Steen’s (1999). Data for comparison were derived from Hodk<strong>in</strong>son et<br />
al. (2003).<br />
Spearmanss rankorder correlation was chosen <strong>to</strong> analyse the relationships between<br />
<strong>plant</strong> succession stage, ploidy, and reproduction mode. S<strong>in</strong>ce this is a test requir<strong>in</strong>g an<br />
approximately cont<strong>in</strong>uous scale, data were tested apply<strong>in</strong>g the KolmogorvSmirnov<br />
Test. Calculations and tests were made us<strong>in</strong>g the software package SPSS 10.0.1.<br />
59
Table 3. Formulas of the different applied <strong>in</strong>dices (nnumber of <strong>in</strong>dividuals, Snumber of<br />
species, N<strong>to</strong>tal numbers of <strong>in</strong>dividuals and prelative abundance of each species) and<br />
Gtest (Oi is the frequency observed <strong>in</strong> a cell, E is the frequency expected on the null<br />
hypothesis)<br />
Test/ Index Formula<br />
Shannon Index H H ' = − ∑<br />
Species Evenness E<br />
GTest<br />
60<br />
S<br />
i = 1<br />
pi ln pi<br />
H '<br />
E =<br />
H ' max<br />
∑<br />
G =<br />
2 Oi o ln( Oi / Ei )<br />
i
Results<br />
Succession<br />
Nordre Frankl<strong>in</strong>fjorden – bioclimatic zone A<br />
Cerastium regelii and Saxifraga oppositifolia are found only on the earliest mora<strong>in</strong>e.<br />
No species grow exclusively on the <strong>in</strong>termediate stage surface. Saxifraga foliolosa<br />
and S. rivularis are present <strong>in</strong> both <strong>in</strong>termediate and mature vegetation assemblages.<br />
Cardam<strong>in</strong>e bellidifolia and Luzula confusa are found on all mora<strong>in</strong>es, whilst Papaver<br />
dahlianum as well as Stellaria longipes appear on three of four sites surveyed.<br />
Mayerbreen – bioclimatic zone B<br />
The very early colonizers on the young mora<strong>in</strong>e but not present on the <strong>in</strong>termediate<br />
stage surface are Draba alp<strong>in</strong>a, D. nivalis, Phippsia algida, Saxifraga oppositfolia,<br />
and Trisetum spicatum. Many species are present on both the early mora<strong>in</strong>e and <strong>in</strong> the<br />
<strong>in</strong>termediate mora<strong>in</strong>e such as Cochlearia groenlandica, Draba corymbosa, Luzula<br />
confusa, Oxyria digyna, Poa alp<strong>in</strong>a, Poa arctica, Saxifraga cernua, S. cespi<strong>to</strong>sa, S.<br />
hyperborea, S. nivalis, S. rivularis and Stellaria longipes. Only a few species are<br />
exclusively present on the <strong>in</strong>termediate vegetation, such as Draba lactea, D.<br />
oxycarpa, and Papaver dahlianum. Noteworthy absences <strong>in</strong> the <strong>in</strong>termediate stage are<br />
the otherwise ubiqui<strong>to</strong>us Saxifraga oppostitifolia and Salix <strong>polar</strong>is, which were not<br />
recorded at Mayerbreen at all.<br />
Due <strong>to</strong> the <strong>in</strong>stability of the steeply sloped <strong>in</strong>termediate/older mora<strong>in</strong>e the vegetation<br />
was very patchy, which consisted of gramnoids and pioneers.<br />
Kongsbreen – bioclimatic zone C<br />
At Kongsbreen the early colonizers were Braya purpurascens, Draba nivalis, D.<br />
subcapitata, Papaver dahlianum, Sag<strong>in</strong>a nivalis, Saxifraga aizoides, S. cespi<strong>to</strong>sa, S.<br />
oppositifolia and Silene uralensis. Only Draba spp., Sag<strong>in</strong>a nivalis and Silene<br />
uralensis grow exclusively on the young mora<strong>in</strong>es, while Braya purpurascens,<br />
Cerastium arcticum, and Saxifraga cespi<strong>to</strong>sa persist <strong>in</strong> the <strong>in</strong>termediate stages.<br />
Several species have been found only on <strong>in</strong>termediate mora<strong>in</strong>es (Cochlearia<br />
groenlandica, Draba arctica, D. corymbosa, Silene furcata and Saxifraga nivalis) or<br />
mature vegetation (Arenaria pseudofrigida, Bis<strong>to</strong>rta vivipara, Carex nard<strong>in</strong>a,<br />
Cassiope tetragona, Dryas oc<strong>to</strong>petala, Luzula nivalis, Silene acaulis and Trisetum<br />
spicatum). Some species are ubiqui<strong>to</strong>us at all successional stages and present on<br />
mora<strong>in</strong>es of all ages. Saxifraga oppositifolia and Salix <strong>polar</strong>is are present on the<br />
earliest mora<strong>in</strong>e and persist, albeit less abundantly, <strong>in</strong> the climax vegetation of Dryas<br />
Cassiope heath.<br />
Diversity<br />
To get a general impression of the <strong>in</strong>crease <strong>in</strong> species from younger <strong>to</strong> older stages of<br />
the succession at all mora<strong>in</strong>es, the species numbers (alpha diversity) of the different<br />
bioclimatic zones are compared (Fig. 2a, b). It is evident (Fig. 2a) that the number of<br />
plots analysed were not sufficient as only the curve for cumulative species numbers<br />
for Nordre Frankl<strong>in</strong>breen flattens off. A nonflatted curve <strong>in</strong>dicates that the whole<br />
range of diversity were not present <strong>in</strong> the plots that were sampled at Mayerbreen and<br />
Kongsbreen.<br />
61
Figure 2. a: Cumulative number of species observed with the po<strong>in</strong>t <strong>in</strong>tercept frame surveys,<br />
every dot is a succeed<strong>in</strong>g plot. b: alpha diversity of different succession stadiums at<br />
three glacier forefields.<br />
In early pioneer stages the species numbers are low <strong>to</strong> zero (Fig. 2b). None or a very<br />
few vascular <strong>plant</strong>s and few scattered bryophytes were observed at the very recently<br />
deglaciated mora<strong>in</strong>es. At these young mora<strong>in</strong>es small streams seem <strong>to</strong> be important<br />
for start<strong>in</strong>g <strong>plant</strong> establishment. They offer numerous microhabitats that facilitates the<br />
establishment of pioneer <strong>plant</strong>s. Intermediate and older stages are characterised by an<br />
<strong>in</strong>crease <strong>in</strong> species numbers and greater <strong>plant</strong> cover. The cumulative number of<br />
species per plot <strong>in</strong>creased cont<strong>in</strong>uously except on an older mora<strong>in</strong>e at Nordre<br />
Frankl<strong>in</strong>sbreen (fig 2a). In bioclimatic zone B and C (Mayerbreen, Kongsbreen)<br />
species numbers <strong>in</strong>crease very little from <strong>in</strong>termediate <strong>to</strong> old stages (Fig. 2b). This<br />
pattern was not found <strong>in</strong> bioclimatic zone A, where species showed the greatest<br />
<strong>in</strong>crease from <strong>in</strong>termediate <strong>to</strong> old mora<strong>in</strong>es. Additionally, all stages <strong>in</strong> zone A are very<br />
similar <strong>in</strong> their species composition.<br />
Besides the <strong>in</strong>crease <strong>in</strong> species from younger <strong>to</strong> older stages, a highly significant<br />
correlation between the mora<strong>in</strong>e’s age and <strong>plant</strong> cover was observed (Fig. 3a).<br />
62
Figure 3. a: Total <strong>plant</strong> cover aga<strong>in</strong>st estimated age of the mora<strong>in</strong>es Spearman’s rank order<br />
correlation coefficient 0.758, significant at the 0.001 level, Rsq=0,79 b: Shannon <strong>in</strong>dex<br />
and species evenness for Colesdalen, Mayerbreen, Nordre Frankl<strong>in</strong>breen and<br />
Kongsbreen<br />
Although Mayerbreen is situated <strong>in</strong> the bioclimatic zone B, the mora<strong>in</strong>es have a<br />
higher alpha diversity than other mora<strong>in</strong>es <strong>in</strong> this study. The species evenness E and<br />
the Shannon <strong>in</strong>dex H differs little from Colesdalen, one of the richest places <strong>in</strong> flora<br />
on <strong>Svalbard</strong> situated <strong>in</strong> bioclimatic zone C (fig 3b). The lowest <strong>in</strong>dex as well as the<br />
lowest evenness was calculated for Nordre Frankl<strong>in</strong>sbreen which reflects the<br />
dom<strong>in</strong>ance of Luzula confusa and the low number of species and their scattered<br />
distribution.<br />
The glacier forefields of the colder arctic zones (A, B) favoured generalist species<br />
(Fig. 4). In bioclimatic zone A early colonizers are still present <strong>in</strong> later succession<br />
stages, whereas <strong>in</strong> bioclimatic zone C early colonizers are almost absent from well<br />
developed, closed communities. The high proportion of species present at both<br />
younger and older sites <strong>in</strong> bioclimatic zone B <strong>in</strong>dicates a high similarity or a failure <strong>to</strong><br />
visually classify the age of the mora<strong>in</strong>es and successional stage correctly.<br />
63
Figure 4. Presence and absence of all species observed <strong>in</strong> this study on glacier forefields. Species abbreviations consist of first the three genus and first three<br />
species letters<br />
64
Ploidy<br />
The frequencies of diploid/ polyploid species occurr<strong>in</strong>g on each mora<strong>in</strong>e have been<br />
plotted aga<strong>in</strong>st the estimated age of the mora<strong>in</strong>e (Fig 5a). The age of the mora<strong>in</strong>es and<br />
the number of polyploidy species are not significantly correlated. Nevertheless, the<br />
data <strong>in</strong>dicate a slight trend <strong>to</strong> a lower frequency of polyploids on older mora<strong>in</strong>es.<br />
Hodk<strong>in</strong>son et al. (2003) found a highly significant correlation (Tab. 4) for a lower<br />
level of polyploid species <strong>in</strong> older succession stages at glacier forefields (Fig 5b). A<br />
slight nonsignificant trend <strong>to</strong>wards a larger number of polyploids at glacier forefields<br />
was found from bioclimatic zone C <strong>to</strong> A (data not shown).<br />
Figure 5. a: Part of polyploid <strong>plant</strong>s <strong>in</strong> percent aga<strong>in</strong>st the estimated age of the mora<strong>in</strong>es own<br />
survey Rsq=0.16 b: part of polyploidy <strong>plant</strong>s aga<strong>in</strong>st radiocarbon dated mora<strong>in</strong>es<br />
derived from Hodk<strong>in</strong>son et al. (2003) Rsq=0.88.<br />
A Gtest of the diploid/ polyploid frequencies between frequencies on mora<strong>in</strong>es<br />
observed <strong>in</strong> this study and published frequencies from all <strong>plant</strong>s present <strong>in</strong> <strong>Svalbard</strong><br />
(Brochmann & Steen 1999) revealed that the frequencies observed from the authors<br />
and frequencies from all <strong>plant</strong>s <strong>in</strong> <strong>Svalbard</strong> show no differences (p value 0.15; error<br />
probability 0.05). Exception is one observed frequency (Kongsbreen climax stage)<br />
which has been compared <strong>to</strong> the frequency of all <strong>plant</strong>s <strong>in</strong> <strong>Svalbard</strong>; this frequency<br />
differs significant from the frequency of all <strong>plant</strong>s <strong>in</strong> <strong>Svalbard</strong> (p value 0.012)<br />
Table 4. Correlations between estimated age of mora<strong>in</strong>es ground cover, ploidylevel, and sexual<br />
reproduction. AGE_ESTestimated age, ploidy%percentage of polyploid <strong>plant</strong>s,<br />
sexual%percentage of sexual reproduc<strong>in</strong>g <strong>plant</strong>s. First row own data, second row data<br />
Hodk<strong>in</strong>son et al. (2003).<br />
ploidy % sexual %<br />
Age estimation Correlation Coefficient 226 630<br />
Significance. (2tailed) 530 51<br />
Number 10 10<br />
Age estimation Correlation Coefficient 0,919** ,986**<br />
Significance. (2tailed) 3 0<br />
Number 7 6<br />
** Correlation is significant at the 0.01 level<br />
Reproduction<br />
No significant correlation was found between the age of the mora<strong>in</strong>es and the mode of<br />
reproduction (Fig. 6a) but the frequency of sexually reproduc<strong>in</strong>g <strong>plant</strong>s is higher <strong>in</strong><br />
younger mora<strong>in</strong>es. These f<strong>in</strong>d<strong>in</strong>gs are supported by the data of Hodk<strong>in</strong>son et al.<br />
65
(2003), from which a highly significant correlation between proportion of sexual<br />
reproduc<strong>in</strong>g <strong>plant</strong>s and the age of the succession has been calculated (see Tab. 4). A<br />
higher proportion of <strong>plant</strong> species on younger mora<strong>in</strong>es reproduce sexually than on<br />
older terra<strong>in</strong>, where the number of clonally reproduc<strong>in</strong>g species <strong>in</strong>creases (Fig 6b).<br />
Figure 6. a: Plot of sexual reproducer aga<strong>in</strong>st the estimated age of the mora<strong>in</strong>es own survey<br />
Rsq=0.33 b: plot of sexual reproducer aga<strong>in</strong>st radiocarbon dated mora<strong>in</strong>es Hodk<strong>in</strong>son<br />
et al. (2003) Rsq=0.95<br />
The frequency of species ma<strong>in</strong>ly reproduc<strong>in</strong>g sexually tended <strong>to</strong> be higher <strong>in</strong> warmer<br />
zones than <strong>in</strong> colder zones (data not shown). A Gtest demonstrates that the overall<br />
observed frequency for <strong>plant</strong>s on glacier forefields is not the same as for all <strong>plant</strong>s<br />
found <strong>in</strong> <strong>Svalbard</strong> (null hypothesis rejected). A smaller proportion of <strong>plant</strong>s grow<strong>in</strong>g<br />
<strong>in</strong> glacier forefields reproduce clonally than all <strong>plant</strong>s known <strong>to</strong> <strong>Svalbard</strong>.<br />
Discussion<br />
Succession and diversity<br />
The observed vegetation pattern and biodiversity level at the different mora<strong>in</strong>es <strong>in</strong><br />
bioclimatic zone B and C are generally congruent <strong>to</strong> earlier studies <strong>in</strong> high arctic areas<br />
(Moreau submitted, Moreau 2005, Hodk<strong>in</strong>son 2003, Jones & Henry 2003). At all<br />
bioclimatic zones (AC) <strong>in</strong> the early stages Saxifraga spp. are frequent. The members<br />
of the Brassicacea family, <strong>in</strong> particular the genera Draba and Cardam<strong>in</strong>e, are less<br />
frequent but a constant part of the pioneer vegetation. Early pioneers were found <strong>to</strong> be<br />
the same as postulated by the mentioned authors (see results Fig. 5). Succession stages<br />
<strong>in</strong> zone C and B clearly differ <strong>in</strong> species composition with time, whilst zone A did not<br />
show the expected species substitution with time pattern.<br />
At both Kongsfjorden and Mayerbreen a species substitution succession occurs. This<br />
follows the general pattern expected <strong>in</strong> glacier forelands both <strong>in</strong> Europe (Matthews<br />
1992), and <strong>Svalbard</strong> (Moreau submitted, Moreau 2005 and Hodk<strong>in</strong>son et al. 2003).<br />
There are typical early colonizers like the widespread species Saxifraga oppositifolia<br />
as well as species like Sag<strong>in</strong>a nivalis and Draba spp. (Fig. 5). These species specialize<br />
<strong>in</strong> colonis<strong>in</strong>g fresh mora<strong>in</strong>es but are unable <strong>to</strong> persist <strong>in</strong> the <strong>in</strong>termediate and mature<br />
vegetation. It is difficult <strong>to</strong> estimate for certa<strong>in</strong> why these species are unable <strong>to</strong> persist<br />
<strong>in</strong> the <strong>in</strong>termediate stage mora<strong>in</strong>es as these are still open communities and have<br />
66
patchy vegetation so competition is not likely <strong>to</strong> be a fac<strong>to</strong>r. Hodk<strong>in</strong>son et al. (2003)<br />
found that there were changes over time with <strong>in</strong>creas<strong>in</strong>g soil organic matter, nitrogen<br />
and soil moisture as well as a decreas<strong>in</strong>g soil pH. The niche of these species can be<br />
related <strong>to</strong> all of these environmental variables.<br />
Several species are typical at <strong>in</strong>termediate stage mora<strong>in</strong>es, like Papaver dahlianum<br />
and Saxifraga spp., which do not appear <strong>in</strong> the more mature vegetation stage. This<br />
species substitution/ reduction can be related <strong>to</strong> the species demand for open areas or<br />
<strong>in</strong>terspecies competition, as <strong>in</strong> bioclimatic zone B and C <strong>in</strong> more developed stages the<br />
vegetation cover gets more dens. Similar, few early colonizers have been found with<strong>in</strong><br />
climax (e.g. Dryas oc<strong>to</strong>petala and Cassiope tetragona <strong>tundra</strong> communities),<br />
<strong>in</strong>dicat<strong>in</strong>g that they are poor competi<strong>to</strong>rs. In the stable vegetation of the Dryas –<br />
Cassiope heath communities on old mora<strong>in</strong>es at Kongsbreen, particularly, Draba spp.<br />
were not observed, which suggests that <strong>in</strong> stable climax vegetation the pioneer species<br />
might be out competed. The species that only appear at a s<strong>in</strong>gle stage may, <strong>to</strong> lesser or<br />
greater extent, represent specialist of particular habitats, although species like<br />
Cassiope tetragona are very widespread <strong>in</strong> <strong>Svalbard</strong> (www.svalbardflora.net).<br />
Some species are ubiqui<strong>to</strong>us, appear <strong>in</strong> all succession stages and are present on<br />
mora<strong>in</strong>es of all ages. Saxifraga oppositifolia and Salix <strong>polar</strong>is occur on the earliest<br />
mora<strong>in</strong>es and persist, less dom<strong>in</strong>ant, <strong>in</strong> the climax vegetation. S. <strong>polar</strong>is and S.<br />
oppositifolia as well as Luzula confusa (only <strong>in</strong> zone A and B) are seen as widespread<br />
(Moreau submitted, Hodk<strong>in</strong>son et al. 2003).<br />
At Mayerbreen the absence of the widespread S. oppostitifolia, and S. <strong>polar</strong>is is<br />
noteworthy and cannot be expla<strong>in</strong>ed with its steepness. S<strong>in</strong>ce both species are among<br />
the earliest colonizers on mora<strong>in</strong>es and thus must have a high degree of <strong>to</strong>lerance for<br />
disturbance. It may be related <strong>to</strong> other reasons as soil or a simple observation bias or<br />
<strong>to</strong> chance events. The steepness of the mora<strong>in</strong>e is the reason for the high species<br />
richness. The patchy slope caused by erosion seems <strong>to</strong> create many different micro<br />
habitats. Although situated <strong>in</strong> bioclimatic zone B the Shannon’s diversity <strong>in</strong>dex and<br />
the species evenness are similar <strong>to</strong> Colesdalen, with a rich flora <strong>in</strong> bioclimatic zone C<br />
(Alsos et al. 2004).<br />
At the Nordre Frankl<strong>in</strong>breen the succession development is very different from the<br />
general pattern seen <strong>in</strong> Kongsfjorden, Mayerbreen and also <strong>in</strong> the studies conducted at<br />
other glacier forelands <strong>in</strong> <strong>Svalbard</strong> (Moreau submitted, Moreau 2005 and Hodk<strong>in</strong>son<br />
et al. 2003). There is no clear species succession with time visible <strong>in</strong> the record, and<br />
many species appear <strong>in</strong> all stages seem<strong>in</strong>gly <strong>in</strong>dependent of the time fac<strong>to</strong>r. Polar<br />
<strong>desert</strong>s and semi<strong>desert</strong>s are marg<strong>in</strong>al for establishment of vascular <strong>plant</strong>s (Svoboda &<br />
Henry 1987), a major landscape feature of bioclimatic zone A. Obvious <strong>in</strong> the glacier<br />
foreland of Nordre Frankl<strong>in</strong>sbreen is that the <strong>plant</strong>s are scattered even at older<br />
mora<strong>in</strong>es and the vegetation consists of small patches.<br />
One mature site (N3) is clearly set apart <strong>in</strong> the Norde Frankl<strong>in</strong>breen foreland. Many<br />
species are present here that are absent elsewhere on this foreland However, this site<br />
is <strong>in</strong>fluenced by higher nutrient availability as there are small ponds with several eider<br />
ducks (Somateria mollissima) as well as re<strong>in</strong>deer (Rangifer tarandus platyrhynchus)<br />
judg<strong>in</strong>g from the dropp<strong>in</strong>gs present.<br />
67
The <strong>in</strong>termediate stages seem <strong>to</strong> have many specialized species <strong>in</strong> all sites with the<br />
exception of Nordre Frankl<strong>in</strong>breen where no particular species are on this stage. There<br />
is no overlap <strong>in</strong> the species that occur <strong>in</strong> the <strong>in</strong>termediate stage at both Mayerbreen<br />
and Kongsfjorden. Many species occur at <strong>in</strong>termediate stage <strong>in</strong> Kongsfjorden and at<br />
both stages <strong>in</strong> the Mayerbreen foreland. It is possible that this is related <strong>to</strong><br />
Mayerbreen’s <strong>in</strong>termediate stage mora<strong>in</strong>e be<strong>in</strong>g very steep and unstable. However,<br />
this can be evaluated as unlikely because most species present at more or less newly<br />
deglaciated terra<strong>in</strong> are generally adapted <strong>to</strong> a high disturbance regime. Another<br />
possible explanation is that the early mora<strong>in</strong>e at Mayerbreen may be slighlty older<br />
than the early mora<strong>in</strong>e <strong>in</strong> Kongsfjorden so that a direct comparison between them is<br />
complicated.<br />
As <strong>in</strong>dicated <strong>in</strong> the results chapter <strong>in</strong> the development of the <strong>plant</strong> communities (see<br />
Fig. 4) <strong>in</strong> bioclimatic zones A and B a higher number of widespread species occur <strong>in</strong><br />
both zones. And thus the glacier forelands <strong>in</strong> the colder arctic zones (A and B) are<br />
thought <strong>to</strong> favour generalist species.<br />
Polyploidy<br />
Hybridization and polyploidy generate new races and species, some which become<br />
adapted <strong>to</strong> the new conditions <strong>in</strong> regions vacated by ice (Brochmann et al. 2004). The<br />
frequency of polyploids <strong>in</strong>creases with latitude <strong>in</strong> the northern hemisphere and the<br />
proportion of polyploids is particulary high <strong>in</strong> previous glaciated areas (Brochmann &<br />
Steen 1999). In the <strong>Arctic</strong> polyploidy secures stable reproduction and ma<strong>in</strong>tenance of<br />
genetic diversity <strong>in</strong> marg<strong>in</strong>al and climatically unstable environments (Brochmann &<br />
Steen 1999). Our study spans from bioclimatic zone C <strong>in</strong> south (Kongsbreen) up <strong>to</strong><br />
the northern bioclimatic zone A at Nordre Frankl<strong>in</strong>breen and <strong>in</strong>cludes mora<strong>in</strong>es of<br />
different ages. The data obta<strong>in</strong>ed dur<strong>in</strong>g the study did not give any significant<br />
correlations on the polyploidy proportion <strong>in</strong>creas<strong>in</strong>g with neither bioclimatic zone nor<br />
with the age of mora<strong>in</strong>es. However, they show a trend <strong>to</strong>wards an <strong>in</strong>creas<strong>in</strong>g number<br />
of polyploid species with latitude, <strong>in</strong> accordance <strong>to</strong> studies of Brochmann et al.<br />
(2004), Brochmann & Steen (1999) and Stebb<strong>in</strong>s (1984). The high significant<br />
correlations calculated from data derived from Hodk<strong>in</strong>son at al. (2003) supports the<br />
trends mentioned above and also the hypothesis of Stebb<strong>in</strong>s (1985) that polyploids are<br />
more successful than diploids <strong>in</strong> coloniz<strong>in</strong>g terra<strong>in</strong> after deglaciation.<br />
Additionally, the result of the Gtest supports the above mentioned hypothesis. In<br />
particular the observed frequencies at the climax vegetation of Kongsbreen, which<br />
show a significantly different poly/ diploid ratio than glacier forefield’s pioneer<br />
vegetation, confirm that polyploidy is the strategy of choice <strong>in</strong> such environments.<br />
Reproduction<br />
Most species found <strong>in</strong> <strong>Svalbard</strong> have mixed reproductive systems with vary<strong>in</strong>g<br />
frequencies of asexuality, sexual reproduction via selfpoll<strong>in</strong>ation, and “normal”<br />
sexuality via crosspoll<strong>in</strong>ation (Brochmann & Steen 1999), although 97 of the 161<br />
species are ma<strong>in</strong>ly sexual reproducers (Brochmann & Steen 1999). However, a Gtest<br />
revealed that the observed <strong>plant</strong>s <strong>in</strong> glacier forefields have not the same frequencies of<br />
reproduction modes as the sum of all <strong>plant</strong>s found <strong>in</strong> <strong>Svalbard</strong>. In addition, the trend<br />
<strong>to</strong>wards higher sexual reproduction <strong>in</strong> younger succession, which is confirmed by the<br />
correlation calculated from Hodk<strong>in</strong>son’s data (Hodk<strong>in</strong>son et al. 2003), suggests that a<br />
sexual reproduction strategy is advantageous for <strong>plant</strong> establishment on mora<strong>in</strong>es. The<br />
68
frequency of sexual reproduction of <strong>plant</strong>s at glacier forfields appears <strong>to</strong> be higher<br />
than the <strong>Svalbard</strong> average. It is likely that the number of species reproduc<strong>in</strong>g sexual<br />
on glacier forefields is higher because seeds are able <strong>to</strong> survive harder conditions,<br />
have a greater advantage <strong>in</strong> establishment and dispersal.<br />
The observed trend <strong>to</strong>wards lower frequencies of sexual reproduction <strong>in</strong> colder<br />
climates can be either expla<strong>in</strong>ed by the limited resources, which have <strong>to</strong> be allocated<br />
for sexual reproduction or shortcom<strong>in</strong>gs <strong>in</strong> this reproduction strategy (lack of<br />
poll<strong>in</strong>a<strong>to</strong>rs, establishment rate of seeds extremely low, lack of mature seeds because<br />
of season length or low temperature).<br />
Climate change<br />
How <strong>plant</strong> communities and succession will react <strong>to</strong> climate change is difficult <strong>to</strong><br />
predict, as there is a highly complex <strong>in</strong>teraction between species ecological amplitude<br />
and competition. The only possibility is <strong>to</strong> formulate assumptions about presence and<br />
absence <strong>in</strong> future <strong>plant</strong> communities. However, it is important <strong>to</strong> postulate which<br />
species are most vulnerable <strong>to</strong> climate change <strong>in</strong> high arctic areas. The chance is given<br />
that glacier forelands can become refugia for high arctic species that are highly<br />
adapted <strong>to</strong> cold climates and as such will probably suffer because of the predicted<br />
global warm<strong>in</strong>g. Therefore, the species with a northerly distribution that are rare and<br />
<strong>in</strong> addition not able <strong>to</strong> colonize newly deglaciated terra<strong>in</strong> are likely <strong>to</strong> be the species<br />
most vulnerable <strong>to</strong> climate change.<br />
By us<strong>in</strong>g data from glacier foreland studies it is possible <strong>to</strong> dist<strong>in</strong>guish which species<br />
are limited <strong>to</strong> colonize glacier forelands. By compar<strong>in</strong>g this <strong>to</strong> the species that are<br />
found <strong>in</strong> bioclimatic zone A (Elven et al. 2003), with distribution on <strong>Svalbard</strong><br />
(<strong>Svalbard</strong>flora.net 2007) as well as a narrow circum<strong>polar</strong> distribution (Hultèn 1962) it<br />
was found that the follow<strong>in</strong>g species could potentially be most vulnerable <strong>to</strong> climate<br />
change <strong>in</strong> <strong>Svalbard</strong>: Alopecurus borealis, Draba norvegica, Eutrema edwardsii,<br />
Festuca hyperborea, M<strong>in</strong>uartia rossii, Poa abbreviata ssp. abbreviate, Potentilla<br />
pulchella ssp. pulchella, Ranunculucs nivalis and Saxifraga hirculus. However,<br />
Alopecurus borealis, Draba norvegica, Eutrema edwvadsii, M<strong>in</strong>uartia rossii,<br />
Potentilla pulchella, and Ranunculus nivalis are more widespread on <strong>Svalbard</strong> than<br />
the other species mentioned. are more or less common <strong>in</strong> other areas than <strong>Svalbard</strong><br />
and are not considered <strong>to</strong> be particularly vulnerable on a circum<strong>polar</strong> basis. M<strong>in</strong>uartia<br />
rossii is on the red list of <strong>Svalbard</strong> and already a vulnerable species on the<br />
archipelago. It has a wide distribution (rang<strong>in</strong>g from bioclimatic zone AE) and<br />
therefore difficult <strong>to</strong> predict how it will respond <strong>to</strong> an <strong>in</strong>crease <strong>in</strong> temperature. Festuca<br />
hyperborea and Poa abbreviata have a more narrow distribution and are not<br />
particularly thermophilic. An <strong>in</strong>crease <strong>in</strong> temperature may put these species at risk, <strong>in</strong><br />
particular Festuca hyperborea which already is on the red list of <strong>Svalbard</strong>.<br />
Conclusion<br />
Glacier forelands are excellent places for study<strong>in</strong>g primary succession by substitut<strong>in</strong>g<br />
space for time. The glacier forefield <strong>in</strong> bioclimatic zone A did not show the expected<br />
species substitution with time succession pattern. Instead many species occurred<br />
irrespective of the relative ages of the mora<strong>in</strong>es. Whereas species substitution dur<strong>in</strong>g<br />
succession follows general patterns <strong>in</strong> the arctic bioclimatic zones B and C. There is a<br />
significant difference <strong>in</strong> the extent of sexual reproducers <strong>in</strong> this study compared <strong>to</strong><br />
69
<strong>Svalbard</strong> <strong>in</strong> general. Moreover polyploidy frequencies are slightly higher <strong>in</strong> northern<br />
bioclimatic zones and on younger mora<strong>in</strong>es.<br />
References<br />
Alsos, I. G., Westergaard, K., Lund, L. & Sandbakk B. E. 2004: Floraen i Colesdalen.<br />
Blyttia 62, 142150<br />
<strong>Arctic</strong> Climate Impact Assessment 2005: Cambridge University Press<br />
Bliss, L. C. & Gold, W. G. 1999: Vascular <strong>plant</strong> reproduction, establishment, and<br />
growth and the effects of cryp<strong>to</strong>grammic crusts with<strong>in</strong> <strong>polar</strong> <strong>desert</strong> ecosystems,<br />
Devon Islands, N. W. T., Canada. Canadian Journal of Botany 77, 623636<br />
Bradwell, T., Armstrong, R. A. 2007: Growth rates of Rhizocarpon geographicum<br />
lichens: a review with new data from Iceland. Journal of Quaternary Science 22,<br />
311320<br />
Brochmann, C., Bryst<strong>in</strong>g, A. K., Alsos, I. G., Borgen, L,. Grundt, H. H., Scheen, AC.<br />
& Elven, R. 2004: Polyploidy <strong>in</strong> arctic <strong>plant</strong>s. Biological Journal of the L<strong>in</strong>nean<br />
Society 82, 521536<br />
Bråthen, K. A. & Hageberg O. 2004: More efficient estimations of <strong>plant</strong> biomass.<br />
Journal of Vegetation Science 15, 653660<br />
Cannone, N.,Guglielm<strong>in</strong>, M. & Gerdol, R. 2004: Relationships between vegetation<br />
patterns and periglacial landforms <strong>in</strong> northwestern <strong>Svalbard</strong>. Polar Biology 27: 562<br />
571<br />
Elvebakk, A. 1999: Bioclimatic delimitation and subdivision of the <strong>Arctic</strong>. Det<br />
Norske VidenskapsAkademi. I. MatematiskNaturvitenskapelig Klasse. Skrifer. Ny<br />
serie 38, 81112<br />
Elvebakk, A. 2005: A vegetation map of <strong>Svalbard</strong> on the scale 1:3.5 mill.<br />
Phy<strong>to</strong>coenologia 35, 951967<br />
Elven, R., Murray, D. F., Razzhiv<strong>in</strong>, V. Y. & Yurtsev B.A. 2003: Checklist of the<br />
Pan<strong>Arctic</strong> Flora (PAF). Vascular Plants, Draft Version. University of Oslo, Oslo<br />
Erschbamer, B. 2007: W<strong>in</strong>ners and losers of climate change <strong>in</strong> a central alp<strong>in</strong>e glacier<br />
foreland. <strong>Arctic</strong>, Antarctic and Alp<strong>in</strong>e Research 39, 237244<br />
Gough, L. 2006: Neighbor effects on germ<strong>in</strong>ation, survival, and growth <strong>in</strong> two arctic<br />
<strong>tundra</strong> communities. Ecography 29, 4456<br />
Grant V.1981: Plant Speciation. New York: Columbia Univ. Press. 2 nd ed<br />
Grundt, H. H., Kjølner, S., Borgen, L., Rieseberg, L. H. & Brochmann, C. 2006: High<br />
biological species diversity <strong>in</strong> the arctic flora. Proceed<strong>in</strong>gs of the National Academy<br />
of Sciences of the Unites States of America 103, 972975<br />
Hammer, Ø., Harper, D. A. T. 2003: PAST, version 1.10<br />
http://folk.uio.no/ohammer/past<br />
70
Hodk<strong>in</strong>son, I. D., Coulson, S. J. & Webb, N. R. (2003) Community assembly along<br />
proglacial chronosequences <strong>in</strong> the high Arcic: vegetation and soil development <strong>in</strong><br />
northwest <strong>Svalbard</strong>. Journal of Ecology 91, 651663<br />
Hultèn, E. 1962: The circum<strong>polar</strong> <strong>plant</strong>s. I: Vacsular cryp<strong>to</strong>gams, conifers,<br />
monocotyledons. S<strong>to</strong>ckholm, Almquist & Wiksell<br />
Jones. G. & Henry, G. H. R. 2003: Primary <strong>plant</strong> succession on recently deglaciated<br />
terra<strong>in</strong> <strong>in</strong> the Canadian High <strong>Arctic</strong>. Journal of Biogeography 30, 277296<br />
Körner, C. 2003: Alp<strong>in</strong>e Plant Life. Functional Plant Ecology of High Mounta<strong>in</strong><br />
Ecosystems. Spr<strong>in</strong>gerVerlag, Berl<strong>in</strong> Heidelberg<br />
Lefauconnier, B. 1991: Recent fluctuations of glaciers <strong>in</strong> Kongsfjorden, Spitsbergen,<br />
<strong>Svalbard</strong> (79 °N). InterNord 19, 449453<br />
Legendere, P., Borcard, D., PeresNetro, P. R., 2005: Analyz<strong>in</strong>g beta diversity:<br />
partition<strong>in</strong>g the spatial variation of community composition data. Ecological<br />
Monographs, 75, 435450<br />
Lumaret R. 1988: Adaptive strategies and ploidy levels. Acta Oecol. Oecol. Plant.<br />
9:8393<br />
Matthews, J. A. 1992: The <strong>ecology</strong> of recently deglaciated terra<strong>in</strong>. A geoecological<br />
approach <strong>to</strong> glacier forelands and primary succession. Cambridge, Cambridge<br />
University Press<br />
Matthews, J. A. 2005: Little Ice Age glacier variations <strong>in</strong> Jotunheimen, southern<br />
Norway: a study <strong>in</strong> regionally controlled lichenometric dat<strong>in</strong>g of recessional<br />
mora<strong>in</strong>es with implications for climate and lichen growth rates. The Holocene 15, 1<br />
19<br />
McCarthy, D. 1999: A biological basis for Lichenometry? Journal of Biogeography<br />
26, 379386<br />
Moreau, M., Laffly, D., Joly, D. & Brossard, T. 2005: Analysis of <strong>plant</strong> colonization<br />
on an arctic mora<strong>in</strong>e s<strong>in</strong>ce the end of the little Ice Age us<strong>in</strong>g remotely sensed data<br />
and a Bayesian approach. Remote Sens<strong>in</strong>g of Environment 99, 244253<br />
Niederfr<strong>in</strong>iger, R. & Erschbamer, B. 2000: Germ<strong>in</strong>ation and Establishment of<br />
Seedl<strong>in</strong>gs on a Glacier Foreland <strong>in</strong> the Central Alps, Austria. <strong>Arctic</strong>, Antarctic and<br />
Alp<strong>in</strong>e Research 32, 270277<br />
Norsk Meterologisk Institutt.2007: www.met.no<br />
Raffl,C., Mallaun, M., Mayer, R., Erschbamer, B. 2006: Vegetation Succession<br />
Pattern and Diversity Changes <strong>in</strong> a Glacier Valley, Central Alps, Austria. <strong>Arctic</strong>,<br />
Antarctic, and Alp<strong>in</strong>e Research 38, 421428<br />
Stebb<strong>in</strong>s, G. L. 1984: Polyploidy and the distribution of the arcticalp<strong>in</strong>e flora: new<br />
evidence and a new approach. Botanica Helvetica 94, 113<br />
Stebb<strong>in</strong>s, G. L. 1971: Chromosomal Evolution <strong>in</strong> Higher Plants. London: Addison<br />
Wesley<br />
<strong>Svalbard</strong>sflora. 2007: www.svalbardflora.net<br />
71
Svoboda, J., Henry, G. H. R. 1987: Succession <strong>in</strong> marg<strong>in</strong>al arctic environments.<br />
<strong>Arctic</strong> and Alp<strong>in</strong>e Research 19, No 4, 373384<br />
Walker, M. D., Wahren, H. C., Hollister R. D., Henry, G. H. R., Ahlquist, L. E.,<br />
Alatalo, J. M., BretHarte, S. M., Calef, M. P., Callaghan, T. V., Carroll, A. B.,<br />
Epste<strong>in</strong>, H. E., Jónsdóttir, I. S., Kle<strong>in</strong>, J. A., Magnússon, B., Molau, U., Oberbauer,<br />
S. F., Rewa S. P., Rob<strong>in</strong>son, C. H., Shaver, G. R., Sud<strong>in</strong>g, K. N., Thompson, , C. C.,<br />
Tolvanen, A., Totland, Ø., Turner, P. L., Tweedie, C. E., Webber, P. J. & Wookey,<br />
P. A. 2006: Plant community responses <strong>to</strong> experimental warm<strong>in</strong>g across the <strong>tundra</strong><br />
biome. Proceed<strong>in</strong>gs of the National Academy of Sciences of the Unites States of<br />
America 103, 13421346<br />
Werner, A. L. 1990: Lichen growth rates for the northwest coast of Spitsbergen,<br />
<strong>Svalbard</strong>. <strong>Arctic</strong> and Alp<strong>in</strong>e Research 22, 129140<br />
Whittaker, R.H. 1972: Evolution and measurement of species diversity. Taxon, 21,<br />
21325<br />
72
High nutrient levels can compensate for the growth<br />
limit<strong>in</strong>g effect of low temperatures<br />
Elke Morgner 1 and Christian E. Pettersen 2<br />
1 Department of Physical Geography and Quaternary Geology, S<strong>to</strong>ckholm University, SE106 91<br />
S<strong>to</strong>ckholm, Sweden. 2 Department of Biology, University of Oslo, N0316 Oslo, Norway .<br />
Abstract<br />
Plant growth <strong>in</strong> the <strong>Arctic</strong> is strongly <strong>in</strong>fluenced by low temperature and associated<br />
short grow<strong>in</strong>g season, both of which also reduce soil nutrient availability. S<strong>in</strong>ce low<br />
temperature and low nutrient availability may <strong>in</strong>teract, it is difficult <strong>to</strong> dist<strong>in</strong>guish the<br />
impact of each of these variables. The aim of this study was <strong>to</strong> test whether<br />
temperature per se controls <strong>plant</strong> growth or whether growth is constra<strong>in</strong>ed by<br />
temperature<strong>in</strong>duced nutrient shortage. Us<strong>in</strong>g <strong>plant</strong> and leaf size as simple proxies for<br />
vigor, 778 <strong>in</strong>dividuals of 19 different vascular <strong>plant</strong> species were exam<strong>in</strong>ed <strong>in</strong> 10<br />
geographical regions on <strong>Svalbard</strong> differ<strong>in</strong>g <strong>in</strong> midsummer temperature and nutrient<br />
availability. The results of this study <strong>in</strong>dicate that nutrient abundance under bird cliffs<br />
stimulates growth <strong>in</strong> all but the coldest site. We conclude that nutrient addition can<br />
mitigate low temperature effects on growth and productivity even <strong>in</strong> the high arctic,<br />
but when temperatures approach the thermal limit for higher <strong>plant</strong> life, temperature<br />
itself sets the limit rather than nutrients.<br />
Nomenclature: PAF 2007.<br />
Introduction<br />
The slow growth of <strong>plant</strong>s <strong>in</strong> the arctic and its causes have been the subject of many<br />
studies (Chap<strong>in</strong> 1983; Jonasson et al. 1993; Henry et al. 1986; Bill<strong>in</strong>gs 1987). Several<br />
of the abiotic fac<strong>to</strong>rs that are characteristic for arctic and alp<strong>in</strong>e environments are<br />
known <strong>to</strong> restrict <strong>plant</strong> growth, but the <strong>in</strong>teraction of these fac<strong>to</strong>rs and their <strong>in</strong>fluences<br />
on <strong>plant</strong> growth are complex and still subject <strong>to</strong> debate (Körner 1989). In this context<br />
it should be mentioned that the degree of <strong>in</strong>traspecific variation <strong>in</strong> phenotypic<br />
appearance, the phenotypic plasticity of a species, can differ between species, i.e.<br />
species exhibit different growth responses <strong>to</strong> changes <strong>in</strong> environmental conditions<br />
(Chap<strong>in</strong> & Shaver 1985).<br />
Plants <strong>in</strong> the arctic are physiologically extremely well adapted <strong>to</strong> low temperatures<br />
(Chap<strong>in</strong> 1983). As Chap<strong>in</strong> (1983) and Körner (2003) highlight, the maximum and<br />
average relative growth rate of certa<strong>in</strong> arctic and alp<strong>in</strong>e <strong>tundra</strong> species is as high as <strong>in</strong><br />
their temperate counterparts if expressed per day of grow<strong>in</strong>g season. Thus,<br />
productivity of arctic ecosystems can be as high as <strong>in</strong> any other nonwater limited<br />
natural ecosystem on earth if one accounts for the duration of the grow<strong>in</strong>g periods<br />
(Körner 2003). In the extreme high <strong>Arctic</strong>, <strong>plant</strong>s get <strong>in</strong>creas<strong>in</strong>gly smaller until they<br />
ultimately vanish. Low nutrient levels, <strong>in</strong> particular low nitrogen availability (Henry<br />
et al. 1986, Odasz 1994), are known <strong>to</strong> be a major limitation for <strong>plant</strong> growth <strong>in</strong> arctic<br />
ecosystems, and it may well be that low temperature <strong>in</strong>duces nutrient limitation. On<br />
the other hand, <strong>plant</strong> nutrient absorption <strong>in</strong> cold climates was shown <strong>to</strong> be strongly<br />
73
limited by nutrient availability rather than by low temperature (Chap<strong>in</strong> 1983).<br />
Nitrogen availability <strong>in</strong> turn is <strong>in</strong>fluenced by a range of abiotic and biotic fac<strong>to</strong>rs<br />
which result from <strong>in</strong>direct effects of low temperatures such as slow chemical<br />
weather<strong>in</strong>g, poor soil aeration and slow organic matter decomposition (Chap<strong>in</strong> 1983).<br />
Thus temperature acts upon <strong>plant</strong> growth <strong>in</strong> various ways (Fig. 1). The <strong>in</strong>ternational<br />
<strong>tundra</strong> experiment “ITEX” (Arft et al. 1999) has shown that <strong>plant</strong>s from both arctic<br />
and alp<strong>in</strong>e <strong>tundra</strong> are sensitive <strong>to</strong> raised summer temperatures, and respond by<br />
<strong>in</strong>creas<strong>in</strong>g vegetative growth <strong>in</strong> the short term. In the long term however, such<br />
responses may be limited by nutrients.<br />
Figure 1. The direct and <strong>in</strong>direct effects of temperature upon<br />
processes affect<strong>in</strong>g <strong>plant</strong> growth (after Chap<strong>in</strong> 1983).<br />
Even though arctic ecosystems are characterized by low nitrogen availability,<br />
exceptionally rich areas exist under coastal cliffs, where nest<strong>in</strong>g birds transport<br />
nutrients from the sea <strong>to</strong> the land (Odasz 1994). In our study we chose <strong>to</strong> compare<br />
vegetation <strong>in</strong> these nutrient rich areas with vegetation <strong>in</strong> nutrient poor areas <strong>in</strong> similar<br />
temperature regimes. We also compared nutrient poor areas with relatively high<br />
temperatures with nutrient rich areas and low temperatures and areas with low<br />
nutrient level but differ<strong>in</strong>g temperatures. The aim of our <strong>in</strong>vestigation was <strong>to</strong> show <br />
by us<strong>in</strong>g this “natural experiment” whether nutrients per se are limit<strong>in</strong>g growth of<br />
different arctic <strong>plant</strong> species, or whether the observed growth limitation is solely<br />
attributed <strong>to</strong> low temperature. We predict that nutrient addition is able <strong>to</strong> compensate<br />
for some of the growth constra<strong>in</strong>ts imposed by low temperature. Hence we assume<br />
that part of the growth limitation <strong>in</strong> cold regions is <strong>in</strong> fact a low temperature <strong>in</strong>duced<br />
nutrient limitation.<br />
74
Materials and methods<br />
Study localities<br />
This study was undertaken on <strong>Svalbard</strong>, an archipelago <strong>in</strong> the high arctic. 10 different<br />
geographical regions (table 1) <strong>in</strong> the western and northern parts of the archipelago<br />
were chosen as study areas. In this way a wide range of biotic and abiotic conditions<br />
was covered, <strong>in</strong> particular all of the three bioclimatic zones present on <strong>Svalbard</strong>.<br />
Localities were assigned <strong>to</strong> bioclimatic zones accord<strong>in</strong>g <strong>to</strong> Elvebakk (1999). For the<br />
region Florabukta this division was problematic as we observed Salix <strong>polar</strong>is grow<strong>in</strong>g<br />
there. This region should, accord<strong>in</strong>g <strong>to</strong> Jónsdóttir (2005), therefore have been placed<br />
<strong>in</strong> bioclimatic zone B. However, Salix <strong>polar</strong>is also occurred <strong>in</strong> Lady Frankl<strong>in</strong>fjorden,<br />
a region that accord<strong>in</strong>g <strong>to</strong> Elvebakk (2005) should be considered part of bioclimatic<br />
zone A. Moreover the flora and landscape <strong>in</strong> Florabukta <strong>in</strong>dicated a position closer <strong>to</strong><br />
bioclimatic zone A (pers. comm. D. F. Murray 2007) and we therefore assigned the<br />
region <strong>to</strong> this zone. Where necessary, <strong>in</strong> terms of differences <strong>in</strong> environmental<br />
conditions, each region was divided <strong>in</strong><strong>to</strong> different sites.<br />
Table 1. UTM coord<strong>in</strong>ates, bioclimatic zone, habitat, and mean 10cm soil temperatures for the<br />
study localities.<br />
Study locality (E/N) Bioclimatic<br />
zone<br />
(site code)<br />
Florabukta (0571/8887)<br />
Lady Frankl<strong>in</strong>fjorden<br />
(0588/8901)<br />
Lågøya (NA)<br />
Florabukta (0571/8888)<br />
Mayerbukta (0478/8863)<br />
Biscayarhuken (0448/8864)<br />
Re<strong>in</strong>sdyrflya (0478/8863)<br />
Fjortende juli breen (0433/8786)<br />
Colesdalen (0502/8670)<br />
Kapp Thordsen (0511/8709)<br />
Ossian Sars (0445/8763)<br />
Ossian Sars (0445/8763)<br />
A(1)<br />
A(2)<br />
A(3)<br />
A(4)<br />
B(5)<br />
B(6)<br />
B(7)<br />
B(8)<br />
C(9)<br />
C(10)<br />
C(11)<br />
C(12)<br />
Habitat 10cm soil<br />
temperature <strong>in</strong><br />
°C<br />
Mesic L. nivalis<br />
L. confusa <strong>polar</strong> <strong>desert</strong><br />
P. dahlianum <strong>polar</strong> <strong>desert</strong><br />
Birdcliff<br />
Glacier foreland<br />
Mesic Luzula confusa<br />
P. alp<strong>in</strong>a snow bed community<br />
Birdcliff<br />
Thermophilic heath<br />
Heath and calcerous fen<br />
C. tetragona heath<br />
Birdcliff<br />
75<br />
4,1<br />
3,3<br />
not measured<br />
4,1<br />
6,9<br />
Sampl<strong>in</strong>g and sample analysis<br />
Biometric <strong>plant</strong> traits from the follow<strong>in</strong>g vascular <strong>plant</strong> species were collected:<br />
Bis<strong>to</strong>rta vivipara, Cerastium arcticum, Cochlearia groenlandica, Dryas oc<strong>to</strong>petala,<br />
Juncus biglumis, Luzula confusa, Luzula nivalis, Micrantes nivalis, Oxyria digyna,<br />
Papaver dahlianum, Poa arctica, Poa pratensis, Ranunculus pygmaeus, Ranunculus<br />
sulphureus, Saxifraga cernua, Saxifraga rivularis, Silene acaulis and Taraxacum<br />
brachyceras. These species were selected due <strong>to</strong> their wide distribution on <strong>Svalbard</strong>.<br />
At each study site, maximum <strong>plant</strong> height and leaf size of <strong>plant</strong>s belong<strong>in</strong>g <strong>to</strong> our<br />
focal species were measured with a ruler. Maximum <strong>plant</strong> height was def<strong>in</strong>ed as the<br />
longest part of the <strong>plant</strong> measured from the base <strong>to</strong> the tip of either shoot, leaf or<br />
4,7<br />
4,4<br />
10<br />
5,5<br />
7,1<br />
9,3<br />
8,2
flower. Care was taken <strong>to</strong> measure only flower<strong>in</strong>g <strong>in</strong>dividuals <strong>to</strong> ensure that <strong>plant</strong>s<br />
were at the same phenological state. A phenotypic plasticity <strong>in</strong>dex (ppi) for each of<br />
the studied species was def<strong>in</strong>ed as 1 – (the ratio of measured m<strong>in</strong>imum<br />
height/maximum height).<br />
The study sites were characterized by soil moisture estimates and <strong>to</strong>tal vegetation<br />
cover, harvest<strong>in</strong>g aboveground biomass, and by measur<strong>in</strong>g the pH and soil<br />
temperature. The moisture content of the soil was estimated by squeez<strong>in</strong>g soil<br />
between the f<strong>in</strong>gers and assign<strong>in</strong>g the results <strong>to</strong> a fourpo<strong>in</strong>t scale (sensu Raup 1969).<br />
Total vegetation cover was estimated per 0.5 x 0.5 m 2 by eye. Aboveground biomass<br />
was harvested <strong>in</strong> representative full cover 10 x 10 cm plots, dried and weighed. The<br />
biomass data was then scaled up <strong>to</strong> g/m 2 . Soil temperature measurements were taken<br />
at 10 cm depth and were used as <strong>in</strong>dica<strong>to</strong>rs for midsummer temperature. These<br />
values should be used with caution because of their sensitivity <strong>to</strong> variation <strong>in</strong> weather<br />
conditions. But given the soil depth and 24 h day length (i.e. small diurnal amplitude),<br />
the temperatures are somewhat buffered from shortterm fluctuations and will<br />
approximate the mean of the recent (few days) past with an accuracy of better than ±1<br />
K. M<strong>in</strong>eral soil samples from each site were collected <strong>in</strong> the field and pH was<br />
measured electronically <strong>in</strong> a labora<strong>to</strong>ry. In cases where more than one value for the<br />
abiotic fac<strong>to</strong>rs mentioned above was obta<strong>in</strong>ed, the average value of these was used.<br />
F<strong>in</strong>ally the sites were divided accord<strong>in</strong>g <strong>to</strong> a twopo<strong>in</strong>t nutrient level scale (1=nutrient<br />
poor, 2=nutrient rich). All bird cliff sites as well as one site <strong>in</strong> Colesdalen close <strong>to</strong> an<br />
old stable were assigned <strong>to</strong> nutrient level 2.<br />
Statistical analysis<br />
For the statistical analysis the statisticssoftware R 2.6.1 (R Development Core Team)<br />
was used. L<strong>in</strong>ear regression and ANCOVA were used <strong>to</strong> test for significance between<br />
height/leaf size and temperature, nutrient level, moisture, pH, cover and bioclimatic<br />
zone. The data was logtransformed <strong>to</strong> normalize distribution before runn<strong>in</strong>g the<br />
statistical tests.<br />
Results<br />
Biotic and abiotic fac<strong>to</strong>rs<br />
When all species were pooled and tested statistically, ANCOVA results showed a<br />
positive correlation between <strong>plant</strong> height or leaf size and soil temperature as well as<br />
nutrient level (Table 2, Fig 2). In addition these two analysis showed a significant<br />
<strong>in</strong>teraction between temperature and nutrient level (temperature x nutrients) <strong>in</strong> their<br />
effect on <strong>plant</strong> height and leaf size. Plant height is also correlated with bioclimatic<br />
zone, whereas leaf size is not. Accord<strong>in</strong>g <strong>to</strong> the results, moisture also has a significant<br />
effect on <strong>plant</strong> height, but not on leaf size, but we cannot separate the direct moisture<br />
effect from the <strong>in</strong>direct effect on soil development and nutrient availability.<br />
Furthermore, a significant relationship between pH and <strong>plant</strong> height but not leaf size<br />
was found. Vegetation cover has a significant effect on both <strong>plant</strong> height and leaf size.<br />
The denser the <strong>plant</strong> community, the higher were the <strong>plant</strong>s and the longer were the<br />
leaves.<br />
76
Figure 2. Overall <strong>plant</strong> height <strong>in</strong> areas with low nutrient availability (Low N) as well as areas<br />
with high nutrient availability (High N) related <strong>to</strong> soil temperature <strong>in</strong> 10 cm depth.<br />
Data po<strong>in</strong>ts for means per species and site.<br />
Table 2. Results of ANCOVA test<strong>in</strong>g for significant correlations between several abiotic<br />
parameters and overall <strong>plant</strong> height and leaf size among the studied sites. Bold font =<br />
only s<strong>in</strong>gle fac<strong>to</strong>rs <strong>in</strong> the model, asterisk = model <strong>in</strong>clud<strong>in</strong>g <strong>in</strong>teraction, NS = not<br />
significant.<br />
Plant height Leaf size<br />
Parameter F df p F df p<br />
Temperature<br />
Nutrient level<br />
temp* nut<br />
Bioclimatic zone<br />
Soil moisture<br />
Soil pH<br />
Vegetation cover<br />
197.8 1,761
Biomass<br />
Biomass per unit land area of full cover plots decl<strong>in</strong>ed slightly from bioclimatic zone<br />
C <strong>to</strong> A, and bird cliffs showed much higher biomass than nearby reference sites. The<br />
relative fertilizer effect seamed <strong>to</strong> decrease from zone C <strong>to</strong> A, but the low number of<br />
replicates did not allow a statistical test of this (Fig. 3).<br />
Figure 3. Mean biomass <strong>in</strong> g d.m. m 2 grouped <strong>in</strong><strong>to</strong> bioclimatic zones (A, B and C, i.e. from<br />
cold <strong>to</strong> less cold). The means for each region lach data for region 1, 3 and 6. Data<br />
from bird cliffs <strong>in</strong> black.<br />
Biomass was nearly always >100 gm 2 , and <strong>in</strong> two cases from bird cliffs 500600 gm <br />
2 , with the length of the grow<strong>in</strong>g season rang<strong>in</strong>g from ca. 40 days (bioclimatic zone A)<br />
<strong>to</strong> 80 days (bioclimatic zone C).<br />
Phenotypic plasticity<br />
The phenotypic plasticity <strong>in</strong>dex (ppi) for each of the studied species is shown <strong>in</strong> Fig.<br />
4. The plasticity <strong>in</strong>dex calculated on the basis of measured m<strong>in</strong>imum and maximum<br />
leaf size shows a similar pattern like that <strong>in</strong> <strong>plant</strong> size and is therefore not shown here.<br />
High values for the plasticity <strong>in</strong>dex <strong>in</strong>dicate high variation <strong>in</strong> maximum <strong>plant</strong> height.<br />
The mean plasticity value obta<strong>in</strong>ed from the measurements <strong>in</strong> this study is 0.83.<br />
Species with relatively high variation <strong>in</strong> <strong>plant</strong> height are: Bis<strong>to</strong>rta vivipara (ppi =<br />
0.91), Cerastium arcticum p(pi = 0.96) Cochlearia groenlandica (ppi = 0.99), Oxyria<br />
digyna (ppi = 0.96), Ranunculus sulphureus (ppi = 0.97), Ranunculus pygmaeus (ppi =<br />
0.90) and Saxifraga cernua (ppi = 0.88) (Fig.4). Except for the Ranunculaceae, all of<br />
these species are found among the tallest <strong>plant</strong>s (Table 4).<br />
78
1,00<br />
0,95<br />
0,90<br />
0,85<br />
0,80<br />
0,75<br />
0,70<br />
0,65<br />
0,60<br />
0,55<br />
0,50<br />
B. vivipara<br />
C. arcticum<br />
C. groenlandica<br />
D. oc<strong>to</strong>petala<br />
J. biglumis<br />
L. confusa<br />
L. nivalis<br />
O. digyna<br />
P. dahlianum<br />
P. arctica<br />
P. pratensis<br />
79<br />
R. pygmaeus<br />
R. sulphureus<br />
S. cernua<br />
M. nivalis<br />
S. rivalis<br />
S. acaulis<br />
S. uralensis<br />
T. brachyceras<br />
mean plasticity<br />
plasticity <strong>in</strong>dex<br />
Figure 4. Phenotypic plasticity <strong>in</strong>dex (1m<strong>in</strong> height/max height) for the studied <strong>plant</strong> species.<br />
The l<strong>in</strong>e <strong>in</strong>dicates mean ppi. The two species with the lowest <strong>in</strong>dex (
Luzula nivalis<br />
Juncus biglumis<br />
Dryas oc<strong>to</strong>petala<br />
Ranunculus pygmaeus<br />
Silene acaulis<br />
Saxifraga rivularis<br />
114<br />
111<br />
70<br />
70<br />
55<br />
25<br />
80<br />
0.38 1.10<br />
1.33 1.37<br />
0.63 1.02<br />
1.18 2.35<br />
Figure 5. Plant height of Bis<strong>to</strong>rta vivipara related <strong>to</strong> soil temperature <strong>in</strong> 10 cm depth <strong>in</strong> areas<br />
with low nutrient levels (low nutrient) compared <strong>to</strong> areas with high nutrient levels<br />
(high nutrient).<br />
Discussion<br />
As expected there was a positive correlation between the three variables <strong>plant</strong> height,<br />
leaf size, and biomass with temperature, as well as nutrient availability. Plant height,<br />
leaf size, and biomass also <strong>in</strong>creased from bioclimatic zone A <strong>to</strong> C. Our data shows<br />
also a significant <strong>in</strong>teraction between temperature and nutrient availability <strong>in</strong> their<br />
effect on <strong>plant</strong> growth. Moreover, the results <strong>in</strong>dicate that <strong>in</strong> accordance with our<br />
hypothesis, <strong>in</strong>creased nutrient levels can compensate for the growth limit<strong>in</strong>g effect of<br />
temperature <strong>in</strong> bioclimatic zone B and C, but not so <strong>in</strong> zone A. However, the impact<br />
of differential temperature and nutrient level on the growth response of the studied<br />
<strong>plant</strong>s was not uniform among the different species.<br />
Opportunists are supposed <strong>to</strong> respond faster and <strong>to</strong> greater extent <strong>to</strong> changes <strong>in</strong><br />
environmental parameters. Odasz (1994) used measures of nitrate reductase activity <strong>in</strong><br />
different <strong>plant</strong> species as an <strong>in</strong>dica<strong>to</strong>r for their ability <strong>to</strong> utilize nitrogen (Table 4). In<br />
her rank<strong>in</strong>g Oxyria digyna, Cochlearia groenlandica and Cerastium arcticum had a<br />
high ability <strong>to</strong> utilize nitrogen. This should facilitate fast growth response when<br />
nitrogen availability <strong>in</strong>crease, a reaction that is especially pronounced <strong>in</strong> our data for<br />
Oxyria digyna and Cochlearia groenlandica. Our results <strong>in</strong>dicate that both Oxyria
digyna, Cochlearia groenlandica, but also Cerastium arcticum have high phen<strong>to</strong>typic<br />
plasticity <strong>in</strong> response <strong>to</strong> nutrient availability, so this study supports the data and<br />
suggestions by Odasz (1994).<br />
Where our data allowed us <strong>to</strong> compare <strong>plant</strong>s from nutrient rich localities <strong>in</strong><br />
bioclimatic zone B and C with <strong>in</strong>dividuals from nutrient poor sites <strong>in</strong> the same regions<br />
we detected <strong>in</strong>creased height <strong>in</strong> the nutrient rich sites. This f<strong>in</strong>d<strong>in</strong>g can be <strong>in</strong>terpreted<br />
as a compensat<strong>in</strong>g effect of high nutrient levels for moderately low temperatures.<br />
However, our data from nutrient rich and nutrient poor sites <strong>in</strong> bioclimatic zone A<br />
does not show this pattern. There were strong signs of graz<strong>in</strong>g by re<strong>in</strong>deer and geese<br />
<strong>in</strong> the area (dune), but s<strong>in</strong>ce we sampled the tallest undamaged <strong>in</strong>dividuals, this should<br />
not have affected our height data. The lack of a clear response of <strong>plant</strong> height <strong>to</strong><br />
<strong>in</strong>creased nutrient availability <strong>in</strong> bioclimatic zone A could also relate <strong>to</strong> a priority for<br />
reproduction rather than vegetative growth. Arft et al. (1999) supposed that high arctic<br />
species would respond <strong>to</strong> more favorable conditions <strong>in</strong> terms of temperature and<br />
nutrients with an <strong>in</strong>crease <strong>in</strong> reproductive effort rather than more growth (Baldeweg<br />
and Bengtsson, AB326 2007).<br />
The fact that <strong>in</strong>dividuals of 11 out of 19 species, when grow<strong>in</strong>g <strong>in</strong> nutrient poor sites,<br />
seemed <strong>to</strong> reach their maximum height <strong>in</strong> areas that did not have the highest measured<br />
temperatures dur<strong>in</strong>g our sampl<strong>in</strong>g is surpris<strong>in</strong>g. One explanation could be that denser<br />
vegetation reduces soil heat flux. Another possible explanation could be unexpected<br />
nutrient rich conditions at the moderate temperature site <strong>in</strong> Mayerbukta, <strong>in</strong>dicated not<br />
only by the observed higher <strong>plant</strong> growth but also by the high Shannon <strong>in</strong>dex (i.e.<br />
high species diversity) observed at this site (An<strong>to</strong>nsson, Jørgensen and Tange, AB<br />
326 2007).<br />
A problem <strong>in</strong> the analysis and <strong>in</strong>terpretation of our data is the unbalanced replication<br />
of the different species and the fact that many species did not occur <strong>in</strong> all<br />
sites/regions. In particular, we lack sufficient data from Nrich sites (near bird cliffs)<br />
for species that had been sampled elsewhere.<br />
Conclusion<br />
This study lends support <strong>to</strong> our hypothesis that high nutrient availability can<br />
compensate for the growth limit<strong>in</strong>g effect of low temperatures <strong>in</strong> the high <strong>Arctic</strong> as<br />
long as temperatures are not <strong>to</strong>o low. The nutrient addition effect seems <strong>to</strong> decl<strong>in</strong>e at<br />
the coldest sites, which suggests that an ultimate (extreme) thermal limitation cannot<br />
be mitigated by better nutrient supply.<br />
Acknowledgements<br />
S<strong>in</strong>cere thanks <strong>to</strong> Ane and Emma for their <strong>in</strong>valuable help with the statistics. Thanks<br />
also <strong>to</strong> Inger Greve Alsos and Christian Körner for help <strong>in</strong> design<strong>in</strong>g this project and<br />
fruitful comments on the manuscript, as well as <strong>to</strong> our course mates for help with data<br />
collection and a very nice time. Last but not least we would like <strong>to</strong> thank the crew on<br />
“MS S<strong>to</strong>ckholm”.<br />
81
References<br />
Arft, A. M., Walker, M. D., Gurevitch, J., Alatalo, J. M., BretHarte, M. S., Dale, M,<br />
Diemer, M., Gugerli, F., Henry, G. H. R., Jones, M. H., Hollister, R. D., Jonsdottir,<br />
I. S., La<strong>in</strong>e, K., Levesque, E., Marion, G. M., Molau, U., Molgaard, P., Nordenhall,<br />
U., Raszhiv<strong>in</strong>, V., Rob<strong>in</strong>son, C. H., Starr, G., Stenstrom, A., Stenstrom, M., Totland,<br />
O., Turner, P. L., Walker, L. J., Webber, P. J., Welker, J. M., Wookey, P. A. 1999:<br />
Responses of <strong>tundra</strong> <strong>plant</strong>s <strong>to</strong> experimental warm<strong>in</strong>g: Metaanalysis of the<br />
<strong>in</strong>ternational <strong>tundra</strong> experiment. Ecological Monographs 69, 491511<br />
Bill<strong>in</strong>gs, W. D. 1987: Constra<strong>in</strong>ts <strong>to</strong> <strong>plant</strong> growth, reproduction, and establishment <strong>in</strong><br />
arctic environments. <strong>Arctic</strong> and Alp<strong>in</strong>e Research 19, 3573<br />
Chap<strong>in</strong> III, F. S. 1983: Direct and <strong>in</strong>direct effects of temperature on arctic <strong>plant</strong>s.<br />
Polar Biology 2, 4752<br />
Chap<strong>in</strong> III, F. S. & Shaver, G. R. 1985: Growth response of <strong>tundra</strong> <strong>plant</strong> species <strong>to</strong><br />
environmental manipulations <strong>in</strong> the field. Ecology 66, 564576<br />
Elvebakk, A. 1999: Bioclimatic delimitation and subdivision of the arctic. In Nordal I<br />
& Razzhiv<strong>in</strong> VY. The species concept <strong>in</strong> the high north – A panarctic flora <strong>in</strong>itiative.<br />
Det Norske Videnskapskademi, Oslo<br />
Elvebakk, A. 2005: A vegetation map of <strong>Svalbard</strong> on the scale 1:3.5 mill.<br />
Phy<strong>to</strong>coenologia 35, 951967<br />
Elven, R., Murray, D. F., Razzhiv<strong>in</strong>, V. & Yurtsev, B. A. Checklist of the Panarctic<br />
Flora (PAF). Vascular Plants (Univ. of Oslo, Oslo, Norway, 2007)<br />
Henry, G. H. R., Freedman, B. & Svoboda, J. 1986: Effects of fertilization on three<br />
<strong>tundra</strong> <strong>plant</strong>communities of a <strong>polar</strong> <strong>desert</strong> oasis. Canadian Journal of Botany 64,<br />
25022507<br />
Jonasson, S., Havstrøm, M., Jensen, M. & Callaghan, T. V. 1993: Insitu<br />
m<strong>in</strong>eralization of nitrogen and phosphorus of arctic soils after perturbations<br />
simulat<strong>in</strong>g climatechange. Oecologia 95, 179186<br />
Jónsdóttir, I. S. 2005: Terrestrial ecosystems on <strong>Svalbard</strong>. Heterogeneity, Complexity,<br />
and Fragility from an <strong>Arctic</strong> Island Perspective. Biology and Environment:<br />
Proceed<strong>in</strong>gs of the Royal Irish Academy 105B, 155165<br />
Körner, C. 1989: The nutritional status of <strong>plant</strong>s from high altitudes. A worldwide<br />
comparison. Oecologia 81, 379391<br />
Körner, C. 2003: Alp<strong>in</strong>e Plant Life. Functional Plant Ecology of High Mounta<strong>in</strong><br />
Ecosystems. Spr<strong>in</strong>gerVerlag, Berl<strong>in</strong> Heidelberg<br />
Odasz, A. M. 1994: Nitrate reductaseactivity <strong>in</strong> vegetation below an arctic bird cliff,<br />
<strong>Svalbard</strong>, Norway. Journal of vegetation science 5, 913920<br />
R Development Core Team 2007: R: A Language and Environment for Statistical<br />
Comput<strong>in</strong>g. Vienna, Austria. http://www.Rproject.org<br />
Raup, H. M. 1969: The relation of the vascular flora <strong>to</strong> some fac<strong>to</strong>rs of site <strong>in</strong> the<br />
Mester Vig district, northeast Greenland. Meddelelse om Grønland, 176: 180<br />
82
Reproductive allocation <strong>in</strong> the high <strong>Arctic</strong><br />
Heike Baldeweg 1 and Emma Bengtsson 2 , project leader Christian Körner 3<br />
1 Institute of Ecology, FriedrichSchillerUniversity Jena, Dornburgerstraße 159, D07743, Germany<br />
helia.antha@gmail.de, 2 Institute of Biology, NTNU, NO7491 Trondheim, Norway<br />
bengtson@stud.ntnu.no, 3 Institute of Botany, University of Basel, Schönbe<strong>in</strong>strasse 6, 4056 Basel,<br />
Switzerland, ch.koerner@unibas.ch<br />
Abstract<br />
<strong>From</strong> a given pool of resources, <strong>plant</strong>s need <strong>to</strong> <strong>in</strong>vest <strong>in</strong> vegetative or reproductive<br />
structures, with obvious tradeoffs between the two. In cold climates, <strong>plant</strong>s are<br />
generally smaller than <strong>in</strong> warm climates, and as life conditions become more adverse<br />
m<strong>in</strong>iaturization of <strong>plant</strong>s progresses. Does this affect vegetative and reproductive<br />
structures similarly (isometric allocation), or do <strong>plant</strong>s give priority <strong>to</strong> one of the two<br />
(asymmetric allocation), which would h<strong>in</strong>t at selective pressure (evolutionary<br />
adaptation)? In the high <strong>Arctic</strong> this has never been explored. S<strong>in</strong>ce sexual<br />
reproduction through outcross<strong>in</strong>g <strong>in</strong>creases the genetic variation and enables a<br />
species <strong>to</strong> adapt <strong>to</strong> chang<strong>in</strong>g environments, we hypothesize that arctic <strong>plant</strong>s prioritize<br />
on reproduction, as has been shown for <strong>in</strong>creas<strong>in</strong>g altitude <strong>in</strong> the Alps. We tested this<br />
hypothesis <strong>in</strong> <strong>Svalbard</strong> <strong>in</strong> summer 2007 along a climatic gradient between 78° N and<br />
80° N. By us<strong>in</strong>g ratios between <strong>in</strong>florescence size vs. <strong>plant</strong> height or leaf length we<br />
found that forbs on average <strong>in</strong>vest proportionally more <strong>in</strong> reproductive than vegetative<br />
growth as it gets colder. In the gram<strong>in</strong>oids studied along the same gradient, size<br />
changes were isometric. We expla<strong>in</strong> this by the different mode of sexual reproduction.<br />
Insect poll<strong>in</strong>ation dependent species have <strong>to</strong> attract poll<strong>in</strong>a<strong>to</strong>rs <strong>in</strong> an <strong>in</strong>creas<strong>in</strong>gly<br />
barren landscape with overproportionally showy flowers. The trend we observed <strong>in</strong><br />
<strong>in</strong>sect poll<strong>in</strong>ated species matches the trend seen <strong>in</strong> the Alps. We may thus conclude<br />
that arctic and alp<strong>in</strong>e forbs prioritize dry matter allocation <strong>in</strong> favor of sexual<br />
reproduction. Similar <strong>to</strong> the Alps, this does not hold for the w<strong>in</strong>d poll<strong>in</strong>ated<br />
gram<strong>in</strong>oids.<br />
Introduction<br />
The way <strong>in</strong> which <strong>plant</strong>s reproduce determ<strong>in</strong>es the evolutionary processes and thus<br />
the <strong>plant</strong>s’ ability <strong>to</strong> respond <strong>to</strong> their environment. In alp<strong>in</strong>e environments it has been<br />
found that the allocation of resources changes <strong>to</strong>wards the reproductive structures as<br />
altitudes <strong>in</strong>creases (Fabbro & Körner 2003). The <strong>Arctic</strong> is often compared with high<br />
alp<strong>in</strong>e environment assum<strong>in</strong>g that there can be seen similar patterns <strong>in</strong> reproductive<br />
allocation, but this has never been <strong>in</strong>vestigated.<br />
With <strong>in</strong>creas<strong>in</strong>g latitude, as well as with <strong>in</strong>creas<strong>in</strong>g altitude, <strong>plant</strong>s experience a<br />
similar change <strong>in</strong> environmental conditions such as decreas<strong>in</strong>g mean temperatures, a<br />
shorten<strong>in</strong>g of grow<strong>in</strong>g season and a reduction <strong>in</strong> nutrient availability (Körner 2003). It<br />
is widely known that <strong>plant</strong>s liv<strong>in</strong>g <strong>in</strong> cold climates adjust their morphology <strong>to</strong> better<br />
cope with the predom<strong>in</strong>ant local conditions (Körner et al. 1989). Plants trans<strong>plant</strong>ed<br />
from high <strong>to</strong> low altitudes and from high <strong>to</strong> low latitude tend <strong>to</strong> grow bigger and<br />
83
partly lose their high altitude/latitude characteristics, <strong>in</strong>dicat<strong>in</strong>g a high phenotypic<br />
plasticity (Prock & Körner 1996).<br />
Plant growth is almost always limited by some resources and once acquired, these are<br />
<strong>in</strong>vested <strong>in</strong><strong>to</strong> below and above ground structures. The above ground structures are<br />
normally divided <strong>in</strong><strong>to</strong> the vegetative, pho<strong>to</strong>synthesiz<strong>in</strong>g parts and the reproductive<br />
parts or shoots (Seger & Eckhart 1996). Vegetative parts are the basis for further<br />
resource acquisition and for growth and s<strong>to</strong>rage. The fraction of resources allocated <strong>to</strong><br />
reproductive parts does not produce such returns, but exerts costs. Hence there is a<br />
tradeoff between <strong>in</strong>vestment <strong>in</strong> structures which enhance vegetative growth versus<br />
those which enhance reproduction.<br />
There are three ma<strong>in</strong> strategies for <strong>plant</strong>s <strong>to</strong> cope with this tradeoff <strong>in</strong> cold climates<br />
(Jonsdóttir 2005, Körner 2003):<br />
1. Enhanced sexual reproduction: Resource <strong>in</strong>vestment <strong>to</strong> gametes, seeds and<br />
seed dispersal<br />
2. Clonal reproduction: Growth of vegetative structures that detach and grow <strong>in</strong><strong>to</strong><br />
new <strong>in</strong>dividuals with exactly the same genome as the mother <strong>plant</strong><br />
3. Spaceholder strategy: ma<strong>in</strong>ta<strong>in</strong> a position as long as possible (long life)<br />
2 and 3 also need some sexual reproduction <strong>in</strong> the long run, but it is not essential on a<br />
year<strong>to</strong>year basis.<br />
A short grow<strong>in</strong>g season is disadvantageous for many flower<strong>in</strong>g <strong>plant</strong>s. It gives the<br />
<strong>plant</strong> a very limited time span <strong>to</strong> develop blossoms, get poll<strong>in</strong>ated and set seeds. In<br />
addition, the short season limits seedl<strong>in</strong>g establishment. A shift <strong>to</strong> an alternative<br />
strategy such as clonal propagation might be favourable. Bill<strong>in</strong>gs (1974) proposed that<br />
clonal propagation is an important advantageous fac<strong>to</strong>r <strong>in</strong> arctic environments. Clonal<br />
reproduction (e.g. bulbils, runners and s<strong>to</strong>lons) competes with sexual reproduction for<br />
resources. Interconnected clones are more robust aga<strong>in</strong>st disturbance and harshen<strong>in</strong>g<br />
climates, because connected ramets can share resources ( Jonsdottir & Callaghan<br />
1990, Carlsson & Callaghan 1990).<br />
It has been suggested that sexual reproduction is the predom<strong>in</strong>ant, sometimes<br />
the only reproductive mode, <strong>in</strong> as many as 60% of the 163 known <strong>Svalbard</strong> flower<strong>in</strong>g<br />
<strong>plant</strong>s (Brochmann & Steen 1999). Sexual reproduction secures high rates of<br />
evolutionary adaptation and, thus, better survival <strong>in</strong> stressdom<strong>in</strong>ated environments,<br />
i.e. greater fitness (Raffl et al. 2006). However, this needs outbreed<strong>in</strong>g reproductive<br />
systems which require crosspoll<strong>in</strong>ation, hence <strong>in</strong>sect visitation. As a result of pollen<br />
(poll<strong>in</strong>a<strong>to</strong>r) limitation, many high arctic species are shown <strong>to</strong> be highly selfcompatible<br />
(Brochmann & Steen 1999). Self<strong>in</strong>g (fertilization of egg with pollen from the same<br />
<strong>in</strong>dividual) has many disadvantages. The ma<strong>in</strong> disadvantage is <strong>in</strong>breed<strong>in</strong>g that reduces<br />
heterozygosity. The loss of heterozygosity <strong>in</strong>creases the expression of deleterious<br />
alleles lead<strong>in</strong>g <strong>to</strong> <strong>in</strong>breed<strong>in</strong>g depression (Heshel et al. 2005). As negative this might<br />
seem, <strong>in</strong>breed<strong>in</strong>g still generates some genetic variation because gamets are never<br />
genetically identical (as result of meisosis), hence there is still a mix<strong>in</strong>g of alleles <strong>in</strong><br />
each gamete relative <strong>to</strong> the other. This yields a small genetic diversification of the<br />
offspr<strong>in</strong>g, which still might select for a better ability <strong>to</strong> cope with specific<br />
environmental conditions (Mart<strong>in</strong> & Hospital 2005).<br />
84
Plants produc<strong>in</strong>g superior offspr<strong>in</strong>g are more widespread and have a higher over all<br />
success. As long as there are events of <strong>in</strong>sect poll<strong>in</strong>ation, the cost of <strong>in</strong>vest<strong>in</strong>g <strong>in</strong><br />
reproductive organs is outweighed by the benefit of out cross<strong>in</strong>g. Therefore, we<br />
expect <strong>plant</strong>s liv<strong>in</strong>g <strong>in</strong> the high <strong>Arctic</strong> <strong>to</strong> <strong>in</strong>vest more <strong>in</strong> their sexually reproductive<br />
traits as Fabbro & Körner (2003) found <strong>in</strong> their comparison of lowland and alp<strong>in</strong>e<br />
<strong>plant</strong>s <strong>in</strong> the Swiss Alps. They found that blossomdisplay area did not changed<br />
between lowland and high alp<strong>in</strong>e areas. At the same time they found that shoot size is<br />
reduced nearly 10fold. One of our objectives with this study was <strong>to</strong> see whether the<br />
same can be found <strong>in</strong> the high <strong>Arctic</strong>, us<strong>in</strong>g a bioclimatical gradient <strong>in</strong> the archipelago<br />
of <strong>Svalbard</strong>.<br />
We hypothesize that high arctic <strong>plant</strong>s, similar <strong>to</strong> alp<strong>in</strong>e <strong>plant</strong>s, <strong>in</strong>vest relatively more<br />
<strong>in</strong> reproductive structures than temperate lowland <strong>plant</strong>s. In addition we expect that<br />
with<strong>in</strong> the arctic zone there is a trend <strong>to</strong>wards greater allocation <strong>to</strong> <strong>in</strong>florescences as<br />
the climate gets harsher. In summary, we expect that<br />
1. <strong>plant</strong>s will become smaller <strong>in</strong> harsher climates<br />
2. blossom diameter will not differ between bioclimatic zones<br />
These predictions should hold for forbs, i.e. nonw<strong>in</strong>d poll<strong>in</strong>ated species. Whether this<br />
holds for w<strong>in</strong>d poll<strong>in</strong>ated species depends on whether <strong>in</strong>florescence size has similar<br />
effects on captur<strong>in</strong>g w<strong>in</strong>ddriven pollen flow, which we will explore as well.<br />
Materials and methods<br />
A <strong>to</strong>tal of 37 species have been studied <strong>in</strong> ten different localities (see table 1) on the<br />
northwest coast of the <strong>Svalbard</strong> archipelago. <strong>Svalbard</strong> spans over several degrees of<br />
latitude and therefore has a wide range of temperatures. In addition the golf stream<br />
affects climatic conditions at the west coast . In this <strong>in</strong>vestigation we followed the<br />
def<strong>in</strong>ition of bioclimatic zones (BZ) by Elvebakk et al. (1999). Accord<strong>in</strong>gly, places<br />
with a mean July temperature between 0° and 2.5°C belong <strong>to</strong> BZ A, 2.5 <strong>to</strong> 4°C <strong>to</strong> B<br />
and 4 <strong>to</strong> 6°C <strong>to</strong> BZ C.<br />
In <strong>to</strong>tal 37 species were measured, the majority of them <strong>in</strong> at least two BZ. Seventeen<br />
species have been measured <strong>in</strong> BZ A (localities 6, 7 and 8), 19 species <strong>in</strong> BZ B<br />
(localities 2, 3, 4 and 5) and 23 species <strong>in</strong> BZ C (localities 1, 9 and 11).But because<br />
the changes between the BZ’s that were <strong>in</strong>terest<strong>in</strong>g only use data for n<strong>in</strong>e species (five<br />
forbes and four gram<strong>in</strong>oids) which were found <strong>in</strong> all the three BZ. Each species of<br />
these were measured 15 <strong>to</strong> 95 times, <strong>in</strong> <strong>to</strong>tal 353 measurements.<br />
In the <strong>Svalbard</strong> flora, most forbs can be divided <strong>in</strong><strong>to</strong> <strong>to</strong> major growth forms: cushion<br />
<strong>plant</strong>s and rosette <strong>plant</strong>s. In the rosette <strong>plant</strong>s the vegetative and reproductive organs<br />
are not as easy <strong>to</strong> dist<strong>in</strong>guish as is the case of cushion <strong>plant</strong>s. The leaf rosette makes<br />
up the vegetative part whereas the blossom is the reproductive part, but the stem often<br />
shows pho<strong>to</strong>synthetic activity, sometimes has leaves, but it is also the <strong>in</strong>strument of<br />
expos<strong>in</strong>g the blossom <strong>to</strong> the poll<strong>in</strong>at<strong>in</strong>g vec<strong>to</strong>r. The reproductive parts can be clonal<br />
or sexual and many species, e.g. Saxifraga cernua, have both. For our study we<br />
decided <strong>to</strong> measure only species <strong>in</strong> which <strong>in</strong>dividuals were easy <strong>to</strong> dist<strong>in</strong>guish and<br />
85
preferably grow <strong>in</strong> rosettes, which excludes cuhions. Cerastium arcticum had <strong>to</strong> be<br />
<strong>in</strong>cluded <strong>to</strong> enhance our dataset, even though it is matform<strong>in</strong>g.<br />
Table 1. Locality description.<br />
Locality Latitude Longitude Characteristics (bedrock; vegetation type) Bioclimatic<br />
zone<br />
9 Ossian Sarsfjellet 78°93’ 12°47’ acidic <strong>to</strong> alkal<strong>in</strong>e circumneutral;<br />
Cassiope tetragona heath<br />
C<br />
10 Colesdalen 78°11’ 15°13’ weakly acidic; DryasCassiope heath C<br />
1 Kapp Thordsen 78°46’ 15°51’ weakly acidic; calcareous fens C<br />
2 Mayerbukta 79°26’ 12°16’ acidic mora<strong>in</strong>e B<br />
3 Fjortende Julibreen 79°13’ 11°86’ acidic; mesic Luzula confusa B<br />
4 Biskayabukta 79°84’ 12°40’ acidic; mesic Luzula confusa B<br />
5 Re<strong>in</strong>sdyrsflya 79°83’ 13°90’ slightly acidic; Poa alp<strong>in</strong>a snow bed comm. B<br />
6 Florabukta 80°04’ 18°70’ alkal<strong>in</strong>e circumneutral; mesic Luzula nivalis A/B<br />
7 Nordre<br />
Frankl<strong>in</strong>breen<br />
80°15’ 19°66’ acidic; Luzula confusa <strong>polar</strong> <strong>desert</strong> A<br />
8 Lågøya 80°21’ 18°17’ weakly acidic; Papaver <strong>polar</strong> <strong>desert</strong> A<br />
Only <strong>plant</strong>s that were mature but not senescent were measured. Measurements with a<br />
ruler (<strong>to</strong> 1mm accuracy) <strong>in</strong>cluded aboveground <strong>plant</strong> height, longest leaf length<br />
(without petiole) or width, respectively (if the width was larger than the length) and<br />
largest blossom diameter or length of the whole <strong>in</strong>florescence <strong>in</strong> gram<strong>in</strong>oids,<br />
respectively. At least three samples of each forb species were harvested. The largest<br />
s<strong>in</strong>gle <strong>in</strong>dividuals from each species were chosen <strong>in</strong> each locality. The three <strong>plant</strong>s<br />
harvested for biomass determ<strong>in</strong>ation were separated <strong>in</strong><strong>to</strong> stem fraction, leaf fraction<br />
(<strong>in</strong>clud<strong>in</strong>g petioles) and blossom fraction, dried and weighed (only forbs, not<br />
gram<strong>in</strong>oids).<br />
The blossom area (A) of forbs was calculated from diameter by assum<strong>in</strong>g a circular<br />
shape. A Person productmoment correlation was used <strong>to</strong> test the correlation between<br />
biomass and biometric data. Differences <strong>in</strong> the ratios of heightleaf, blossomleaf and<br />
blossom height versus zones were tested with (one way) ANOVA. The same analysis<br />
was taken <strong>to</strong> test differences <strong>in</strong> the biomass fractions vs. zones. In these statistical<br />
tests we chose the ten biggest <strong>in</strong>dividual <strong>plant</strong>s when we had more than ten<br />
<strong>in</strong>dividuals. For the comparison between the bioclimatic zonespecific general means<br />
across species were used. For the comparisons at the species level we used mean<br />
86
values per species. A ttest was used <strong>to</strong> compare the gram<strong>in</strong>oids of the Alps with the<br />
gram<strong>in</strong>oids of <strong>Svalbard</strong>. For all tests the program SPlus 7.0 was used.<br />
Results<br />
Forbs<br />
The correlation between biomass and biometrics measures was high for all traits<br />
(blossom area p=0.013, R 2 =0.52; height: p=0.023, R 2 =0.71; leaf length p=0.016,<br />
R 2 =0.68). Thus, for further analyses the biometric data for which we have larger<br />
sample size were used only (rather than the biomass data).<br />
For forbs, blossom size <strong>to</strong> leaf length ratio is significantly larger <strong>in</strong> harsher climates.<br />
Also the blossom area <strong>to</strong> <strong>plant</strong> height ratio <strong>in</strong>creases with harsher climate, but the<br />
<strong>plant</strong> height <strong>to</strong> leaf ratio shows the opposite result and is decreas<strong>in</strong>g (Table 2). In<br />
other words, <strong>plant</strong>s <strong>in</strong>vest relatively more <strong>in</strong> blossoms when the climate gets more<br />
adverse, and <strong>plant</strong> size is affected more than leaf size, which commonly means that<br />
blossoms are displayed closer <strong>to</strong> the ground (Fig. 1). For <strong>in</strong>dividual species, the<br />
blossom <strong>to</strong> <strong>plant</strong> height ratio was higher <strong>in</strong> BZ A than <strong>in</strong> C for most species (Table 3).<br />
Figure 1. Reproductive allocation of <strong>plant</strong>s <strong>in</strong> <strong>Svalbard</strong>. Inflorescence size corresponds <strong>to</strong><br />
blossom diameter <strong>in</strong> forbs and <strong>to</strong> spike length <strong>in</strong> gram<strong>in</strong>oids. The temperatures are<br />
accord<strong>in</strong>g <strong>to</strong> Walker et al 2005 for the <strong>to</strong>tal arctic. The accord<strong>in</strong>g temperatures for<br />
<strong>Svalbard</strong> (oceanic climate are somewhat lower accord<strong>in</strong>g <strong>to</strong> Elvebakk 1999, see<br />
above.<br />
87
Forbs<br />
Gram<strong>in</strong>oid<br />
Gram<strong>in</strong>oids<br />
In gram<strong>in</strong>oids only the <strong>plant</strong> height/leaf length ratio shows a decrease <strong>in</strong> harsher<br />
climates (Table 2 and 4), which means that <strong>to</strong>tal <strong>plant</strong> height is more reduced than leaf<br />
length. The <strong>in</strong>florescence length/<strong>plant</strong> height ratio is unaffected (Fig. 1).<br />
Table 2. Biometric ratios of forbs and gram<strong>in</strong>oid species from the three bioclimatic zones on<br />
<strong>Svalbard</strong>. * = p
Table 4. Species level comparison of ratios <strong>in</strong> gram<strong>in</strong>oids <strong>in</strong> different bioclimatic zones on<br />
<strong>Svalbard</strong>. No significant differences were found.<br />
Zone A<br />
mean±SE (n)<br />
Zone B<br />
mean±SE (n)<br />
89<br />
Zone C<br />
mean±SE (n)<br />
Fvalue<br />
<strong>in</strong>florescence length/leaf<br />
length ratio<br />
Juncus biglumis 0.23±0.074 (10) 0.15±0.05 (2) 0.236±0.036 (10) 0.41<br />
Luzula confusa 0.12±0.013 (46) 0.24±0.02 (34) 0.232±0.021 (15) 21.47<br />
Luzula nivalis 0.27±0.075 (6) 0.29±0.04 (4) 0.202±0.023 (10) 1.57<br />
Poa arctica 0.76±0.11 (21) 0.93±0.13 (11) 1.256±0.098 (14) 6.27<br />
<strong>in</strong>florescence length/<strong>plant</strong><br />
height ratio<br />
Juncus biglumis 0.11±0.01 (10) 0.09±0.02 (2) 0.117±0.017 (10) 0.15<br />
Luzula confusa 0.08±0.01 (46) 0.14±0.01 (34) 0.106±0.016 (15) 12.52<br />
Luzula nivalis 0.15±0.04 (6) 0.30±0.05 (4) 0.104±0.006 (10) 14.09<br />
Poa arctica 0.35±0.02 (21) 0.40±0.02 (11) 0.386±0.029 (14) 1.20<br />
<strong>plant</strong> height/leaf length<br />
ratio<br />
Juncus biglumis 1.83±0.35 (10) 1.61±0.18 (2) 2.097±0.224 (10) 0.65<br />
Luzula confusa 1.59±0.09 (46) 1.66±0.08 (34) 2.697±0.367 (15) 6.91<br />
Luzula nivalis 1.80±0.12 (6) 0.98±0.048 (4) 1.934±0.178 (10) 12.89<br />
Poa arctica 2.20±0.315 (21) 2.26±0.28 (11) 3.429±0.280 (14) 5.73<br />
Discussion<br />
In our <strong>in</strong>vestigation we found that forbs allocated resources <strong>in</strong> favour of reproductive<br />
structures as it gets colder. As predicted we found a significant reduction <strong>in</strong> overall<br />
<strong>plant</strong> size and leaf size as climate gets harsher. However, blossom size of forbs<br />
decl<strong>in</strong>ed much less whereas gram<strong>in</strong>oid <strong>in</strong>florescences decl<strong>in</strong>ed more or less<br />
proportional <strong>to</strong> <strong>plant</strong> size (isometrically). Hence our hypothesis (2) was not falsified<br />
for forbs, but it was falsified for gram<strong>in</strong>oids.<br />
On species level blossom area did not change <strong>in</strong> a homogenous way. Our results were<br />
either nonsignificant, humped or showed a decrease <strong>to</strong>wards BZ A. For P. dahlianum<br />
and R. pygmaeus the hump might depend on higher competition <strong>in</strong> BZ C or optimal<br />
habitat conditions <strong>in</strong> BZ B. We also have <strong>to</strong> consider the very small sample sizes for<br />
these species <strong>in</strong> BZ C. In S. cernua we see the same decrease <strong>to</strong>wards BZ A as <strong>in</strong> the<br />
overall species comparison. In BZ C we measured only two <strong>plant</strong>s of S. cernua and<br />
they might not be representative, s<strong>in</strong>ce they also reproduces asexually <strong>in</strong> form of<br />
bulbils. Therefore it is difficult <strong>to</strong> draw valid conclusions about resource allocation <strong>in</strong><br />
this species.<br />
There are few <strong>in</strong>sect species and no bumblebees or bees <strong>in</strong> <strong>Svalbard</strong> (Coulson et al.<br />
2003). Hence, the species assemblage <strong>in</strong> <strong>Svalbard</strong> lacks the species that are the most<br />
important poll<strong>in</strong>a<strong>to</strong>rs <strong>in</strong> temperate regions. This may enhance the evolutionary<br />
pressure <strong>to</strong> produce showy flowers.<br />
Diptera function as the ma<strong>in</strong> poll<strong>in</strong>a<strong>to</strong>rs (Coulson et al. 2003). As most of them are<br />
small, they have <strong>to</strong> stay close <strong>to</strong> the ground <strong>to</strong> avoid gett<strong>in</strong>g blown away by strong<br />
w<strong>in</strong>ds that are typical for the archipelago. It seems that there is no reason for high
latitude <strong>plant</strong>s on <strong>Svalbard</strong> <strong>to</strong> keep a long stem for attract<strong>in</strong>g poll<strong>in</strong>a<strong>to</strong>rs. Rather it is<br />
the other way around. If the blossom gets closer <strong>to</strong> the ground they get closer <strong>to</strong> their<br />
poll<strong>in</strong>a<strong>to</strong>rs. Even if there were poll<strong>in</strong>a<strong>to</strong>rs that might respond <strong>to</strong> taller flower<strong>in</strong>g<br />
stems, frost damage and mechanical damage by strong w<strong>in</strong>ds could impose higher<br />
costs than the <strong>plant</strong> would benefit from expos<strong>in</strong>g the blossom <strong>to</strong> potential poll<strong>in</strong>a<strong>to</strong>r.<br />
Gram<strong>in</strong>oid <strong>plant</strong> species are mostly poll<strong>in</strong>ated by w<strong>in</strong>d. If a w<strong>in</strong>d poll<strong>in</strong>ated <strong>plant</strong> is<br />
not tall enough, the pollen falls on the ground, hence reduc<strong>in</strong>g dispersal. Hav<strong>in</strong>g the<br />
soike sheltered below the surround<strong>in</strong>g vegetation, pollen would not be captured by<br />
w<strong>in</strong>d. Our data illustrate the aerodynamic demands of gram<strong>in</strong>oids and h<strong>in</strong>t at different<br />
evolutionary forces <strong>in</strong> forbs and gram<strong>in</strong>oids.<br />
A comparison with the data published by Fabbro & Körner (2003) <strong>in</strong>dicates a<br />
significant difference only <strong>in</strong> the blossom mass with a smaller mean blossom size <strong>in</strong><br />
the <strong>Svalbard</strong> archipelago, but <strong>in</strong> both cases blossoms are relatively larger <strong>in</strong> cold areas<br />
(higher altitude or higher latitude, Figure 2). However, the effect is more pronounced<br />
<strong>in</strong> the Alps (relatively bigger blossoms). Statistically tests of this comparison were not<br />
possible, s<strong>in</strong>ce we did not have sufficient data from the Alps. The rough estimate is<br />
based on Figure 3 <strong>in</strong> the publication of Fabbro & Körner (2003).<br />
The gram<strong>in</strong>oid data collected <strong>in</strong> <strong>Svalbard</strong> were compared with the gram<strong>in</strong>oid data<br />
from the Alps (pers. communication by B. Krummen, Basel). Ttests showed no<br />
difference <strong>in</strong> height and no difference <strong>in</strong> <strong>in</strong>florescence length between the alp<strong>in</strong>e belt<br />
<strong>in</strong> the Alps and the high <strong>Arctic</strong>. The ratios show some difference though, with<br />
<strong>in</strong>florescence lengthleaf ratio be<strong>in</strong>g statistically different (t = 2.086, df = 45, pvalue<br />
= 0.0427). The <strong>in</strong>florescence length <strong>plant</strong> height ratio does not differ and neither does<br />
the <strong>plant</strong> heightleaf length ratio. S<strong>in</strong>ce leaf size measures were done differently <strong>in</strong> the<br />
Alps, this is not surpris<strong>in</strong>g. Still the general conclusion for gram<strong>in</strong>oids is that there is<br />
no divergence between the Alps and the high <strong>Arctic</strong>. In both cases, gram<strong>in</strong>oids and<br />
their <strong>in</strong>florescences decl<strong>in</strong>e <strong>in</strong> size isometrically.<br />
The reason why we see such contrast<strong>in</strong>g patterns between the two growth forms <strong>in</strong><br />
this comparison might be due <strong>to</strong> the different strategies of poll<strong>in</strong>ation, by w<strong>in</strong>d or<br />
animals. W<strong>in</strong>d dispersal probably does not differ that much between the high <strong>Arctic</strong><br />
and high altitudes <strong>in</strong> the Alps. On the other hand the <strong>in</strong>sect poll<strong>in</strong>ated species<br />
experience a completely different set of poll<strong>in</strong>a<strong>to</strong>rs that changes the selective pressure<br />
on blossom morphology <strong>to</strong>wards <strong>in</strong>creas<strong>in</strong>g display area <strong>in</strong> the Alps.<br />
90
Blossom<br />
Stem<br />
Leaf<br />
17,1%<br />
20,2%<br />
24,6%<br />
33,8%<br />
91<br />
49,1%<br />
55,2%<br />
0,000 0,100 0,200 0,300 0,400 0,500 0,600 0,700<br />
High latitude species High alp<strong>in</strong>e species<br />
Figure 2. Plant dry biomas fractions from the Alps and <strong>Svalbard</strong> (from Fabbro and Körner<br />
2003). Biomass data from <strong>Svalbard</strong> not shown <strong>in</strong> the previous text, because they<br />
show the same patterns as the size data.<br />
Conclusion<br />
As the general <strong>plant</strong> size decreases with harshen<strong>in</strong>g climate, the reproductive<br />
<strong>in</strong>vestment is enlarged <strong>in</strong> forbs. Gram<strong>in</strong>oids on the other hand, change isometrically<br />
along the same gradient. This is probably due <strong>to</strong> different poll<strong>in</strong>ation systems. The<br />
comparison between the Alps and <strong>Svalbard</strong> revealed that the blossom size relative <strong>to</strong><br />
vegetative traits <strong>in</strong> forbs is bigger <strong>in</strong> the Alps than <strong>in</strong> <strong>Svalbard</strong>, but the trend goes <strong>in</strong><br />
the same direction. Gram<strong>in</strong>oids show the same patterns <strong>in</strong> <strong>Svalbard</strong> as <strong>in</strong> the Alps.<br />
Poll<strong>in</strong>a<strong>to</strong>rdriven poll<strong>in</strong>ation thus selects <strong>in</strong>florescence size differently from w<strong>in</strong>d<br />
driven poll<strong>in</strong>ation.<br />
Further studies <strong>in</strong> <strong>Svalbard</strong> on reproductive allocation should be more related <strong>to</strong> the<br />
poll<strong>in</strong>at<strong>in</strong>g species, the possibility of self<strong>in</strong>g as well as the ability of clonal<br />
reproduction.<br />
For comparison between the alp<strong>in</strong>e and arctic regions same genus should be<br />
considered <strong>to</strong> reduce effects of basic morphological differences.<br />
References<br />
Bill<strong>in</strong>gs, W. D. 1974: Adaptations and orig<strong>in</strong>s of alp<strong>in</strong>e <strong>plant</strong>s. <strong>Arctic</strong> and Alp<strong>in</strong>e<br />
Research 6:129142<br />
Brochmann, C. & Steen, S. 1999: Sex and Genes <strong>in</strong> he Flora of <strong>Svalbard</strong><br />
Implications for Conservation Biology and Climate Change. Det Norske<br />
VitenskapsAkademi. I. Matematisk Naturvitenskapelig Klasse, Skrifter, Ny Serie<br />
38: 3372<br />
Carlsson, B. A. & Callaghan, T. V. 1990: Effects of flower<strong>in</strong>g on the shoot dynamics<br />
of Carex bigelowii along an altitud<strong>in</strong>al gradient <strong>in</strong> Swedish Lapland. Journal of<br />
Ecology 78:152165<br />
Coulson, S.J., Hodk<strong>in</strong>son, I. D. & Webb N. R. 2003: Aerial dispersal over a high<br />
arctic glacier foreland: Midtre Lovénbreen, <strong>Svalbard</strong>. Polar biology 26: 530537
Elvebakk A. 1999: Bioclimatic delimitation and subdivision of the arctic. Det Norske<br />
VitenskapsAkademi. I. Matematisk Naturvitenskapelig Klasse, Skrifter, Ny Serie<br />
38: 81112<br />
Elvebakk, A. 2005: A vegetation map of <strong>Svalbard</strong> on the scale 1 : 3.5 mill.<br />
Phy<strong>to</strong>coenologia 35: 951967<br />
Fabbro, T. & Körner, C. 2004: Altitud<strong>in</strong>al differences <strong>in</strong> flower traits and<br />
reproductive allocation. Flora 199: 7081<br />
Heschel, M. S., Hausmann, N. & Schmitt, J. 2005: Test<strong>in</strong>g for stressdependent<br />
Inbreed<strong>in</strong>g Depression <strong>in</strong> Impatiens capensis (Balsam<strong>in</strong>aceae). American Journal of<br />
Botany 92: 13221329<br />
Jonsdottir, I. S. & Callaghan, T. V. 1990: Intraclonal translocation of ammonium and<br />
nitrate nitrogen <strong>in</strong> Carex bigelowii Torr. ex Schwe<strong>in</strong>. us<strong>in</strong>g 15N and nitrate<br />
reductase assays. New Phy<strong>to</strong>logist 114: 419428<br />
Jónsdóttir, I. S. 2005: Terrestrial ecosystems on <strong>Svalbard</strong>: heterogeneity, complexity<br />
and fragility from an arctic island perspective. Biology and Environmen:<br />
proceed<strong>in</strong>gs of the Royal Irish Academy, 105B: 155165<br />
Körner, C., Neumayer, M., Pelaez MenendezRiedl, S. & SmeetsScheel, A. 1989:<br />
Functional morphology of mounta<strong>in</strong> <strong>plant</strong>s. Flora 182: 353383<br />
Körner, C. 1999: Alp<strong>in</strong>e <strong>plant</strong> life Functional Plant Ecology if High Mounta<strong>in</strong><br />
Ecosystems Spr<strong>in</strong>ger Berl<strong>in</strong><br />
Mart<strong>in</strong>, O. C. & Hospital, F. 2005: Two and TreeLocus Tests for L<strong>in</strong>kage Analysis<br />
Us<strong>in</strong>g Recomb<strong>in</strong>ant Inbred L<strong>in</strong>es. Genetics Society of America 173: 451459<br />
Prock, S. & Körner, C. 1996: A crosscont<strong>in</strong>ental comparison of phenology, leaf<br />
dynamics and dry matter allocation <strong>in</strong> arctic and temperate zone herbaceous <strong>plant</strong>s<br />
from contrast<strong>in</strong>g altitudes. Ecological Bullet<strong>in</strong>s 45: 93103<br />
Raffl, C., Marcante, S. & Erschbamer, B. 2007: The role of spontaneous self<strong>in</strong>g <strong>in</strong> the<br />
pioneer species Saxifraga aizoides. Flora 202: 128132<br />
Seger, J. & Eckhart, V.M. 1996: Evolution of sexual systems and sex allocation <strong>in</strong><br />
<strong>plant</strong>s when growth and reproduction overlap. Proceed<strong>in</strong>gs of the Royal Society of<br />
London series bBiological Sciences 263: 833<br />
92
Freez<strong>in</strong>g resistance <strong>in</strong> high arctic <strong>plant</strong> species of<br />
<strong>Svalbard</strong> <strong>in</strong> midsummer<br />
Christian Körner 1,3 and Inger Greve Alsos 2,3<br />
1 Institute of Botany, University of Basel, Schönbe<strong>in</strong>strasse 6, 4056 Basel, Switzerland,<br />
ch.koerner@unibas.ch, 2 UNIS The University Centre <strong>in</strong> <strong>Svalbard</strong>, P.O. Box 156, 9171 Longyearbyen,<br />
Norway, <strong>in</strong>gera@unis.no, 3 Results of the summer course <strong>Arctic</strong> Plant Ecology (AB 326) at UNIS with<br />
13 students: Ane Christensen Tange, Christian Engebretsen Pettersen, Eike Müller, Elke Morgner,<br />
Emma Krist<strong>in</strong>a Bengtsson, Heike Baldeweg, Henrik An<strong>to</strong>nsson, Ingel<strong>in</strong>n Aarnes, Kathr<strong>in</strong> Bockmühl,<br />
Marte Holten Jørgensen, Merete Wiken Dees, Simone Lang, Unni Vik<br />
Abstract<br />
It is well known that freez<strong>in</strong>g temperatures put arctic and alp<strong>in</strong>e <strong>plant</strong>s at risk dur<strong>in</strong>g<br />
the grow<strong>in</strong>g period only. Here we explore responses of high arctic <strong>plant</strong> species <strong>to</strong> a<br />
simulated early summer freez<strong>in</strong>g event of 7 °C. After gradual cool<strong>in</strong>g, several hours<br />
at target conditions and slow thaw<strong>in</strong>g over 21 hours, the 12 species tested exhibited a<br />
broad damage spectrum from zero <strong>to</strong> 100%. We conclude that 7 °C is a critical<br />
temperature for many arctic taxa, and repeated freez<strong>in</strong>g episodes like this would exert<br />
major changes <strong>in</strong> species abundance.<br />
Key words: Cold climate, frost, low temperature, Spitsbergen<br />
Introduction<br />
Freez<strong>in</strong>g resistance is the first and most fundamental environmental filter <strong>plant</strong><br />
species have <strong>to</strong> pass <strong>to</strong> establish susta<strong>in</strong>ably <strong>in</strong> periodically cold environments. The<br />
taxa found <strong>in</strong> areas with periodic freez<strong>in</strong>g temperatures have <strong>to</strong> be resistant, otherwise<br />
they would not be there. However, freez<strong>in</strong>g <strong>to</strong>lerance of <strong>plant</strong>s has two aspects. One is<br />
the loss of certa<strong>in</strong> (aboveground) organs such as leaves and flowers, another one is<br />
the complete ext<strong>in</strong>ction of an <strong>in</strong>dividual. The repeated occurrence of the first may,<br />
however, pave the way <strong>to</strong> the second. Another facet of freez<strong>in</strong>g <strong>to</strong>lerance is time,<br />
which aga<strong>in</strong> has two dimensions, a short term and a long term. In the short term,<br />
freez<strong>in</strong>g <strong>to</strong>lerance goes through seasonal cycles of acclimation, with harden<strong>in</strong>g and<br />
deharden<strong>in</strong>g associated with both pho<strong>to</strong>period and experienced temperature (Sakai &<br />
Larcher 1987, Heide 2005). Plants are commonly much more susceptible when they<br />
are active, i.e. dur<strong>in</strong>g the grow<strong>in</strong>g season, than dur<strong>in</strong>g the dormant season (w<strong>in</strong>ter).<br />
Tissues of arctic and alp<strong>in</strong>e <strong>plant</strong>s may <strong>to</strong>lerate almost any temperature (some even<br />
liquid nitrogen) when they are dormant, but might be killed at temperatures between <br />
2 and 9 °C, when actively grow<strong>in</strong>g and flower<strong>in</strong>g. Hence it is well established that<br />
extreme summer events are the critical issue <strong>to</strong> look at (for a review see Körner 2003).<br />
The climate of <strong>Svalbard</strong> is quite untypical for the given latitud<strong>in</strong>al position between<br />
76.5° and 80.5° of northern latitude, because the Archipelago is hit by the golf stream,<br />
caus<strong>in</strong>g its temperatures <strong>to</strong> lack extremes known for other high arctic and antarctic<br />
latitudes, both <strong>in</strong> terms of w<strong>in</strong>ter m<strong>in</strong>ima and summer maxima (Engelskjøn et al.<br />
2003, Przybylak 2007). Although the annual mean temperature is ca. 5 °C at sea<br />
level at the Longyearbyen airport station (a comparatively warm area for <strong>Svalbard</strong>; for<br />
93
a climate description see Rønn<strong>in</strong>g 1996), the 30 year absolute m<strong>in</strong>ima there are 10 °C<br />
for June and 0 °C for July (the lowest temperature ever measured, 46 °C <strong>in</strong> March;<br />
annual absolute maximum +23 °C <strong>in</strong> July). At sea level and <strong>in</strong> favorable regions, such<br />
as the <strong>in</strong>ner Fjords, the grow<strong>in</strong>g season normally does not last longer than 80100<br />
days <strong>in</strong> the warmest places. It may be as short as 6 weeks <strong>in</strong> less sheltered coastal sites<br />
and there is hardly any higher <strong>plant</strong> growth <strong>in</strong> the <strong>polar</strong> <strong>desert</strong> north of 80°. Even the<br />
most favorable locations do not permit upright shrubs <strong>to</strong> grow. The about 165 higher<br />
<strong>plant</strong> species known for <strong>Svalbard</strong> (Brochmann & Steen 1999, Rønn<strong>in</strong>g 1996, Elven &<br />
Elvebakk 1996), all have their grow<strong>in</strong>g po<strong>in</strong>ts (apical meristems) with<strong>in</strong> a few<br />
centimeters above ground or below the soil surface (the majority), only expos<strong>in</strong>g<br />
leaves and flowers <strong>to</strong> atmospheric conditions. These tissues may thus be experienc<strong>in</strong>g<br />
short term low temperature extremes, while subsurface structures would profit from<br />
the moderat<strong>in</strong>g <strong>in</strong>fluence of immersion <strong>in</strong> soil.<br />
Although the sun is sh<strong>in</strong><strong>in</strong>g 24 hours <strong>in</strong> summer, and even midnight sun is quite<br />
<strong>in</strong>tense, slope <strong>in</strong>cl<strong>in</strong>ation and slope direction can cause a periodic screen<strong>in</strong>g of<br />
vegetation from direct <strong>in</strong>solation. While direct solar radiation is commonly caus<strong>in</strong>g<br />
<strong>plant</strong> temperature <strong>to</strong> rise above air temperature <strong>in</strong> the arctic (by 417K accord<strong>in</strong>g <strong>to</strong><br />
Biebl 1968), the lack of direct <strong>in</strong>solation can cause ground surface temperatures <strong>to</strong><br />
drop below air temperature by radiative cool<strong>in</strong>g under clear sky conditions (Körner<br />
2003). Temperatures may be 24 K below the air temperature a meteorological station<br />
might record under standard measurement conditions. In addition, altitude causes a<br />
mean reduction of 0.7K per100 m <strong>in</strong> this area and flower<strong>in</strong>g <strong>plant</strong>s grow above 500 m<br />
a.s.l. <strong>in</strong> some places. Hence, <strong>plant</strong>s may experience temperatures as low as 15 °C <strong>in</strong><br />
June or 5 °C <strong>in</strong> July, at least once <strong>in</strong> a century, at the climatic conditions recorded so<br />
far. Most recently, the climate <strong>in</strong> <strong>Svalbard</strong> has warmed significantly, and most<br />
glaciers retreat (Przybylak 2007). However, a warmer climate may not exclude/reduce<br />
the likelihood of such extreme events, but may accelerate spr<strong>in</strong>g development and<br />
thus, actually enhance the risk of <strong>plant</strong>s becom<strong>in</strong>g exposed <strong>to</strong> such conditions <strong>in</strong> June<br />
(the beg<strong>in</strong>n<strong>in</strong>g of the grow<strong>in</strong>g season). It would thus be good <strong>to</strong> know how sensitive<br />
<strong>plant</strong> species actually are <strong>to</strong> summer time freez<strong>in</strong>g events and whether such events<br />
could cause differential damage across species and thereby <strong>in</strong>fluence community<br />
composition. We explored this possibility <strong>in</strong> a small screen<strong>in</strong>g experiment, us<strong>in</strong>g fully<br />
developed, flower<strong>in</strong>g <strong>plant</strong> <strong>in</strong>dividuals of 12 common species grow<strong>in</strong>g at 30 m above<br />
sea level, <strong>in</strong> Endalen 4 km east of Longyearbyen.<br />
Methods<br />
At least 5 mature leaves and 5 nonsenescent, fully open <strong>in</strong>florescences (except for S.<br />
nivalis) were collected for each of three treatments (see below) from randomly<br />
selected <strong>in</strong>dividuals around 6 p.m. on July 10, 2007 (3x5=15 samples for 12 species).<br />
Samples were collected <strong>in</strong><strong>to</strong> and transported <strong>to</strong> the lab <strong>in</strong> 100 ml plastic vials and were<br />
exposed <strong>to</strong> the follow<strong>in</strong>g three conditions by 8 p.m. the same day: a cool room at +5<br />
°C (control), a freezer set at 18 °C (guaranteed freez<strong>in</strong>g damage) and a freezer set <strong>to</strong> <br />
7 °C. We had selected the 7 °C treatment because this temperature falls midway the<br />
known range of summertime freez<strong>in</strong>g damage <strong>in</strong> alp<strong>in</strong>e <strong>plant</strong> species (Körner 2003).<br />
All species analyzed here (Table 1) are widespread <strong>in</strong> <strong>Svalbard</strong> and classified as<br />
temperature <strong>in</strong>different species except Dryas oc<strong>to</strong>petala, which is classified as weakly<br />
thermophilous, and Petasites frigidus and Silene furcata, which both are classified as<br />
dis<strong>in</strong>ctly thermophilous species (Elvebakk 1989). Dryas oc<strong>to</strong>petala is common <strong>in</strong> the<br />
northern arctic <strong>tundra</strong> zone but does not grow <strong>in</strong> the <strong>polar</strong> <strong>desert</strong> zone. Petasites<br />
94
frigidus and S. furcata are limited <strong>to</strong> the climatically more favorable <strong>in</strong>ner fjord zone<br />
of <strong>Svalbard</strong> (www.svalbardflora.net).<br />
The two groups of vials <strong>in</strong> the freezers were placed <strong>in</strong> <strong>in</strong>sulat<strong>in</strong>g boxes, so that the<br />
lowest temperature was approached slowly (over several hours), persisted over several<br />
hours (until noon of July 11) and was slowly allowed <strong>to</strong> ramp back <strong>to</strong> +5 C <strong>in</strong> the cool<br />
room. Temperatures were logged <strong>in</strong>side the boxes with one channel temperature<br />
loggers (±0.2 K, Tidbit, Onset Corp., Bourne, USA). By 5 p.m. samples were<br />
removed from the cool room and immersed <strong>in</strong> distilled water <strong>in</strong> petridishes on white<br />
paper at room temperature (Fig. 1). The next morn<strong>in</strong>g (12 July) samples were<br />
<strong>in</strong>spected by eye for discoloration, turgor and/or smell and the immersion water was<br />
checked conduc<strong>to</strong>metrically for ion leach<strong>in</strong>g (cell membrane collaps). Because the<br />
amount of tissue differed greatly (because of different leaf and flower sizes) the<br />
conduc<strong>to</strong>metric read<strong>in</strong>gs have only semiquantitative value. The visual <strong>in</strong>spection was<br />
repeated 24 hours later. In flowers we counted the number of damaged flowers, <strong>in</strong><br />
leaves we estimated the % leaf area damaged per leaf, and calculated a mean.<br />
Figure 1 ab. Assessment of tissue conditions after freez<strong>in</strong>g treatment <strong>in</strong> petridishes filled with<br />
water.<br />
95
Results and Discussion<br />
The m<strong>in</strong>imum temperatures recorded <strong>in</strong> the vic<strong>in</strong>ity of the samples <strong>in</strong> the freezers<br />
were 18.2 and 7.2 °C. All control tissue (+5 °C) rema<strong>in</strong>ed <strong>in</strong>tact, freshly look<strong>in</strong>g,<br />
and served as a reference. All 18° treated tissue was dead and served as a reference<br />
for how damaged tissue looks like. The 7.2 treated cohort exhibited a clearly species<br />
specific differentiation <strong>in</strong> damage, with some species/organ types completely<br />
damaged or undamaged or partially damaged (Tab. 1, Fig.2). Two species turned out<br />
<strong>to</strong> be difficult <strong>to</strong> assess. Saxifraga nivalis leaves largely looked f<strong>in</strong>e, but there was<br />
significant ion leakage <strong>to</strong> the immersion water. Luzula confusa naturally has reddish<br />
and rigid leaves and flowers and neither showed clear color changes nor turgor loss,<br />
nor was ion leakage obvious, but some leaves and flowers looked slightly altered. All<br />
other species/organs could be clearly judged. Damage <strong>in</strong> flowers was generally much<br />
greater, but our sample size was <strong>to</strong>o small <strong>to</strong> rank species <strong>in</strong> a trustworthy manner.<br />
We thus, present two damage categories only for flowers (Tab. 2).<br />
Table 1. Rank<strong>in</strong>g of exam<strong>in</strong>ed <strong>plant</strong> species for freez<strong>in</strong>g damage <strong>in</strong> leaves.<br />
_____________________________________________________________________<br />
_________<br />
Rank Plant species Damage (%) Conductivity (µS)<br />
1 Papaver dahlianum 0 19<br />
2 Dryas oc<strong>to</strong>petala 2 17<br />
3 Petasites frigidus 7 51<br />
4 Saxifraga nivalis 10 54<br />
5 Salix <strong>polar</strong>is 12 17<br />
6 Cerastium arcticum 26 114 a<br />
7 Luzula confusa 40 19<br />
8 Saxifraga cespi<strong>to</strong>sa 58 b<br />
9 Oxyria digyna 60 138<br />
10 Bis<strong>to</strong>rta vivipara 84 63 c<br />
11 Saxifraga cernua 98 239<br />
12 Silene furcata 100 383<br />
a Central, young part of rosette alife, outer and bigger part (older leaves) dead.<br />
b Some soil and dead leaf material attached <strong>to</strong> rosettes, i.e. odd read<strong>in</strong>g.<br />
c Note, the small leaf area is caus<strong>in</strong>g a small signal despite large damage.<br />
In summary, these data show that a 7 °C freez<strong>in</strong>g event at that time of the year and/or<br />
developmental stage of <strong>plant</strong>s would have a dramatic impact on above ground<br />
structures of these <strong>plant</strong>s <strong>in</strong> midsummer. Yet, species known for their occurrence <strong>in</strong><br />
the most extreme <strong>polar</strong> habitats, such as Papaver dahlianum showed not only no leaf<br />
damage, but even a fraction of the otherwise delicate look<strong>in</strong>g, big flowers had<br />
survived. Dryas oc<strong>to</strong>petala commonly ranked as weakly thermophilous (Elvebakk<br />
1989), survived with almost 100% <strong>in</strong>tact foliage. Even more surpris<strong>in</strong>g, Petasites<br />
frigidus, ranked as dist<strong>in</strong>ctly thermophilous (Elvebakk 1989), showed over 90 %<br />
survival. Thus the distribution of this species is probably not limited by extreme low<br />
temperatures. Rather, other fac<strong>to</strong>rs such as limited ability for sexual reproduction<br />
(Brochmann & Steen 1999, Rønn<strong>in</strong>g 1996) may limit its distribution <strong>in</strong> <strong>Svalbard</strong>.<br />
96
Fig. 2 af. Leaf and flower conditions 30 hours after thaw<strong>in</strong>g. <strong>From</strong> left <strong>to</strong> right: control (+5<br />
°C), “mild” freez<strong>in</strong>g (7.2 °C), severe freez<strong>in</strong>g (18.2 °C). a Silene and Cerastium, b<br />
Papaver and Saxifraga cespi<strong>to</strong>sa, c Bis<strong>to</strong>rta and S. cernua, d Luzula and Dryas, e S.<br />
nivalis and Salix, f Oxyria and Petasites<br />
97
Table 2. Rank<strong>in</strong>g of exam<strong>in</strong>ed <strong>plant</strong> species by freez<strong>in</strong>g damage <strong>in</strong> flowers a .<br />
(1) 1030% survival, i.e. 7090 % damage:<br />
Oxyria digyna<br />
Dryas oc<strong>to</strong>petala<br />
Luzula confusa<br />
Saxifraga cespi<strong>to</strong>sa<br />
Papaver dahlianum<br />
Saxifraga nivalis b<br />
(2) 0% survival, i.e. 100 % damage:<br />
Silene furcata<br />
Cerastium arcticum<br />
Bis<strong>to</strong>rta vivipara<br />
Saxifraga cernua<br />
Salix <strong>polar</strong>is<br />
a Petasites frigidus had no flowers.<br />
b Uncerta<strong>in</strong>, flowers looked almost ok.<br />
Of the 5 <strong>in</strong>dividuals (leaf rosette with <strong>in</strong>florescence) of Saxifraga cespi<strong>to</strong>sa, 2<br />
<strong>in</strong>dividuals showed negative geotropism over night, i.e. they uprighted their fully<br />
<strong>in</strong>tact flower<strong>in</strong>g shoots from the flat position <strong>in</strong> the petridish (Fig.3). For half of the<br />
tested species, such an event would eradicate the complete reproductive <strong>in</strong>vestment of<br />
that season, but <strong>in</strong> these species most or all leaves would also be killed.<br />
Silene furcata, the other distictly thermophilous species analysed here, emerged as the<br />
most sensitive species. Hence, it may serve as an <strong>in</strong>dica<strong>to</strong>r species of favourable site<br />
conditions, provided such selective freez<strong>in</strong>g would occur. The <strong>plant</strong> genus does not<br />
seem <strong>to</strong> be of predictive value, given that Saxifraga exhibits particularly sensitive and<br />
robust representatives. Silene acaulis was found <strong>to</strong> be very robust aga<strong>in</strong>st midsummer<br />
freez<strong>in</strong>g near Tromsø (surviv<strong>in</strong>g 8.5 <strong>to</strong> 9 °C; Junttila & Robberecht 1993). The latter<br />
authors had confirmed earlier evidence that growth temperatures have a strong<br />
<strong>in</strong>fluence on actual freez<strong>in</strong>g resistence. It was thus considered that repeated warm<br />
episodes <strong>in</strong> the arctic could weaken freez<strong>in</strong>g <strong>to</strong>lerance (Marchand et al. 2006). We<br />
sampled <strong>plant</strong>s dur<strong>in</strong>g a very warm period, with noon air temperatures of around +12<br />
°C, which could have sensitized our test <strong>plant</strong>s.<br />
The low freez<strong>in</strong>g resistance of Saxifraga cernua was unexpected given that this<br />
species is common <strong>in</strong> the <strong>polar</strong> <strong>desert</strong> zone and is one of the species reach<strong>in</strong>g highest<br />
up <strong>in</strong> the mounta<strong>in</strong>s <strong>in</strong> <strong>Svalbard</strong> (>900 m a.s.l., Sund<strong>in</strong>g 1960). Also, some other<br />
hardy arctic species such as Bis<strong>to</strong>rta vivipara, Oxyria digyna and Saxifraga cepi<strong>to</strong>sa<br />
showed over 50 % freez<strong>in</strong>g damage. Common for all these species is their ability <strong>to</strong><br />
produce viable seeds or bulbils even at cold sites (Cooper et al. 2004). Recruitment<br />
from seed bank may therefore replace any lost <strong>in</strong>dividuals due <strong>to</strong> freez<strong>in</strong>g events and<br />
thus secure longtime survival of these species even at the coldest sites <strong>in</strong> the <strong>Arctic</strong>.<br />
98
Fig. 3 ac. Closeup examples of flower conditions after the 7°C treatment. Note the negative<br />
geotropic position of 2 Saxifraga caespi<strong>to</strong>sa shoots after 30 hours (3a), flowers (one<br />
of each damaged at<br />
7 °C and one undamaged at 7 °C) of Dryas oc<strong>to</strong>petala (3b) and Papaver dahlianum<br />
(3c).<br />
It can be concluded that dur<strong>in</strong>g the grow<strong>in</strong>g season, freez<strong>in</strong>g temperatures of 7 °C or<br />
possible less, would damage a significant fraction of the arctic flora. Given that 10<br />
°C had been recorded for air temperature <strong>in</strong> June, this means that earlier spr<strong>in</strong>g<br />
growth <strong>in</strong> the course of global warm<strong>in</strong>g at an otherwise unchanged likelihood of the<br />
occurrence of such an extreme events would lead <strong>to</strong> massive losses of tissue and<br />
above ground productivity. It would be <strong>in</strong>terest<strong>in</strong>g <strong>to</strong> know, whether low temperature<br />
extremes dur<strong>in</strong>g the grow<strong>in</strong>g season had <strong>in</strong> fact became rarer as the overall means <strong>in</strong><br />
temperatures rose <strong>in</strong> recent years. Our survey <strong>in</strong>dicates the critical range of<br />
temperature <strong>to</strong> be explored <strong>in</strong> a more detailed assessment and that biodiversity<br />
(species identity) matters a lot. Overall, the data appear <strong>to</strong> match the summer freez<strong>in</strong>g<br />
<strong>to</strong>lerance known for alp<strong>in</strong>e <strong>plant</strong>s of the temperate zone (Körner 2003) and do not<br />
<strong>in</strong>dicate a greater frost hard<strong>in</strong>ess for these high arctic <strong>plant</strong>s as had been suggested<br />
from experiments with Saxifraga oppositifolia under controlled growth conditions<br />
(Robberecht & Junttila 1992).<br />
Acknowledgements<br />
UNIS organized and f<strong>in</strong>anced this arctic <strong>plant</strong> <strong>ecology</strong> course <strong>in</strong> July 2007 and<br />
provided the needed <strong>in</strong>frastructure. The participat<strong>in</strong>g students contributed the practical<br />
work and are listed on the title page.<br />
99
References<br />
Biebl, R. 1968: Über Wärmehaushalt und Temperaturresistenz arktischer Pflanzen <strong>in</strong><br />
Westgrönland. Flora 157:327354<br />
Brochmann, C. & Steen, S. 1999: Sex and genes <strong>in</strong> the flora of <strong>Svalbard</strong> <br />
Implications for conservation biology and climate change. Det Norske Videnskaps<br />
Akademi. I. Matematisk Naturvitenskapelig Klasse, Skrifter, Ny Serie 38:3372<br />
Cooper, E.J., Alsos, I.G., Hagen, D., Smith, F.M., Coulson, S.J. & Hodk<strong>in</strong>son, I.D.<br />
2004: Recruitment <strong>in</strong> the <strong>Arctic</strong>: diversity and importance of the seed bank. Journal<br />
of Vegetation Science 15: 115124<br />
Elvebakk, A. 1989: Biogeographical zones of <strong>Svalbard</strong> and adjacent areas based on<br />
botanical criteria. Institute of Biology and Geology. University of Tromsø, Tromsø<br />
Elven, R. & Elvebakk, A. 1996: Part 1. Vascular <strong>plant</strong>s. A catalogue of <strong>Svalbard</strong><br />
<strong>plant</strong>s, fungi, algae, and cyanobacteria (ed. by A. Elvebakk & P. Prestrud), pp 955.<br />
Norsk Polar<strong>in</strong>stitutt, Oslo<br />
Engelskjøn, T., Lund, L. & Alsos, I.G. 2003: Twenty of the most thermophilous<br />
vascular <strong>plant</strong> species <strong>in</strong> <strong>Svalbard</strong> and their conservation state. Polar Research 22:<br />
317339<br />
Heide, O.M. 2005: Ecotypic variation among European arctic and alp<strong>in</strong>e populations<br />
of Oxyda digyna. Arct Antarct Alp Res 37:233238<br />
Junttila, O. & Robberecht, R. 1993: The <strong>in</strong>fluence of season and phenology on<br />
freez<strong>in</strong>g <strong>to</strong>lerance <strong>in</strong> Silene acaulis L., a subarctic and arctic cushion <strong>plant</strong> of<br />
circum<strong>polar</strong> distribution. Ann Bot 71:423426<br />
Körner, C. 2003: Alp<strong>in</strong>e <strong>plant</strong> Life. Spr<strong>in</strong>ger, Berl<strong>in</strong><br />
Marchand, F.L., Kockelbergh, F., van de Vijver, B., Beyens, L. & Nijs, I. 2006: Are<br />
heat and cold resistance of arctic species affected by successive extreme<br />
temperature events? New Phy<strong>to</strong>l 170:291300<br />
Przybylak, R. 2007: Recent airtemperature changes <strong>in</strong> the <strong>Arctic</strong>. Annals of<br />
Glaciology 46:316324<br />
Robberecht, R. & Junttila, O. 1992: The Freez<strong>in</strong>g Response of an <strong>Arctic</strong> Cushion<br />
Plant, Saxifraga caespi<strong>to</strong>sa L.: Acclimation, Freez<strong>in</strong>g Tolerance and Ice<br />
Nucleation. Ann Bot 70:129135<br />
Rønn<strong>in</strong>g, O.I. 1996: The flora of <strong>Svalbard</strong>. Norwegian Polar Institute, Oslo<br />
Sakai, A. & Larcher, W. 1987: Frost Survival of Plants. Responses and Adaptation <strong>to</strong><br />
Freez<strong>in</strong>g Stress. Ecological Studies 62, Spr<strong>in</strong>ger, Berl<strong>in</strong><br />
Sund<strong>in</strong>g, P. 1960: Høydegrenser for høyere <strong>plant</strong>er på <strong>Svalbard</strong> (Height limits for<br />
vascular <strong>plant</strong>s <strong>in</strong> <strong>Svalbard</strong>). Norsk Polar<strong>in</strong>stitutt Årbok 3259<br />
100