arc-flash analysis of utility power systems - Michigan Technological ...
arc-flash analysis of utility power systems - Michigan Technological ...
arc-flash analysis of utility power systems - Michigan Technological ...
You also want an ePaper? Increase the reach of your titles
YUMPU automatically turns print PDFs into web optimized ePapers that Google loves.
He also provides charts to determine the pressure wave forces at distances from an <strong>arc</strong><br />
based on the fault level [5]. In 1990, the threat <strong>of</strong> an <strong>arc</strong> <strong>flash</strong> was well-established,<br />
and OSHA updated 29 CFR-1910 Subpart S to recognize the need for <strong>arc</strong>-<strong>flash</strong> safety<br />
[4].<br />
Two other papers have been published that look at the energies in <strong>arc</strong>ing faults.<br />
The first published in 1997, Testing Update on Protective Clothing and Equipment for<br />
Electric Arc Exposure, uses empirical test data to determine the incident energy at<br />
distances from a low voltage <strong>arc</strong>ing fault. This was the first paper to address the<br />
directional effect <strong>of</strong> an <strong>arc</strong> in an enclosure. The second paper published in 2000,<br />
Predicting Incident Energy to Better Manage the Electric Arc Hazard on 600-V Power<br />
Distribution Systems, provided equations to determine incident energy based on the<br />
fault level, working distance and the clearing time for <strong>arc</strong>s in air and in an enclosure<br />
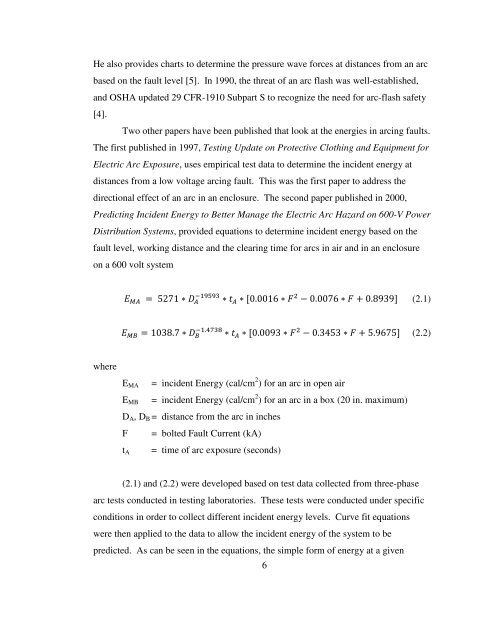
on a 600 volt system<br />
(2.1)<br />
<br />
! " (2.2)<br />
where<br />
E MA<br />
E MB<br />
= incident Energy (cal/cm 2 ) for an <strong>arc</strong> in open air<br />
= incident Energy (cal/cm 2 ) for an <strong>arc</strong> in a box (20 in. maximum)<br />
D A , D B = distance from the <strong>arc</strong> in inches<br />
F = bolted Fault Current (kA)<br />
t A<br />
= time <strong>of</strong> <strong>arc</strong> exposure (seconds)<br />
(2.1) and (2.2) were developed based on test data collected from three-phase<br />
<strong>arc</strong> tests conducted in testing laboratories. These tests were conducted under specific<br />
conditions in order to collect different incident energy levels. Curve fit equations<br />
were then applied to the data to allow the incident energy <strong>of</strong> the system to be<br />
predicted. As can be seen in the equations, the simple form <strong>of</strong> energy at a given<br />
6


