arc-flash analysis of utility power systems - Michigan Technological ...
arc-flash analysis of utility power systems - Michigan Technological ...
arc-flash analysis of utility power systems - Michigan Technological ...
You also want an ePaper? Increase the reach of your titles
YUMPU automatically turns print PDFs into web optimized ePapers that Google loves.
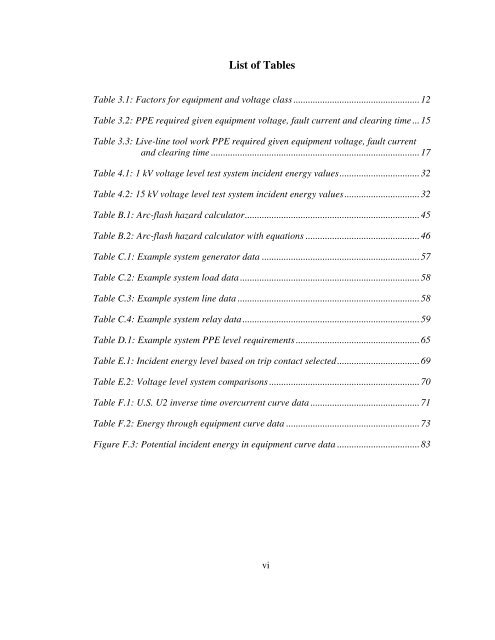
List <strong>of</strong> Tables<br />
Table 3.1: Factors for equipment and voltage class .................................................... 12<br />
Table 3.2: PPE required given equipment voltage, fault current and clearing time ... 15<br />
Table 3.3: Live-line tool work PPE required given equipment voltage, fault current<br />
and clearing time ...................................................................................... 17<br />
Table 4.1: 1 kV voltage level test system incident energy values ................................. 32<br />
Table 4.2: 15 kV voltage level test system incident energy values ............................... 32<br />
Table B.1: Arc-<strong>flash</strong> hazard calculator ........................................................................ 45<br />
Table B.2: Arc-<strong>flash</strong> hazard calculator with equations ............................................... 46<br />
Table C.1: Example system generator data ................................................................. 57<br />
Table C.2: Example system load data .......................................................................... 58<br />
Table C.3: Example system line data ........................................................................... 58<br />
Table C.4: Example system relay data ......................................................................... 59<br />
Table D.1: Example system PPE level requirements ................................................... 65<br />
Table E.1: Incident energy level based on trip contact selected .................................. 69<br />
Table E.2: Voltage level system comparisons .............................................................. 70<br />
Table F.1: U.S. U2 inverse time overcurrent curve data ............................................. 71<br />
Table F.2: Energy through equipment curve data ....................................................... 73<br />
Figure F.3: Potential incident energy in equipment curve data .................................. 83<br />
vi


