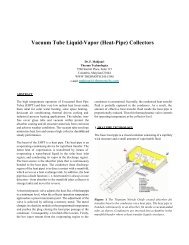
The Relative Cost of Solar Thermal Collector Installation
The Relative Cost of Solar Thermal Collector Installation
The Relative Cost of Solar Thermal Collector Installation

You also want an ePaper? Increase the reach of your titles
YUMPU automatically turns print PDFs into web optimized ePapers that Google loves.
shown in Figure 4 and are thus subject to material markets<br />
fluctuation. But raw materials are not the major cost<br />
contributor <strong>of</strong> the finished product.<br />
<strong>The</strong> microprocessor based solar thermal controllers are<br />
sophisticated yet easy to operate. <strong>The</strong>y display the status <strong>of</strong><br />
solar system on their own LCD or on the screen <strong>of</strong> a<br />
computer. <strong>The</strong> principle is simple; they measure<br />
temperatures at the collector and storage tank. <strong>The</strong><br />
difference is calculated and is used to record energy gain<br />
(BTU meter function) and to operate the circulation pump<br />
(delta T controller function).<br />
Figure 5: <strong>The</strong> labor force in a state-<strong>of</strong>-the art solar<br />
manufacturing facility consists <strong>of</strong> highly skilled pr<strong>of</strong>essional<br />
staffs who monitor the production lines and maintain<br />
computerized machinery and tools.<br />
<strong>The</strong> heavy investment in modern machinery that contributes<br />
significantly to the unit cost <strong>of</strong> the collector is distributed<br />
among the total number <strong>of</strong> units produced. Variable costs<br />
start to dictate the unit cost once the production volume<br />
approaches the optimum facility capacity. At this point, the<br />
cost <strong>of</strong> raw material starts to plays a role in the final<br />
production cost. <strong>The</strong> cost reduction effect <strong>of</strong> increased<br />
production volume is shown in Figure 6.<br />
Unit <strong>Cost</strong><br />
600<br />
500<br />
400<br />
300<br />
200<br />
100<br />
0<br />
0 500 1000 1500 2000 2500<br />
Number <strong>of</strong> Units per Day<br />
Figure 6: <strong>The</strong>rmomax manufacturing facility is the world’s<br />
most modern and Europe’s largest solar vacuum tube plant.<br />
At full capacity it produces 2500 tubes in an eight-hour<br />
shift.<br />
3. CONTROL AND MONITORING SYSTEMS<br />
<strong>The</strong> brain <strong>of</strong> a solar system is its control and monitoring<br />
systems. It accounts for about 2% <strong>of</strong> the total costs <strong>of</strong> the<br />
system as shown in Table 1.<br />
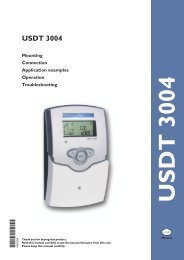
Figure 7. SMT 500 controller records collected solar energy<br />
every 10 minutes in its internal memory while managing the<br />
optimum operation <strong>of</strong> the solar system. This data can be<br />
viewed on units LCD or downloaded to a computer for<br />
further analysis.<br />
To avoid overheating, the controller can be programmed to<br />
stop the circulation pump. <strong>The</strong> pump stops if the collector or<br />
tank temperature reaches the programmable high limit<br />
temperature. To prevent freezing, the controller may be<br />
programmed to activate the solar loop pump and circulate<br />
heat transfer fluid or water in the loop while freeze<br />
conditions exist.<br />
Figure 8. SMT 500 monitors and records the collector and<br />
the tank temperatures <strong>of</strong> the solar system every 10 minutes.<br />
<strong>The</strong>y can be viewed on unit’s LCD or down loaded to a<br />
computer for further analysis.<br />
<strong>The</strong>se sophisticated controllers have a diagnostic screen that<br />
shows potential problems such as sensor breakdown or