P - Technische Universiteit Eindhoven
P - Technische Universiteit Eindhoven
P - Technische Universiteit Eindhoven

Create successful ePaper yourself
Turn your PDF publications into a flip-book with our unique Google optimized e-Paper software.
8. NMR combined with accelerated weathering 100<br />
o<br />
thernardite c = 3.6 M<br />
decahydrate c = 1.6 M<br />
c) Cordova cream limestone<br />
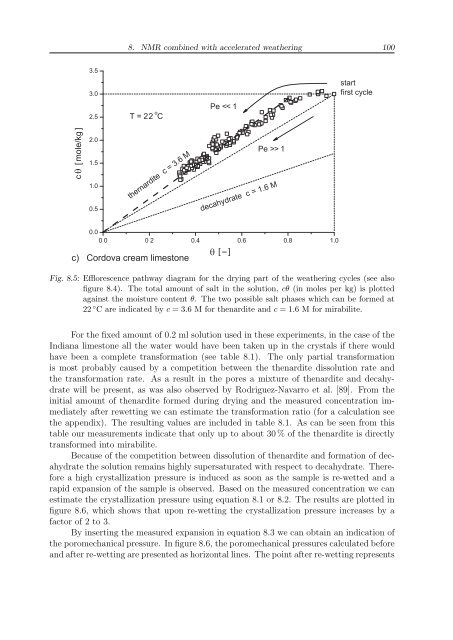
Fig. 8.5: Efflorescence pathway diagram for the drying part of the weathering cycles (see also<br />
figure 8.4). The total amount of salt in the solution, cθ (in moles per kg) is plotted<br />
against the moisture content θ. The two possible salt phases which can be formed at<br />
22 ◦ C are indicated by c = 3.6 M for thenardite and c = 1.6 M for mirabilite.<br />
For the fixed amount of 0.2 ml solution used in these experiments, in the case of the<br />
Indiana limestone all the water would have been taken up in the crystals if there would<br />
have been a complete transformation (see table 8.1). The only partial transformation<br />
is most probably caused by a competition between the thenardite dissolution rate and<br />
the transformation rate. As a result in the pores a mixture of thenardite and decahydrate<br />
will be present, as was also observed by Rodriguez-Navarro et al. [89]. From the<br />
initial amount of thenardite formed during drying and the measured concentration immediately<br />
after rewetting we can estimate the transformation ratio (for a calculation see<br />
the appendix). The resulting values are included in table 8.1. As can be seen from this<br />
table our measurements indicate that only up to about 30 % of the thenardite is directly<br />
transformed into mirabilite.<br />
Because of the competition between dissolution of thenardite and formation of decahydrate<br />
the solution remains highly supersaturated with respect to decahydrate. Therefore<br />
a high crystallization pressure is induced as soon as the sample is re-wetted and a<br />
rapid expansion of the sample is observed. Based on the measured concentration we can<br />
estimate the crystallization pressure using equation 8.1 or 8.2. The results are plotted in<br />
figure 8.6, which shows that upon re-wetting the crystallization pressure increases by a<br />
factor of 2 to 3.<br />
By inserting the measured expansion in equation 8.3 we can obtain an indication of<br />
the poromechanical pressure. In figure 8.6, the poromechanical pressures calculated before<br />
and after re-wetting are presented as horizontal lines. The point after re-wetting represents