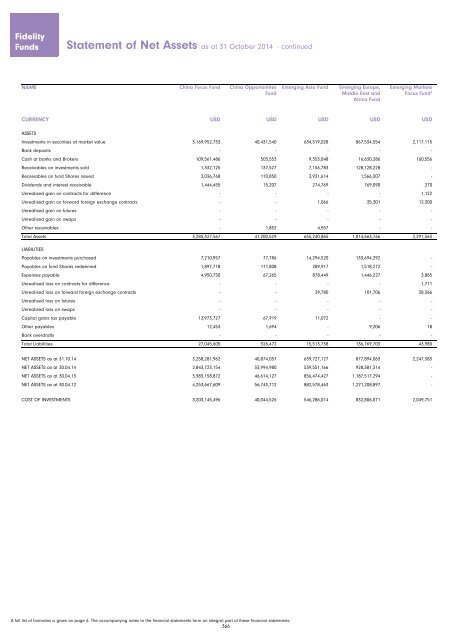
<strong>Fidelity</strong> <strong>Funds</strong> Statement of Net Assets as at 31 October 2014 - continued NAME China Focus Fund China Opportunities Fund Emerging Asia Fund Emerging Europe, Middle East and Africa Fund Emerging Markets Focus Fund 4 CURRENCY USD USD USD USD USD ASSETS Investments in securities at market value 3,169,952,733 40,431,540 634,519,028 867,534,554 2,117,115 Bank deposits - - - - - Cash at banks and Brokers 109,561,486 503,553 9,353,048 16,630,286 160,556 Receivables on investments sold 1,332,125 137,527 7,156,783 128,128,228 - Receivables on fund Shares issued 3,036,768 110,850 3,931,614 1,566,307 - Dividends and interest receivable 1,444,455 15,207 274,769 769,090 270 Unrealised gain on contracts for difference - - - - 1,122 Unrealised gain on forward foreign exchange contracts - - 1,066 35,301 12,300 Unrealised gain on futures - - - - - Unrealised gain on swaps - - - - - Other receivables - 1,852 4,557 - - Total Assets 3,285,327,567 41,200,529 655,240,865 1,014,663,766 2,291,363 LIABILITIES Payables on investments purchased 7,210,957 77,786 14,294,520 133,694,292 - Payables on fund Shares redeemed 1,897,718 111,808 289,917 1,518,272 - Expenses payable 4,950,750 67,265 878,449 1,446,227 3,885 Unrealised loss on contracts for difference - - - - 1,711 Unrealised loss on forward foreign exchange contracts - - 39,780 101,706 38,366 Unrealised loss on futures - - - - - Unrealised loss on swaps - - - - - Capital gains tax payable 12,973,727 67,919 11,072 - - Other payables 12,453 1,694 - 9,206 18 Bank overdrafts - - - - - Total Liabilities 27,045,605 326,472 15,513,738 136,769,703 43,980 NET ASSETS as at 31.10.14 3,258,281,962 40,874,057 639,727,127 877,894,063 2,247,383 NET ASSETS as at 30.04.14 2,843,723,154 33,994,980 539,551,166 928,381,314 - NET ASSETS as at 30.04.13 3,983,158,872 46,614,127 856,474,427 1,187,517,294 - NET ASSETS as at 30.04.12 4,253,667,609 56,743,712 882,578,463 1,221,208,897 - COST OF INVESTMENTS 3,203,145,496 40,044,526 546,286,014 832,806,071 2,049,751 A full list of footnotes is given on page 6. The ac<strong>com</strong>panying notes to the financial statements form an integral part of these financial statements. 366
Emerging Markets Fund Euro Blue Chip Fund EURO STOXX 50 Fund 2,3 European Aggressive Fund European Dividend Fund European Dynamic Growth Fund European Fund 4 European Growth Fund USD EUR EUR EUR EUR EUR EUR EUR 4,111,739,674 864,077,212 225,304,212 347,044,305 472,835,266 435,129,856 233,456,793 7,209,122,837 - - - - - - - - 135,558,688 41,583,263 9,122,605 5,685,001 4,830,474 1,325,844 2,535,411 3,941,073 114,278,533 5,900,652 - 1,035,486 1,691,976 758,124 527,113 12,407,375 7,324,154 1,130,777 72,677 43,713 230,878 100,537 4,722 287,902 865,851 8,998,538 2,625,563 3,170,024 1,143,724 2,696,274 831,019 24,487,652 - - - - - - - - 18,882 15,634 - - 2,266,331 57,677 - 6,259 - 1,111,104 - 6,479 - - - - - - - - - - - - 10,746 - - - 2,651 - - - 4,369,796,528 922,817,180 237,125,057 356,985,008 483,001,300 440,068,312 237,355,058 7,250,253,098 140,896,618 10,862,257 - 354,267 - - 14,154 788,207 737,374 847,590 40,249 414,794 579,266 877,916 161,285 2,963,651 5,741,594 1,259,221 184,141 593,329 749,782 655,150 374,156 11,217,585 - - - - - - - - 60,975 27,447 - - 549,696 44,584 - 2,002 - - 337,333 - - - - 26,639 - - - - - - - - 1,310,191 - - - - - - - 3,008 1,740 1,167 963 - 256 910 23,600 - - - - - - - - 148,749,760 12,998,255 562,890 1,363,353 1,878,744 1,577,906 550,505 15,021,684 4,221,046,768 909,818,925 236,562,167 355,621,655 481,122,556 438,490,406 236,804,553 7,235,231,414 3,524,624,233 843,883,142 256,717,679 422,287,676 250,356,198 561,930,593 236,748,089 7,330,766,050 3,361,283,686 648,413,653 254,006,611 437,692,529 137,310,711 591,931,950 173,516,390 7,077,322,677 3,085,022,634 411,885,995 194,208,134 501,387,032 3,750,277 319,160,637 159,039,096 6,986,155,760 4,017,740,215 858,990,565 124,670,824 371,055,250 443,364,355 432,910,314 220,211,809 7,216,741,091 367
- Page 1 and 2:
Fidelity Funds Société d’invest
- Page 3 and 4:
Fidelity Funds Contents Introductio
- Page 5 and 6:
Fidelity Funds Directors and Superv
- Page 7 and 8:
Fidelity Funds Investment Manager
- Page 9 and 10:
Fidelity Funds America Fund Schedu
- Page 11 and 12:
Fidelity Funds American Diversified
- Page 13 and 14:
Fidelity Funds American Growth Fund
- Page 15 and 16:
Fidelity Funds Asia Pacific Dividen
- Page 17 and 18:
Fidelity Funds Asia Pacific Propert
- Page 19 and 20:
Fidelity Funds Asian Equity Fund 1,
- Page 21 and 22:
Fidelity Funds Asian Smaller Compan
- Page 23 and 24:
Fidelity Funds Asian Special Situat
- Page 25 and 26:
Fidelity Funds China Consumer Fund
- Page 27 and 28:
Fidelity Funds China Focus Fund Sc
- Page 29 and 30:
Fidelity Funds Emerging Asia Fund
- Page 31 and 32:
Fidelity Funds Emerging Markets Foc
- Page 33 and 34:
Fidelity Funds Emerging Markets Fun
- Page 35 and 36:
Fidelity Funds EURO STOXX 50 Fund 2
- Page 37 and 38:
Fidelity Funds European Dividend Fu
- Page 39 and 40:
Fidelity Funds European Dynamic Gro
- Page 41 and 42:
Fidelity Funds European Growth Fund
- Page 43 and 44:
Fidelity Funds European Smaller Com
- Page 45 and 46:
Fidelity Funds European Smaller Com
- Page 47 and 48:
Fidelity Funds France Fund Schedul
- Page 49 and 50:
Fidelity Funds Global Consumer Indu
- Page 51 and 52:
Fidelity Funds Global Dividend Fund
- Page 53 and 54:
Fidelity Funds Global Equity Income
- Page 55 and 56:
Fidelity Funds Global Focus Fund S
- Page 57 and 58:
Fidelity Funds Global Industrials F
- Page 59 and 60:
Fidelity Funds Global Property Fund
- Page 61 and 62:
Fidelity Funds Global Real Asset Se
- Page 63 and 64:
Fidelity Funds Global Telecommunica
- Page 65 and 66:
Fidelity Funds Greater China Fund -
- Page 67 and 68:
Fidelity Funds Greater China Fund I
- Page 69 and 70:
Fidelity Funds India Focus Fund 7
- Page 71 and 72:
Fidelity Funds International Fund
- Page 73 and 74:
Fidelity Funds International Fund -
- Page 75 and 76:
Fidelity Funds International Fund -
- Page 77 and 78:
Fidelity Funds International Fund -
- Page 79 and 80:
Fidelity Funds Japan Advantage Fund
- Page 81 and 82:
Fidelity Funds Japan Fund Schedule
- Page 83 and 84:
Fidelity Funds Japan Smaller Compan
- Page 85 and 86:
Fidelity Funds Latin America Fund
- Page 87 and 88:
Fidelity Funds Nordic Fund Schedul
- Page 89 and 90:
Fidelity Funds Pacific Fund - conti
- Page 91 and 92:
Fidelity Funds South East Asia Fund
- Page 93 and 94:
Fidelity Funds Switzerland Fund Sc
- Page 95 and 96:
Fidelity Funds Thailand Fund Sched
- Page 97 and 98:
Fidelity Funds World Fund Schedule
- Page 99 and 100:
Fidelity Funds Fidelity Patrimoine
- Page 101 and 102:
Fidelity Funds Fidelity Patrimoine
- Page 103 and 104:
Fidelity Funds Fidelity Patrimoine
- Page 105 and 106:
Fidelity Funds Fidelity Patrimoine
- Page 107 and 108:
Fidelity Funds Fidelity Patrimoine
- Page 109 and 110:
Fidelity Funds Fidelity Sélection
- Page 111 and 112:
Fidelity Funds Fidelity Sélection
- Page 113 and 114:
Fidelity Funds Fidelity Sélection
- Page 115 and 116:
Fidelity Funds Fidelity Sélection
- Page 117 and 118:
Fidelity Funds Fidelity Sélection
- Page 119 and 120:
Fidelity Funds FPS Global Growth Fu
- Page 121 and 122:
Fidelity Funds FPS Global Growth Fu
- Page 123 and 124:
Fidelity Funds FPS Global Growth Fu
- Page 125 and 126:
Fidelity Funds FPS Growth Fund 4 S
- Page 127 and 128:
Fidelity Funds FPS Growth Fund 4 -
- Page 129 and 130:
Fidelity Funds FPS Growth Fund 4 -
- Page 131 and 132:
Fidelity Funds FPS Moderate Growth
- Page 133 and 134:
Fidelity Funds FPS Moderate Growth
- Page 135 and 136:
Fidelity Funds FPS Moderate Growth
- Page 137 and 138:
Fidelity Funds Euro Balanced Fund
- Page 139 and 140:
Fidelity Funds Global Multi Asset I
- Page 141 and 142:
Fidelity Funds Global Multi Asset I
- Page 143 and 144:
Fidelity Funds Global Multi Asset I
- Page 145 and 146:
Fidelity Funds Global Multi Asset I
- Page 147 and 148:
Fidelity Funds Global Multi Asset I
- Page 149 and 150:
Fidelity Funds Global Multi Asset I
- Page 151 and 152:
Fidelity Funds Global Multi Asset I
- Page 153 and 154:
Fidelity Funds Growth & Income Fund
- Page 155 and 156:
Fidelity Funds Growth & Income Fund
- Page 157 and 158:
Fidelity Funds Growth & Income Fund
- Page 159 and 160:
Fidelity Funds Growth & Income Fund
- Page 161 and 162:
Fidelity Funds Multi Asset Strategi
- Page 163 and 164:
Fidelity Funds Multi Asset Strategi
- Page 165 and 166:
Fidelity Funds Multi Asset Strategi
- Page 167 and 168:
Fidelity Funds Multi Asset Strategi
- Page 169 and 170:
Fidelity Funds Multi Asset Strategi
- Page 171 and 172:
Fidelity Funds Multi Asset Strategi
- Page 173 and 174:
Fidelity Funds Multi Asset Strategi
- Page 175 and 176:
Fidelity Funds Multi Asset Strategi
- Page 177 and 178:
Fidelity Funds Asian Bond Fund - co
- Page 179 and 180:
Fidelity Funds Asian High Yield Fun
- Page 181 and 182:
Fidelity Funds China RMB Bond Fund
- Page 183 and 184:
Fidelity Funds Core Euro Bond Fund
- Page 185 and 186:
Fidelity Funds Emerging Market Corp
- Page 187 and 188:
Fidelity Funds Emerging Market Debt
- Page 189 and 190:
Fidelity Funds Emerging Market Loca
- Page 191 and 192:
Fidelity Funds Emerging Markets Inf
- Page 193 and 194:
Fidelity Funds Euro Bond Fund - con
- Page 195 and 196:
Fidelity Funds Euro Corporate Bond
- Page 197 and 198:
Fidelity Funds European High Yield
- Page 199 and 200:
Fidelity Funds European High Yield
- Page 201 and 202:
Fidelity Funds Global Corporate Bon
- Page 203 and 204:
Fidelity Funds Global Corporate Bon
- Page 205 and 206:
Fidelity Funds Global High Yield Fu
- Page 207 and 208:
Fidelity Funds Global High Yield Fu
- Page 209 and 210:
Fidelity Funds Global Income Fund -
- Page 211 and 212:
Fidelity Funds Global Income Fund -
- Page 213 and 214:
Fidelity Funds Global Inflation-lin
- Page 215 and 216:
Fidelity Funds Global Strategic Bon
- Page 217 and 218:
Fidelity Funds Global Strategic Bon
- Page 219 and 220:
Fidelity Funds Global Strategic Bon
- Page 221 and 222:
Fidelity Funds Global Strategic Bon
- Page 223 and 224:
Fidelity Funds Global Strategic Bon
- Page 225 and 226:
Fidelity Funds International Bond F
- Page 227 and 228:
Fidelity Funds Sterling Bond Fund
- Page 229 and 230:
Fidelity Funds US Dollar Bond Fund
- Page 231 and 232:
Fidelity Funds US High Yield Fund
- Page 233 and 234:
Fidelity Funds US High Yield Fund -
- Page 235 and 236:
Fidelity Funds Fixed Term 2018 Fund
- Page 237 and 238:
Fidelity Funds Euro Cash Fund Sche
- Page 239 and 240:
Fidelity Funds MoneyBuilder Europe
- Page 241 and 242:
Fidelity Funds MoneyBuilder Europe
- Page 243 and 244:
Fidelity Funds MoneyBuilder Europea
- Page 245 and 246:
Fidelity Funds MoneyBuilder Europea
- Page 247 and 248:
Fidelity Funds MoneyBuilder Global
- Page 249 and 250:
Fidelity Funds MoneyBuilder Global
- Page 251 and 252:
Fidelity Funds MoneyBuilder Global
- Page 253 and 254:
Fidelity Funds MoneyBuilder Global
- Page 255 and 256:
Fidelity Funds Fidelity Target 2020
- Page 257 and 258:
Fidelity Funds Fidelity Target 2020
- Page 259 and 260:
Fidelity Funds Fidelity Target 2020
- Page 261 and 262:
Fidelity Funds Fidelity Target 2020
- Page 263 and 264:
Fidelity Funds Fidelity Target 2020
- Page 265 and 266:
Fidelity Funds Fidelity Target 2020
- Page 267 and 268:
Fidelity Funds Fidelity Target 2015
- Page 269 and 270:
Fidelity Funds Fidelity Target 2015
- Page 271 and 272:
Fidelity Funds Fidelity Target 2015
- Page 273 and 274:
Fidelity Funds Fidelity Target 2020
- Page 275 and 276:
Fidelity Funds Fidelity Target 2020
- Page 277 and 278:
Fidelity Funds Fidelity Target 2020
- Page 279 and 280:
Fidelity Funds Fidelity Target 2020
- Page 281 and 282:
Fidelity Funds Fidelity Target 2025
- Page 283 and 284:
Fidelity Funds Fidelity Target 2025
- Page 285 and 286:
Fidelity Funds Fidelity Target 2025
- Page 287 and 288:
Fidelity Funds Fidelity Target 2025
- Page 289 and 290:
Fidelity Funds Fidelity Target 2025
- Page 291 and 292:
Fidelity Funds Fidelity Target 2030
- Page 293 and 294:
Fidelity Funds Fidelity Target 2030
- Page 295 and 296:
Fidelity Funds Fidelity Target 2030
- Page 297 and 298:
Fidelity Funds Fidelity Target 2030
- Page 299 and 300:
Fidelity Funds Fidelity Target 2035
- Page 301 and 302:
Fidelity Funds Fidelity Target 2035
- Page 303 and 304:
Fidelity Funds Fidelity Target 2035
- Page 305 and 306:
Fidelity Funds Fidelity Target 2040
- Page 307 and 308:
Fidelity Funds Fidelity Target 2040
- Page 309 and 310:
Fidelity Funds Fidelity Target 2040
- Page 311 and 312:
Fidelity Funds Fidelity Target 2045
- Page 313 and 314:
Fidelity Funds Fidelity Target 2045
- Page 315 and 316:
Fidelity Funds Fidelity Target 2045
- Page 317 and 318: Fidelity Funds Fidelity Target 2050
- Page 319 and 320: Fidelity Funds Fidelity Target 2050
- Page 321 and 322: Fidelity Funds FAWF Asian Special S
- Page 323 and 324: Fidelity Funds FAWF Diversified Sto
- Page 325 and 326: Fidelity Funds FAWF Emerging Market
- Page 327 and 328: Fidelity Funds FAWF Equity Income F
- Page 329 and 330: Fidelity Funds FAWF International F
- Page 331 and 332: Fidelity Funds FAWF International F
- Page 333 and 334: Fidelity Funds FAWF International F
- Page 335 and 336: Fidelity Funds FAWF International F
- Page 337 and 338: Fidelity Funds FAWF Pacific Fund 1,
- Page 339 and 340: Fidelity Funds FAWF Limited Term Bo
- Page 341 and 342: Fidelity Funds FAWF Limited Term Bo
- Page 343 and 344: Fidelity Funds FAWF US Dollar Bond
- Page 345 and 346: Fidelity Funds FAWF US High Income
- Page 347 and 348: Fidelity Funds FAWF US High Income
- Page 349 and 350: Fidelity Funds Institutional Americ
- Page 351 and 352: Fidelity Funds Institutional Asia P
- Page 353 and 354: Fidelity Funds Institutional Euro B
- Page 355 and 356: Fidelity Funds Institutional Europe
- Page 357 and 358: Fidelity Funds Institutional Global
- Page 359 and 360: Fidelity Funds Institutional Global
- Page 361 and 362: Fidelity Funds Institutional Japan
- Page 363 and 364: Fidelity Funds Institutional Europe
- Page 365 and 366: This page has been left blank inten
- Page 367: Asia Pacific Dividend Fund Asia Pac
- Page 371 and 372: Global Consumer Industries Fund Glo
- Page 373 and 374: Greater China Fund Greater China Fu
- Page 375 and 376: Malaysia Fund Nordic Fund Pacific F
- Page 377 and 378: Balanced Funds: FPS Global Growth F
- Page 379 and 380: Emerging Market Debt Fund Emerging
- Page 381 and 382: International Bond Fund Sterling Bo
- Page 383 and 384: Reserved Equity Funds: Fidelity Tar
- Page 385 and 386: Reserved Bond Funds: Institutional
- Page 387 and 388: Institutional Global Sector Fund 4,
- Page 389 and 390: Fidelity Funds Statement of Net Ass
- Page 391 and 392: Fidelity Funds Statement of Net Ass
- Page 393 and 394: Fidelity Funds Statement of Net Ass
- Page 395 and 396: Fidelity Funds Statement of Net Ass
- Page 397 and 398: Fidelity Funds Statement of Net Ass
- Page 399 and 400: Fidelity Funds Statement of Net Ass
- Page 401 and 402: Fidelity Funds Statement of Net Ass
- Page 403 and 404: Fidelity Funds Statement of Net Ass
- Page 405 and 406: Fidelity Funds Statement of Net Ass
- Page 407 and 408: 1 Fidelity Funds Notes to the Finan
- Page 409 and 410: Fidelity Funds Notes to the Financi
- Page 411 and 412: Fidelity Funds Notes to the Financi
- Page 413 and 414: Fidelity Funds Notes to the Financi
- Page 415 and 416: Fidelity Funds Notes to the Financi
- Page 417 and 418: Fidelity Funds Notes to the Financi
- Page 419 and 420:
Fidelity Funds Notes to the Financi
- Page 421:
Fidelity, Fidelity Worldwide Invest