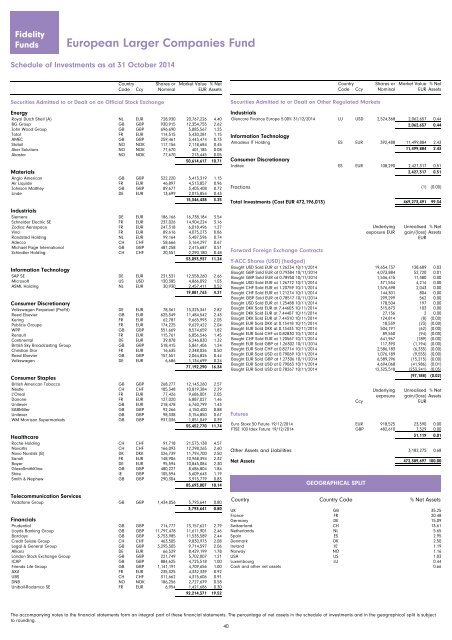
<strong>Fidelity</strong> <strong>Funds</strong> European Larger Companies Fund Schedule of Investments as at 31 October 2014 Country Code Ccy Shares or Nominal Market Value EUR % Net Assets Securities Admitted to or Dealt on an Official Stock Exchange Securities Admitted to or Dealt on an Official Stock Exchange Energy Royal Dutch Shell (A) NL EUR 728,930 20,767,226 4.40 BG Group GB GBP 930,915 12,354,755 2.62 John Wood Group GB GBP 696,690 5,885,567 1.25 Total FR EUR 114,515 5,430,281 1.15 AMEC GB GBP 259,461 3,443,474 0.73 Statoil NO NOK 117,156 2,118,684 0.45 Aker Solutions NO NOK 77,670 401,185 0.08 Akastor NO NOK 77,670 213,445 0.05 50,614,617 10.71 Materials Anglo American GB GBP 322,220 5,413,319 1.15 Air Liquide FR EUR 46,897 4,513,857 0.96 Johnson Matthey GB GBP 89,677 3,403,408 0.72 Linde DE EUR 13,699 2,015,854 0.43 15,346,438 3.25 Industrials Siemens DE EUR 186,166 16,738,184 3.54 Schneider Electric SE FR EUR 237,026 14,904,224 3.16 Zodiac Aerospace FR EUR 247,318 6,018,496 1.27 Vinci FR EUR 89,616 4,075,273 0.86 Randstad Holding NL EUR 99,164 3,487,596 0.74 Adecco CH CHF 58,666 3,164,297 0.67 Michael Page International GB GBP 487,258 2,415,687 0.51 Schindler Holding CH CHF 20,551 2,290,180 0.48 53,093,937 11.24 Information Technology SAP SE DE EUR 231,531 12,558,260 2.66 Microsoft US USD 130,385 4,866,092 1.03 ASML Holding NL EUR 30,930 2,457,411 0.52 19,881,763 4.21 Consumer Discretionary Volkswagen Perpetual (Pref'd) DE EUR 78,361 13,325,341 2.82 Reed Elsevier GB EUR 625,349 11,484,542 2.43 Kering FR EUR 62,787 9,665,993 2.05 Publicis Groupe FR EUR 174,225 9,629,422 2.04 WPP GB GBP 551,669 8,574,659 1.82 Renault FR EUR 115,761 6,856,546 1.45 Continental DE EUR 39,878 6,246,830 1.32 British Sky Broadcasting Group GB GBP 518,415 5,861,406 1.24 Christian Dior FR EUR 16,635 2,348,026 0.50 Reed Elsevier GB GBP 157,551 2,064,826 0.44 Volkswagen DE EUR 6,686 1,134,699 0.24 77,192,290 16.34 Consumer Staples British American Tobacco GB GBP 268,277 12,143,260 2.57 Nestle CH CHF 185,348 10,819,384 2.29 L'Oreal FR EUR 77,426 9,686,001 2.05 Danone FR EUR 127,020 6,887,027 1.46 Unilever GB EUR 218,478 6,760,799 1.43 SABMiller GB GBP 92,266 4,150,400 0.88 Unilever GB GBP 98,338 3,154,850 0.67 WM Morrison Supermarkets GB GBP 937,036 1,851,049 0.39 55,452,770 11.74 Healthcare Roche Holding CH CHF 91,718 21,575,138 4.57 Novartis CH CHF 166,093 12,298,265 2.60 Novo Nordisk (B) DK DKK 326,739 11,794,700 2.50 Sanofi FR EUR 148,906 10,968,394 2.32 Bayer DE EUR 95,594 10,845,084 2.30 GlaxoSmithKline GB GBP 480,227 8,686,804 1.84 Shire IE GBP 105,594 5,609,643 1.19 Smith & Nephew GB GBP 290,304 3,915,779 0.83 85,693,807 18.14 Tele<strong>com</strong>munication Services Vodafone Group GB GBP 1,434,056 3,793,641 0.80 3,793,641 0.80 Financials Prudential GB GBP 714,777 13,157,621 2.79 Lloyds Banking Group GB GBP 11,797,478 11,611,901 2.46 Barclays GB GBP 3,753,985 11,535,589 2.44 Credit Suisse Group CH CHF 463,505 9,830,973 2.08 Legal & General Group GB GBP 3,295,505 9,714,597 2.06 Allianz DE EUR 66,529 8,429,199 1.78 London Stock Exchange Group GB GBP 221,749 5,702,007 1.21 ICAP GB GBP 884,625 4,725,518 1.00 Friends Life Group GB GBP 1,141,191 4,709,656 1.00 AXA FR EUR 235,325 4,332,339 0.92 UBS CH CHF 311,662 4,315,606 0.91 DNB NO NOK 186,256 2,727,679 0.58 Unibail-Rodamco SE FR EUR 6,954 1,421,686 0.30 92,214,371 19.52 Country Code Ccy Shares or Nominal Market Value % Net EUR Assets Securities Admitted to or Dealt on Other Regulated Markets Securities Admitted to or Dealt on Other Regulated Markets Industrials Glencore Finance Europe 5.00% 31/12/2014 LU USD 2,524,368 2,062,657 0.44 2,062,657 0.44 Information Technology Amadeus IT Holding ES EUR 392,488 11,499,884 2.43 11,499,884 2.43 Consumer Discretionary Inditex ES EUR 108,290 2,427,317 0.51 2,427,317 0.51 Fractions (1) (0.00) Total Investments (Cost EUR 472,196,013) 469,273,491 99.34 1 469 273 491 00 Underlying exposure EUR Unrealised % Net gain/(loss) Assets EUR Forward Foreign Exchange Contracts Forward Foreign Exchange Contracts Y-ACC Shares (USD) (hedged) Bought USD Sold EUR at 1.26234 10/11/2014 19,654,737 138,689 0.03 Bought GBP Sold EUR at 0.79384 10/11/2014 4,073,884 52,720 0.01 Bought GBP Sold EUR at 0.78950 10/11/2014 1,536,415 11,380 0.00 Bought USD Sold EUR at 1.26772 10/11/2014 371,534 4,214 0.00 Bought CHF Sold EUR at 1.20759 10/11/2014 1,576,698 2,043 0.00 Bought CHF Sold EUR at 1.21274 10/11/2014 144,301 804 0.00 Bought GBP Sold EUR at 0.78517 10/11/2014 299,299 562 0.00 Bought USD Sold EUR at 1.25488 10/11/2014 178,504 197 0.00 Bought DKK Sold EUR at 7.44603 10/11/2014 315,873 103 0.00 Bought DKK Sold EUR at 7.44407 10/11/2014 27,136 2 0.00 Bought DKK Sold EUR at 7.44310 10/11/2014 124,814 (8) (0.00) Bought EUR Sold DKK at 0.13418 10/11/2014 18,539 (23) (0.00) Bought EUR Sold DKK at 0.13433 10/11/2014 504,191 (62) (0.00) Bought EUR Sold CHF at 0.82830 10/11/2014 89,550 (94) (0.00) Bought CHF Sold EUR at 1.20567 10/11/2014 641,967 (189) (0.00) Bought EUR Sold GBP at 1.26302 10/11/2014 117,393 (1,194) (0.00) Bought EUR Sold CHF at 0.82714 10/11/2014 2,586,183 (6,335) (0.00) Bought EUR Sold USD at 0.79069 10/11/2014 1,076,189 (9,555) (0.00) Bought EUR Sold GBP at 1.27306 10/11/2014 6,589,296 (15,215) (0.00) Bought EUR Sold USD at 0.79063 10/11/2014 4,694,068 (41,986) (0.01) Bought EUR Sold USD at 0.78267 10/11/2014 12,325,518 (233,241) (0.05) (97,188) (0.02) Ccy Underlying exposure Unrealised % Net gain/(loss) Assets EUR Futures Futures Euro Stoxx 50 Future 19/12/2014 EUR 918,525 23,590 0.00 FTSE 100 Idex Future 19/12/2014 GBP 482,610 7,529 0.00 31,119 0.01 Other Assets and Liabilities 3,182,275 0.68 Net Assets 472,389,697 100.00 472 389 697 00 GEOGRAPHICAL SPLIT Country Country Code % Net Assets UK GB 35.25 France FR 20.48 Germany DE 15.09 Switzerland CH 13.61 Netherlands NL 5.65 Spain ES 2.95 Denmark DK 2.50 Ireland IE 1.19 Norway NO 1.16 USA US 1.03 Luxembourg LU 0.44 Cash and other net assets 0.66 The ac<strong>com</strong>panying notes to the financial statements form an integral part of these financial statements. The percentage of net assets in the schedule of investments and in the geographical split is subject to rounding. 40
<strong>Fidelity</strong> <strong>Funds</strong> European Smaller Companies Fund Schedule of Investments as at 31 October 2014 Country Code Ccy Shares or Nominal Market Value EUR % Net Assets Securities Admitted to or Dealt on an Official Stock Exchange Securities Admitted to or Dealt on an Official Stock Exchange Energy John Wood Group GB GBP 733,182 6,193,846 0.65 Amerisur Resources GB GBP 6,265,382 4,357,474 0.46 Premier Oil GB GBP 940,674 3,095,860 0.32 Faroe Petroleum GB GBP 2,544,477 2,979,171 0.31 Aker Solutions NO NOK 568,487 2,936,383 0.31 Ichor Coal DE EUR 468,601 2,202,424 0.23 AMEC GB GBP 161,725 2,146,354 0.22 Hunting GB GBP 218,861 2,054,199 0.21 Parkmead Group GB GBP 911,008 2,051,908 0.21 Lekoil NG GBP 3,020,012 1,869,137 0.20 Hargreaves Services GB GBP 202,154 1,689,719 0.18 Savannah Petroleum GB GBP 1,435,715 723,696 0.08 Petroleum Geo-Services NO NOK 158,840 628,010 0.07 32,928,181 3.44 Utilities Fulcrum Utility Services GB GBP 13,439,715 1,393,491 0.15 Drax Group GB GBP 172,208 1,306,460 0.14 Modern Water GB GBP 2,040,070 670,368 0.07 Helius Energy GB GBP 8,910,311 397,971 0.04 3,768,290 0.39 Materials Mountain Province Diamonds CA CAD 2,123,912 7,889,425 0.83 Platinum Group Metals CA CAD 7,397,591 4,710,666 0.49 Firestone Diamonds GB GBP 10,798,702 4,650,891 0.49 LANXESS DE EUR 98,396 4,081,461 0.43 Petra Diamonds GB GBP 1,644,629 3,483,909 0.36 Huhtamaki FI EUR 163,858 3,313,209 0.35 Clariant CH CHF 174,765 2,427,227 0.25 Synthomer GB GBP 921,522 2,390,749 0.25 Sika CH CHF 805 2,289,450 0.24 RM2 International GB GBP 2,720,128 2,204,215 0.23 Kenmare Resources IE GBP 18,691,503 1,638,671 0.17 Accsys Technologies GB GBP 1,906,010 1,620,515 0.17 Almonty Industries CA CAD 3,028,763 1,478,645 0.15 Plant Impact PLC GB GBP 2,894,217 1,163,409 0.12 Kennady Diamonds CA CAD 169,076 716,570 0.07 Sylvania Platinum ZA GBP 6,457,255 618,016 0.06 Polar Star Mining CA CAD 9,043,830 159,971 0.02 44,836,999 4.69 Industrials Regus LU GBP 5,459,447 13,745,690 1.44 Teleperformance FR EUR 225,298 11,323,453 1.18 Brammer GB GBP 2,456,469 10,164,407 1.06 Lavendon Group GB GBP 3,590,680 8,385,299 0.88 Regenersis GB GBP 2,960,188 8,055,623 0.84 SThree GB GBP 1,747,588 6,913,400 0.72 Dialight GB GBP 583,755 6,406,487 0.67 CENTROTEC Sustainable DE EUR 469,645 6,063,111 0.63 Blue Label Tele<strong>com</strong>s ZA ZAR 8,055,391 5,674,616 0.59 Brenntag DE EUR 145,546 5,618,065 0.59 Cpl Resources IE EUR 844,447 5,573,350 0.58 Amadeus Fire DE EUR 94,629 5,352,203 0.56 Deutz DE EUR 1,370,978 4,916,328 0.51 Cewe Stiftung & Co DE EUR 77,560 4,069,598 0.43 Porr AT EUR 78,022 3,589,001 0.38 HellermannTyton Group GB GBP 923,032 3,580,809 0.37 BBA Aviation GB GBP 725,180 3,273,194 0.34 SFS Group CH CHF 58,013 3,242,100 0.34 DCC IE GBP 70,429 3,140,257 0.33 Arcadis NL EUR 124,863 3,062,265 0.32 Travis Perkins GB GBP 137,197 2,892,314 0.30 Wienerberger AT EUR 281,517 2,716,639 0.28 Bossard Holding (A) CH CHF 32,628 2,632,355 0.28 Mersen FR EUR 129,632 2,488,941 0.26 LISI FR EUR 108,788 2,176,846 0.23 GEA Group DE EUR 58,274 2,138,364 0.22 Muehlbauer Holding DE EUR 116,491 1,968,116 0.21 Mears Group GB GBP 337,523 1,903,779 0.20 USG People NL EUR 182,729 1,460,005 0.15 Flybe Group GB GBP 872,876 1,345,025 0.14 Latchways GB GBP 141,193 1,333,324 0.14 Meyer Burger Technology CH CHF 165,411 1,109,570 0.12 Exova Group GB GBP 511,540 1,108,103 0.12 Cramo FI EUR 93,848 1,089,575 0.11 SKIL Ports & Logistics GB GBP 929,458 575,258 0.06 149,087,470 15.59 Information Technology IBS Group Holding RU EUR 744,836 18,993,320 1.99 Innovation Group GB GBP 44,120,274 15,201,721 1.59 Alten FR EUR 305,598 10,426,996 1.09 Playtech GB GBP 1,156,996 10,423,827 1.09 Moneysupermarket.<strong>com</strong> Group GB GBP 3,727,152 9,512,570 0.99 United Internet DE EUR 287,432 8,969,319 0.94 GameLoft FR EUR 2,163,318 8,869,602 0.93 Just Eat GB GBP 2,064,448 8,103,658 0.85 Matomy Media Group IL GBP 2,569,134 7,622,555 0.80 Rocket Internet AG DE EUR 156,574 6,654,390 0.70 UBISOFT Entertainment FR EUR 424,883 6,131,062 0.64 Temenos Group CH CHF 219,382 6,102,869 0.64 Country Shares or Market Value % Net Code Ccy Nominal EUR Assets Sopra Group FR EUR 90,859 5,434,306 0.57 Accesso Technology Group GB GBP 722,541 5,278,721 0.55 Tungsten GB GBP 1,274,887 4,860,383 0.51 Tracsis GB GBP 996,695 4,318,101 0.45 FDM Group Holdings GB GBP 951,331 4,100,319 0.43 Vizrt IL NOK 1,217,383 4,043,375 0.42 Sepura GB GBP 2,301,875 4,024,326 0.42 IAR Systems Group SE SEK 427,341 3,402,505 0.36 ASM International NL EUR 105,025 3,352,398 0.35 SDL GB GBP 666,817 3,348,438 0.35 Electronic Arts US USD 96,864 3,173,804 0.33 Altran Technologies FR EUR 400,323 3,136,531 0.33 InVision DE EUR 73,673 3,024,291 0.32 Dialog Semiconductor DE EUR 107,519 2,948,171 0.31 Softing DE EUR 191,201 2,791,528 0.29 Microsaic Systems GB GBP 4,381,570 2,669,894 0.28 SNP Schneider-Neureither & Partner DE EUR 196,343 2,464,100 0.26 Ubisense Group GB GBP 1,220,940 2,360,465 0.25 Microgen GB GBP 1,459,966 2,282,284 0.24 Vizrt IL EUR 649,756 2,072,722 0.22 IBEX Global Solutions US GBP 1,371,786 2,065,661 0.22 CANCOM SE DE EUR 59,156 1,927,586 0.20 ams AT CHF 66,987 1,910,690 0.20 Bond International Software GB GBP 1,298,183 1,540,670 0.16 LPKF Laser & Electronics DE EUR 148,699 1,514,499 0.16 SolarWinds US USD 37,228 1,411,067 0.15 Brady GB GBP 1,509,224 1,405,942 0.15 Nanoco Group GB GBP 684,651 1,002,565 0.10 Zoopla Property Group GB GBP 322,307 852,217 0.09 PhotonStar LED Group GB GBP 9,954,844 412,866 0.04 Luxoft Holding CH USD 4,051 129,177 0.01 200,271,491 20.94 Consumer Discretionary Card Factory GB GBP 4,204,803 12,700,907 1.33 Paddy Power IE EUR 168,972 9,834,149 1.03 Leoni DE EUR 206,366 9,420,629 0.99 Ted Baker GB GBP 358,381 8,895,186 0.93 boohoo.<strong>com</strong> GB GBP 14,646,391 8,550,914 0.89 Schibsted NO NOK 196,252 8,278,854 0.87 GFK SE DE EUR 244,791 8,078,088 0.84 Mothercare GB GBP 3,461,713 7,730,720 0.81 Byggmax AB SE SEK 1,417,675 7,009,789 0.73 4imprint Group GB GBP 682,856 6,860,132 0.72 Hornbach Baumarkt DE EUR 239,196 6,783,605 0.71 Rightmove GB GBP 237,832 6,403,873 0.67 ElringKlinger DE EUR 233,110 5,677,389 0.59 Rezidor Hotel Group BE SEK 1,473,040 5,152,551 0.54 Poundland Group GB GBP 1,254,718 5,043,681 0.53 SAF-Holland DE EUR 501,395 4,999,911 0.52 Alpargatas (Pref'd) BR BRL 1,770,120 4,984,095 0.52 Stanley Gibbons Group GB GBP 1,308,629 4,417,058 0.46 Surteco SE DE EUR 180,663 4,400,951 0.46 Dalata Hotel Group IE EUR 1,266,022 3,671,464 0.38 Amer Sports FI EUR 239,675 3,659,837 0.38 Cineworld Group GB GBP 813,953 3,479,645 0.36 Taylor Wimpey GB GBP 1,941,469 2,933,411 0.31 Ocado Group GB GBP 823,112 2,612,315 0.27 Brunello Cucinelli IT EUR 156,883 2,532,086 0.26 Headlam Group GB GBP 500,523 2,503,807 0.26 Pandora DK DKK 31,365 2,106,847 0.22 Ladbrokes GB GBP 1,393,002 2,099,387 0.22 Games Workshop Group GB GBP 253,727 1,776,773 0.19 Lotto24 DE EUR 595,846 1,704,119 0.18 Chime Communications GB GBP 397,782 1,407,367 0.15 CTS Eventim DE EUR 66,609 1,401,453 0.15 ASOS GB GBP 38,335 1,299,302 0.14 AO World GB GBP 562,368 1,190,578 0.12 SHW DE EUR 32,600 1,184,032 0.12 Koytas Tekstil Sanayi VE TIC* TR TRY 78,526 0 0.00 170,784,905 17.86 Consumer Staples Booker Group GB GBP 6,173,750 11,053,442 1.16 Raisio FI EUR 1,099,755 4,377,025 0.46 AAK SE SEK 54,069 2,336,666 0.24 McColl's Retail Group GB GBP 450,400 1,062,594 0.11 Hilton Food Group GB GBP 178,850 855,876 0.09 19,685,603 2.06 Healthcare Sartorius Stedim Biotech (H) FR EUR 66,957 9,742,225 1.02 Synergy Health GB GBP 402,563 9,596,242 1.00 Eurofins Scientific SE LU EUR 38,203 7,703,675 0.81 CompuGroup Medical DE EUR 368,356 6,740,923 0.70 Al Noor Hospitals Group AE GBP 480,140 6,243,565 0.65 Nexus DE EUR 410,404 5,008,980 0.52 Craneware GB GBP 628,964 3,993,098 0.42 AAP Implantate DE EUR 1,544,024 3,756,612 0.39 Electrical Geodesics* US GBP 2,200,909 2,906,921 0.30 Lombard Medical GB USD 498,520 2,716,418 0.28 Sorin IT EUR 1,294,230 2,308,906 0.24 UDG Healthcare IE GBP 525,490 2,207,573 0.23 Audika Groupe FR EUR 184,112 2,161,478 0.23 Sinclair IS Pharma GB GBP 3,825,181 1,397,296 0.15 NMC Health AE GBP 181,826 1,148,556 0.12 Verona Pharma GB GBP 64,495,617 864,192 0.09 * Security with price determined by the Directors. The ac<strong>com</strong>panying notes to the financial statements form an integral part of these financial statements. The percentage of net assets in the schedule of investments and in the geographical split is subject to rounding. 41
- Page 1 and 2: Fidelity Funds Société d’invest
- Page 3 and 4: Fidelity Funds Contents Introductio
- Page 5 and 6: Fidelity Funds Directors and Superv
- Page 7 and 8: Fidelity Funds Investment Manager
- Page 9 and 10: Fidelity Funds America Fund Schedu
- Page 11 and 12: Fidelity Funds American Diversified
- Page 13 and 14: Fidelity Funds American Growth Fund
- Page 15 and 16: Fidelity Funds Asia Pacific Dividen
- Page 17 and 18: Fidelity Funds Asia Pacific Propert
- Page 19 and 20: Fidelity Funds Asian Equity Fund 1,
- Page 21 and 22: Fidelity Funds Asian Smaller Compan
- Page 23 and 24: Fidelity Funds Asian Special Situat
- Page 25 and 26: Fidelity Funds China Consumer Fund
- Page 27 and 28: Fidelity Funds China Focus Fund Sc
- Page 29 and 30: Fidelity Funds Emerging Asia Fund
- Page 31 and 32: Fidelity Funds Emerging Markets Foc
- Page 33 and 34: Fidelity Funds Emerging Markets Fun
- Page 35 and 36: Fidelity Funds EURO STOXX 50 Fund 2
- Page 37 and 38: Fidelity Funds European Dividend Fu
- Page 39 and 40: Fidelity Funds European Dynamic Gro
- Page 41: Fidelity Funds European Growth Fund
- Page 45 and 46: Fidelity Funds European Smaller Com
- Page 47 and 48: Fidelity Funds France Fund Schedul
- Page 49 and 50: Fidelity Funds Global Consumer Indu
- Page 51 and 52: Fidelity Funds Global Dividend Fund
- Page 53 and 54: Fidelity Funds Global Equity Income
- Page 55 and 56: Fidelity Funds Global Focus Fund S
- Page 57 and 58: Fidelity Funds Global Industrials F
- Page 59 and 60: Fidelity Funds Global Property Fund
- Page 61 and 62: Fidelity Funds Global Real Asset Se
- Page 63 and 64: Fidelity Funds Global Telecommunica
- Page 65 and 66: Fidelity Funds Greater China Fund -
- Page 67 and 68: Fidelity Funds Greater China Fund I
- Page 69 and 70: Fidelity Funds India Focus Fund 7
- Page 71 and 72: Fidelity Funds International Fund
- Page 73 and 74: Fidelity Funds International Fund -
- Page 75 and 76: Fidelity Funds International Fund -
- Page 77 and 78: Fidelity Funds International Fund -
- Page 79 and 80: Fidelity Funds Japan Advantage Fund
- Page 81 and 82: Fidelity Funds Japan Fund Schedule
- Page 83 and 84: Fidelity Funds Japan Smaller Compan
- Page 85 and 86: Fidelity Funds Latin America Fund
- Page 87 and 88: Fidelity Funds Nordic Fund Schedul
- Page 89 and 90: Fidelity Funds Pacific Fund - conti
- Page 91 and 92: Fidelity Funds South East Asia Fund
- Page 93 and 94:
Fidelity Funds Switzerland Fund Sc
- Page 95 and 96:
Fidelity Funds Thailand Fund Sched
- Page 97 and 98:
Fidelity Funds World Fund Schedule
- Page 99 and 100:
Fidelity Funds Fidelity Patrimoine
- Page 101 and 102:
Fidelity Funds Fidelity Patrimoine
- Page 103 and 104:
Fidelity Funds Fidelity Patrimoine
- Page 105 and 106:
Fidelity Funds Fidelity Patrimoine
- Page 107 and 108:
Fidelity Funds Fidelity Patrimoine
- Page 109 and 110:
Fidelity Funds Fidelity Sélection
- Page 111 and 112:
Fidelity Funds Fidelity Sélection
- Page 113 and 114:
Fidelity Funds Fidelity Sélection
- Page 115 and 116:
Fidelity Funds Fidelity Sélection
- Page 117 and 118:
Fidelity Funds Fidelity Sélection
- Page 119 and 120:
Fidelity Funds FPS Global Growth Fu
- Page 121 and 122:
Fidelity Funds FPS Global Growth Fu
- Page 123 and 124:
Fidelity Funds FPS Global Growth Fu
- Page 125 and 126:
Fidelity Funds FPS Growth Fund 4 S
- Page 127 and 128:
Fidelity Funds FPS Growth Fund 4 -
- Page 129 and 130:
Fidelity Funds FPS Growth Fund 4 -
- Page 131 and 132:
Fidelity Funds FPS Moderate Growth
- Page 133 and 134:
Fidelity Funds FPS Moderate Growth
- Page 135 and 136:
Fidelity Funds FPS Moderate Growth
- Page 137 and 138:
Fidelity Funds Euro Balanced Fund
- Page 139 and 140:
Fidelity Funds Global Multi Asset I
- Page 141 and 142:
Fidelity Funds Global Multi Asset I
- Page 143 and 144:
Fidelity Funds Global Multi Asset I
- Page 145 and 146:
Fidelity Funds Global Multi Asset I
- Page 147 and 148:
Fidelity Funds Global Multi Asset I
- Page 149 and 150:
Fidelity Funds Global Multi Asset I
- Page 151 and 152:
Fidelity Funds Global Multi Asset I
- Page 153 and 154:
Fidelity Funds Growth & Income Fund
- Page 155 and 156:
Fidelity Funds Growth & Income Fund
- Page 157 and 158:
Fidelity Funds Growth & Income Fund
- Page 159 and 160:
Fidelity Funds Growth & Income Fund
- Page 161 and 162:
Fidelity Funds Multi Asset Strategi
- Page 163 and 164:
Fidelity Funds Multi Asset Strategi
- Page 165 and 166:
Fidelity Funds Multi Asset Strategi
- Page 167 and 168:
Fidelity Funds Multi Asset Strategi
- Page 169 and 170:
Fidelity Funds Multi Asset Strategi
- Page 171 and 172:
Fidelity Funds Multi Asset Strategi
- Page 173 and 174:
Fidelity Funds Multi Asset Strategi
- Page 175 and 176:
Fidelity Funds Multi Asset Strategi
- Page 177 and 178:
Fidelity Funds Asian Bond Fund - co
- Page 179 and 180:
Fidelity Funds Asian High Yield Fun
- Page 181 and 182:
Fidelity Funds China RMB Bond Fund
- Page 183 and 184:
Fidelity Funds Core Euro Bond Fund
- Page 185 and 186:
Fidelity Funds Emerging Market Corp
- Page 187 and 188:
Fidelity Funds Emerging Market Debt
- Page 189 and 190:
Fidelity Funds Emerging Market Loca
- Page 191 and 192:
Fidelity Funds Emerging Markets Inf
- Page 193 and 194:
Fidelity Funds Euro Bond Fund - con
- Page 195 and 196:
Fidelity Funds Euro Corporate Bond
- Page 197 and 198:
Fidelity Funds European High Yield
- Page 199 and 200:
Fidelity Funds European High Yield
- Page 201 and 202:
Fidelity Funds Global Corporate Bon
- Page 203 and 204:
Fidelity Funds Global Corporate Bon
- Page 205 and 206:
Fidelity Funds Global High Yield Fu
- Page 207 and 208:
Fidelity Funds Global High Yield Fu
- Page 209 and 210:
Fidelity Funds Global Income Fund -
- Page 211 and 212:
Fidelity Funds Global Income Fund -
- Page 213 and 214:
Fidelity Funds Global Inflation-lin
- Page 215 and 216:
Fidelity Funds Global Strategic Bon
- Page 217 and 218:
Fidelity Funds Global Strategic Bon
- Page 219 and 220:
Fidelity Funds Global Strategic Bon
- Page 221 and 222:
Fidelity Funds Global Strategic Bon
- Page 223 and 224:
Fidelity Funds Global Strategic Bon
- Page 225 and 226:
Fidelity Funds International Bond F
- Page 227 and 228:
Fidelity Funds Sterling Bond Fund
- Page 229 and 230:
Fidelity Funds US Dollar Bond Fund
- Page 231 and 232:
Fidelity Funds US High Yield Fund
- Page 233 and 234:
Fidelity Funds US High Yield Fund -
- Page 235 and 236:
Fidelity Funds Fixed Term 2018 Fund
- Page 237 and 238:
Fidelity Funds Euro Cash Fund Sche
- Page 239 and 240:
Fidelity Funds MoneyBuilder Europe
- Page 241 and 242:
Fidelity Funds MoneyBuilder Europe
- Page 243 and 244:
Fidelity Funds MoneyBuilder Europea
- Page 245 and 246:
Fidelity Funds MoneyBuilder Europea
- Page 247 and 248:
Fidelity Funds MoneyBuilder Global
- Page 249 and 250:
Fidelity Funds MoneyBuilder Global
- Page 251 and 252:
Fidelity Funds MoneyBuilder Global
- Page 253 and 254:
Fidelity Funds MoneyBuilder Global
- Page 255 and 256:
Fidelity Funds Fidelity Target 2020
- Page 257 and 258:
Fidelity Funds Fidelity Target 2020
- Page 259 and 260:
Fidelity Funds Fidelity Target 2020
- Page 261 and 262:
Fidelity Funds Fidelity Target 2020
- Page 263 and 264:
Fidelity Funds Fidelity Target 2020
- Page 265 and 266:
Fidelity Funds Fidelity Target 2020
- Page 267 and 268:
Fidelity Funds Fidelity Target 2015
- Page 269 and 270:
Fidelity Funds Fidelity Target 2015
- Page 271 and 272:
Fidelity Funds Fidelity Target 2015
- Page 273 and 274:
Fidelity Funds Fidelity Target 2020
- Page 275 and 276:
Fidelity Funds Fidelity Target 2020
- Page 277 and 278:
Fidelity Funds Fidelity Target 2020
- Page 279 and 280:
Fidelity Funds Fidelity Target 2020
- Page 281 and 282:
Fidelity Funds Fidelity Target 2025
- Page 283 and 284:
Fidelity Funds Fidelity Target 2025
- Page 285 and 286:
Fidelity Funds Fidelity Target 2025
- Page 287 and 288:
Fidelity Funds Fidelity Target 2025
- Page 289 and 290:
Fidelity Funds Fidelity Target 2025
- Page 291 and 292:
Fidelity Funds Fidelity Target 2030
- Page 293 and 294:
Fidelity Funds Fidelity Target 2030
- Page 295 and 296:
Fidelity Funds Fidelity Target 2030
- Page 297 and 298:
Fidelity Funds Fidelity Target 2030
- Page 299 and 300:
Fidelity Funds Fidelity Target 2035
- Page 301 and 302:
Fidelity Funds Fidelity Target 2035
- Page 303 and 304:
Fidelity Funds Fidelity Target 2035
- Page 305 and 306:
Fidelity Funds Fidelity Target 2040
- Page 307 and 308:
Fidelity Funds Fidelity Target 2040
- Page 309 and 310:
Fidelity Funds Fidelity Target 2040
- Page 311 and 312:
Fidelity Funds Fidelity Target 2045
- Page 313 and 314:
Fidelity Funds Fidelity Target 2045
- Page 315 and 316:
Fidelity Funds Fidelity Target 2045
- Page 317 and 318:
Fidelity Funds Fidelity Target 2050
- Page 319 and 320:
Fidelity Funds Fidelity Target 2050
- Page 321 and 322:
Fidelity Funds FAWF Asian Special S
- Page 323 and 324:
Fidelity Funds FAWF Diversified Sto
- Page 325 and 326:
Fidelity Funds FAWF Emerging Market
- Page 327 and 328:
Fidelity Funds FAWF Equity Income F
- Page 329 and 330:
Fidelity Funds FAWF International F
- Page 331 and 332:
Fidelity Funds FAWF International F
- Page 333 and 334:
Fidelity Funds FAWF International F
- Page 335 and 336:
Fidelity Funds FAWF International F
- Page 337 and 338:
Fidelity Funds FAWF Pacific Fund 1,
- Page 339 and 340:
Fidelity Funds FAWF Limited Term Bo
- Page 341 and 342:
Fidelity Funds FAWF Limited Term Bo
- Page 343 and 344:
Fidelity Funds FAWF US Dollar Bond
- Page 345 and 346:
Fidelity Funds FAWF US High Income
- Page 347 and 348:
Fidelity Funds FAWF US High Income
- Page 349 and 350:
Fidelity Funds Institutional Americ
- Page 351 and 352:
Fidelity Funds Institutional Asia P
- Page 353 and 354:
Fidelity Funds Institutional Euro B
- Page 355 and 356:
Fidelity Funds Institutional Europe
- Page 357 and 358:
Fidelity Funds Institutional Global
- Page 359 and 360:
Fidelity Funds Institutional Global
- Page 361 and 362:
Fidelity Funds Institutional Japan
- Page 363 and 364:
Fidelity Funds Institutional Europe
- Page 365 and 366:
This page has been left blank inten
- Page 367 and 368:
Asia Pacific Dividend Fund Asia Pac
- Page 369 and 370:
Emerging Markets Fund Euro Blue Chi
- Page 371 and 372:
Global Consumer Industries Fund Glo
- Page 373 and 374:
Greater China Fund Greater China Fu
- Page 375 and 376:
Malaysia Fund Nordic Fund Pacific F
- Page 377 and 378:
Balanced Funds: FPS Global Growth F
- Page 379 and 380:
Emerging Market Debt Fund Emerging
- Page 381 and 382:
International Bond Fund Sterling Bo
- Page 383 and 384:
Reserved Equity Funds: Fidelity Tar
- Page 385 and 386:
Reserved Bond Funds: Institutional
- Page 387 and 388:
Institutional Global Sector Fund 4,
- Page 389 and 390:
Fidelity Funds Statement of Net Ass
- Page 391 and 392:
Fidelity Funds Statement of Net Ass
- Page 393 and 394:
Fidelity Funds Statement of Net Ass
- Page 395 and 396:
Fidelity Funds Statement of Net Ass
- Page 397 and 398:
Fidelity Funds Statement of Net Ass
- Page 399 and 400:
Fidelity Funds Statement of Net Ass
- Page 401 and 402:
Fidelity Funds Statement of Net Ass
- Page 403 and 404:
Fidelity Funds Statement of Net Ass
- Page 405 and 406:
Fidelity Funds Statement of Net Ass
- Page 407 and 408:
1 Fidelity Funds Notes to the Finan
- Page 409 and 410:
Fidelity Funds Notes to the Financi
- Page 411 and 412:
Fidelity Funds Notes to the Financi
- Page 413 and 414:
Fidelity Funds Notes to the Financi
- Page 415 and 416:
Fidelity Funds Notes to the Financi
- Page 417 and 418:
Fidelity Funds Notes to the Financi
- Page 419 and 420:
Fidelity Funds Notes to the Financi
- Page 421:
Fidelity, Fidelity Worldwide Invest