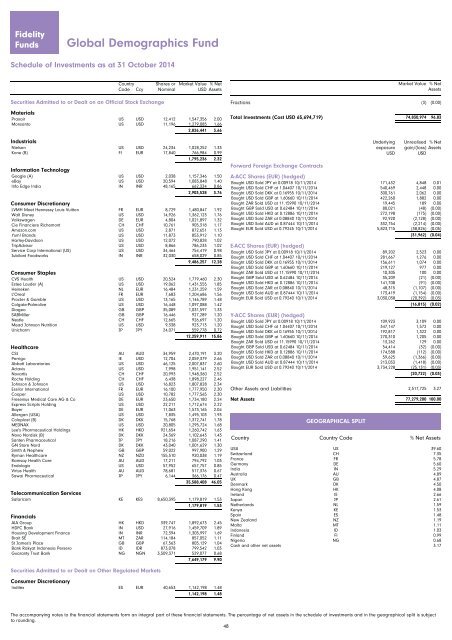
<strong>Fidelity</strong> <strong>Funds</strong> Global Demographics Fund Schedule of Investments as at 31 October 2014 Country Code Ccy Shares or Nominal Market Value USD % Net Assets Securities Admitted to or Dealt on an Official Stock Exchange Securities Admitted to or Dealt on an Official Stock Exchange Materials Praxair US USD 12,412 1,547,356 2.00 Monsanto US USD 11,196 1,279,085 1.66 2,826,441 3.66 Industrials Nielsen US USD 24,234 1,028,252 1.33 Kone (B) FI EUR 17,840 766,984 0.99 1,795,236 2.32 Information Technology Google (A) US USD 2,038 1,157,346 1.50 eBay US USD 20,594 1,083,848 1.40 Info Edge India IN INR 48,165 662,334 0.86 2,903,528 3.76 Consumer Discretionary LVMH Moet Hennessy Louis Vuitton FR EUR 8,729 1,480,847 1.92 Walt Disney US USD 14,926 1,362,123 1.76 Volkswagen DE EUR 4,804 1,021,897 1.32 Cie Financiere Richemont CH CHF 10,761 905,318 1.17 Amazon.<strong>com</strong> US USD 2,871 872,651 1.13 Yum! Brands US USD 11,873 853,912 1.10 Harley-Davidson US USD 12,072 790,828 1.02 TripAdvisor US USD 8,866 786,233 1.02 Service Corp International (US) US USD 34,464 754,419 0.98 Jubilant Foodworks IN INR 32,030 658,029 0.85 9,486,257 12.28 Consumer Staples CVS Health US USD 20,524 1,779,460 2.30 Estee Lauder (A) US USD 19,062 1,431,555 1.85 Heineken NL EUR 16,484 1,231,259 1.59 L'Oreal FR EUR 7,683 1,204,686 1.56 Procter & Gamble US USD 13,165 1,146,789 1.48 Colgate-Palmolive US USD 16,448 1,097,088 1.42 Diageo GB GBP 35,089 1,031,597 1.33 SABMiller GB GBP 16,446 927,289 1.20 Nestle CH CHF 12,665 926,697 1.20 Mead Johnson Nutrition US USD 9,338 923,713 1.20 Unicharm JP JPY 24,071 559,778 0.72 12,259,911 15.86 Healthcare CSL AU AUD 34,959 2,470,191 3.20 Perrigo IE USD 12,704 2,059,379 2.66 Abbott Laboratories US USD 46,125 2,007,837 2.60 Actavis US USD 7,998 1,951,141 2.52 Novartis CH CHF 20,993 1,948,360 2.52 Roche Holding CH CHF 6,438 1,898,227 2.46 Johnson & Johnson US USD 16,823 1,807,828 2.34 Essilor International FR EUR 16,100 1,777,950 2.30 Cooper US USD 10,782 1,777,565 2.30 Fresenius Medical Care AG & Co DE EUR 23,650 1,734,180 2.24 Express Scripts Holding US USD 22,211 1,712,674 2.22 Bayer DE EUR 11,063 1,573,165 2.04 Allergan (USA) US USD 7,835 1,495,103 1.93 Coloplast (B) DK DKK 15,768 1,372,741 1.78 MEDNAX US USD 20,805 1,295,724 1.68 Lee's Pharmaceutical Holdings HK HKD 921,654 1,260,742 1.63 Novo Nordisk (B) DK DKK 24,369 1,102,643 1.43 Santen Pharmaceutical JP JPY 18,216 1,087,290 1.41 GN Store Nord DK DKK 43,040 1,001,629 1.30 Smith & Nephew GB GBP 59,022 997,900 1.29 Ryman Healthcare NZ NZD 155,510 920,038 1.19 Ramsay Health Care AU AUD 17,211 794,792 1.03 Endologix US USD 57,952 657,757 0.85 Virtus Health AU AUD 78,681 517,376 0.67 Sawai Pharmaceutical JP JPY 6,144 366,176 0.47 35,588,408 46.05 Tele<strong>com</strong>munication Services Safari<strong>com</strong> KE KES 8,650,395 1,179,819 1.53 1,179,819 1.53 Financials AIA Group HK HKD 339,747 1,892,673 2.45 HDFC Bank IN USD 27,916 1,459,709 1.89 Housing Development Finance IN INR 72,394 1,305,997 1.69 Brait SE MT ZAR 114,184 857,052 1.11 St James's Place GB GBP 67,563 805,129 1.04 Bank Rakyat Indonesia Persero ID IDR 873,078 799,542 1.03 Guaranty Trust Bank NG NGN 3,509,371 529,077 0.68 7,649,179 9.90 Securities Admitted to or Dealt on Other Regulated Markets Securities Admitted to or Dealt on Other Regulated Markets Consumer Discretionary Inditex ES EUR 40,653 1,142,198 1.48 1,142,198 1.48 This is Dummy text to show the header ----------------- --------- Market Value % Net Assets Fractions (3) (0.00) Total Investments (Cost USD 65,694,719) 74,830,974 96.83 1 74 830 974 00 Underlying exposure USD Unrealised % Net gain/(loss) Assets USD Forward Foreign Exchange Contracts Forward Foreign Exchange Contracts A-ACC Shares (EUR) (hedged) Bought USD Sold JPY at 0.00918 10/11/2014 171,432 4,848 0.01 Bought USD Sold CHF at 1.04407 10/11/2014 540,469 2,448 0.00 Bought USD Sold DKK at 0.16955 10/11/2014 300,761 2,062 0.00 Bought USD Sold GBP at 1.60660 10/11/2014 422,260 1,882 0.00 Bought ZAR Sold USD at 11.15990 10/11/2014 19,445 189 0.00 Bought GBP Sold USD at 0.62484 10/11/2014 80,021 (48) (0.00) Bought USD Sold HKD at 0.12886 10/11/2014 272,198 (175) (0.00) Bought USD Sold ZAR at 0.08840 10/11/2014 92,920 (2,128) (0.00) Bought USD Sold AUD at 0.87444 10/11/2014 332,754 (2,214) (0.00) Bought EUR Sold USD at 0.79245 10/11/2014 5,823,715 (38,826) (0.05) (31,962) (0.04) E-ACC Shares (EUR) (hedged) Bought USD Sold JPY at 0.00918 10/11/2014 89,202 2,523 0.00 Bought USD Sold CHF at 1.04407 10/11/2014 281,667 1,276 0.00 Bought USD Sold DKK at 0.16955 10/11/2014 156,611 1,074 0.00 Bought USD Sold GBP at 1.60660 10/11/2014 219,127 977 0.00 Bought ZAR Sold USD at 11.15990 10/11/2014 10,305 100 0.00 Bought GBP Sold USD at 0.62484 10/11/2014 35,209 (21) (0.00) Bought USD Sold HKD at 0.12886 10/11/2014 141,708 (91) (0.00) Bought USD Sold ZAR at 0.08840 10/11/2014 48,315 (1,107) (0.00) Bought USD Sold AUD at 0.87444 10/11/2014 173,419 (1,154) (0.00) Bought EUR Sold USD at 0.79240 10/11/2014 3,030,038 (20,392) (0.03) (16,815) (0.02) Y-ACC Shares (EUR) (hedged) Bought USD Sold JPY at 0.00918 10/11/2014 109,923 3,109 0.00 Bought USD Sold CHF at 1.04407 10/11/2014 347,147 1,572 0.00 Bought USD Sold DKK at 0.16955 10/11/2014 192,817 1,322 0.00 Bought USD Sold GBP at 1.60660 10/11/2014 270,310 1,205 0.00 Bought ZAR Sold USD at 11.15990 10/11/2014 13,262 129 0.00 Bought GBP Sold USD at 0.62484 10/11/2014 54,414 (32) (0.00) Bought USD Sold HKD at 0.12886 10/11/2014 174,588 (112) (0.00) Bought USD Sold ZAR at 0.08840 10/11/2014 59,625 (1,366) (0.00) Bought USD Sold AUD at 0.87444 10/11/2014 213,033 (1,418) (0.00) Bought EUR Sold USD at 0.79240 10/11/2014 3,734,228 (25,131) (0.03) (20,722) (0.03) Other Assets and Liabilities 2,517,725 3.27 Net Assets 77,279,200 100.00 77 279 200 00 GEOGRAPHICAL SPLIT Country Country Code % Net Assets USA US 39.60 Switzerland CH 7.35 France FR 5.78 Germany DE 5.60 India IN 5.29 Australia AU 4.89 UK GB 4.87 Denmark DK 4.50 Hong Kong HK 4.08 Ireland IE 2.66 Japan JP 2.61 Netherlands NL 1.59 Kenya KE 1.53 Spain ES 1.48 New Zealand NZ 1.19 Malta MT 1.11 Indonesia ID 1.03 Finland FI 0.99 Nigeria NG 0.68 Cash and other net assets 3.17 The ac<strong>com</strong>panying notes to the financial statements form an integral part of these financial statements. The percentage of net assets in the schedule of investments and in the geographical split is subject to rounding. 48
<strong>Fidelity</strong> <strong>Funds</strong> Global Dividend Fund Schedule of Investments as at 31 October 2014 Country Code Ccy Shares or Nominal Market Value USD % Net Assets Securities Admitted to or Dealt on an Official Stock Exchange Securities Admitted to or Dealt on an Official Stock Exchange Energy Royal Dutch Shell (A) NL EUR 1,832,580 65,442,891 1.72 Total FR EUR 779,319 46,321,626 1.21 Statoil NO NOK 1,936,489 43,895,908 1.15 155,660,425 4.08 Utilities National Grid GB GBP 4,864,839 72,057,190 1.89 Ameren US USD 1,519,715 64,618,298 1.69 SSE GB GBP 2,361,573 60,401,480 1.58 197,076,968 5.17 Industrials Vinci FR EUR 1,081,600 61,651,904 1.62 Se<strong>com</strong> JP JPY 654,628 40,329,360 1.06 Philips NL EUR 1,388,605 38,796,782 1.02 140,778,046 3.69 Information Technology Microsoft US USD 1,706,945 79,850,870 2.09 Symantec US USD 2,087,630 51,919,362 1.36 Oracle US USD 1,284,695 50,013,195 1.31 Xilinx US USD 916,290 40,628,305 1.07 Cisco Systems US USD 1,638,931 40,055,482 1.05 Harris US USD 467,591 32,693,988 0.86 295,161,202 7.74 Consumer Discretionary Reed Elsevier GB EUR 7,131,949 164,174,681 4.30 Wolters Kluwer NL EUR 4,935,687 131,713,489 3.45 Omni<strong>com</strong> Group US USD 1,261,080 90,659,023 2.38 Comcast (A) US USD 1,553,915 85,496,389 2.24 McDonald's US USD 472,315 44,166,130 1.16 516,209,712 13.53 Consumer Staples Kimberly-Clark US USD 1,152,447 131,252,235 3.44 Reynolds American US USD 1,246,910 78,343,375 2.05 Pepsi US USD 708,944 67,874,306 1.78 Asahi Group Holdings JP JPY 1,931,766 59,920,491 1.57 Procter & Gamble US USD 665,963 58,012,077 1.52 Unilever GB EUR 1,492,514 57,891,643 1.52 CVS Health US USD 623,455 54,053,562 1.42 Dr Pepper Snapple Group US USD 590,393 40,743,031 1.07 KT&G KR KRW 141,694 12,497,851 0.33 560,588,571 14.70 Healthcare Johnson & Johnson US USD 1,445,282 155,310,047 4.07 Roche Holding CH CHF 457,200 134,807,536 3.53 Astellas Pharma JP JPY 7,131,949 110,492,167 2.90 Novartis CH CHF 1,093,408 101,480,344 2.66 GlaxoSmithKline GB GBP 3,192,846 72,393,383 1.90 Medtronic US USD 1,053,261 71,832,425 1.88 Sanofi FR EUR 741,534 68,465,167 1.79 Pfizer US USD 2,224,601 66,738,040 1.75 AbbVie US USD 845,443 53,913,899 1.41 AstraZeneca GB GBP 547,885 39,817,834 1.04 875,250,842 22.94 Tele<strong>com</strong>munication Services Telstra AU AUD 14,504,779 72,155,997 1.89 TDC DK DKK 7,816,805 59,641,430 1.56 Swiss<strong>com</strong> CH CHF 90,684 53,392,545 1.40 KDDI JP JPY 722,641 48,163,784 1.26 Vodafone Group GB GBP 11,807,863 39,153,304 1.03 SK Tele<strong>com</strong> KR KRW 43,925 10,961,507 0.29 283,468,567 7.43 Financials HSBC Holdings (UK) GB GBP 7,084,718 72,470,443 1.90 US Bancorp US USD 1,577,530 67,108,146 1.76 Muenchener Rueckversicherungs-Gesellschaft DE EUR 321,174 63,143,949 1.66 RSA Insurance Group GB GBP 8,076,578 62,436,998 1.64 BB&T US USD 1,421,667 53,966,467 1.41 SCOR SE FR EUR 1,629,485 49,918,163 1.31 Deutsche Boerse DE EUR 562,054 38,402,672 1.01 407,446,838 10.68 Securities Admitted to or Dealt on Other Regulated Markets Securities Admitted to or Dealt on Other Regulated Markets Energy Repsol ES EUR 1,228,018 27,421,896 0.72 27,421,896 0.72 Utilities Gas Natural SDG ES EUR 1,785,349 51,492,825 1.35 51,492,825 1.35 This is Dummy text to show the header ----------------- --------- Market Value % Net Assets Fractions 1 0.00 Total Investments (Cost USD 3,252,133,793) 3,510,555,893 92.03 1 3 510 555 893 0 Underlying exposure USD Unrealised % Net gain/(loss) Assets USD Forward Foreign Exchange Contracts Forward Foreign Exchange Contracts A-ACC Shares (EUR) (hedged) Bought USD Sold JPY at 0.00918 10/11/2014 8,952,480 253,171 0.01 Bought USD Sold NOK at 0.15410 10/11/2014 1,959,397 79,015 0.00 Bought USD Sold GBP at 1.60660 10/11/2014 15,941,917 71,065 0.00 Bought USD Sold CHF at 1.04407 10/11/2014 11,342,566 51,372 0.00 Bought USD Sold JPY at 0.00925 10/11/2014 1,006,106 36,698 0.00 Bought USD Sold DKK at 0.16955 10/11/2014 2,322,057 15,921 0.00 Bought USD Sold GBP at 1.61445 10/11/2014 785,340 7,355 0.00 Bought USD Sold CHF at 1.05827 10/11/2014 342,990 6,239 0.00 Bought USD Sold AUD at 0.88931 10/11/2014 270,253 2,765 0.00 Bought USD Sold DKK at 0.17143 10/11/2014 121,584 2,189 0.00 Bought NOK Sold USD at 6.65602 10/11/2014 136,117 (1,916) (0.00) Bought USD Sold AUD at 0.87444 10/11/2014 2,634,744 (17,533) (0.00) Bought EUR Sold USD at 0.78340 10/11/2014 7,632,074 (137,415) (0.00) Bought EUR Sold USD at 0.79233 10/11/2014 110,085,410 (750,388) (0.02) (381,462) (0.01) A-ACC Shares (HUF) (hedged) Bought USD Sold JPY at 0.00918 10/11/2014 508,173 14,345 0.00 Bought USD Sold EUR at 1.26190 10/11/2014 1,782,473 11,950 0.00 Bought USD Sold NOK at 0.15410 10/11/2014 99,688 4,020 0.00 Bought USD Sold GBP at 1.60660 10/11/2014 810,931 3,615 0.00 Bought USD Sold CHF at 1.04407 10/11/2014 576,846 2,613 0.00 Bought USD Sold DKK at 0.16955 10/11/2014 118,216 811 0.00 Bought USD Sold GBP at 1.60140 10/11/2014 43,186 52 0.00 Bought USD Sold DKK at 0.16945 10/11/2014 6,736 42 0.00 Bought USD Sold AUD at 0.88087 10/11/2014 13,205 8 0.00 Bought USD Sold AUD at 0.87444 10/11/2014 133,806 (890) (0.00) Bought HUF Sold USD at 244.53000 10/11/2014 351,425 (1,972) (0.00) Bought HUF Sold USD at 245.04310 10/11/2014 7,419,401 (26,154) (0.00) 8,440 0.00 A-HMDIST (G) Shares (AUD) (hedged) Bought AUD Sold USD at 1.14384 10/11/2014 26,963,619 186,656 0.00 Bought USD Sold JPY at 0.00918 10/11/2014 1,694,496 47,919 0.00 Bought USD Sold EUR at 1.26208 10/11/2014 6,628,492 45,382 0.00 Bought USD Sold NOK at 0.15410 10/11/2014 370,905 14,957 0.00 Bought USD Sold GBP at 1.60660 10/11/2014 3,016,600 13,447 0.00 Bought USD Sold CHF at 1.04407 10/11/2014 2,147,323 9,726 0.00 Bought USD Sold DKK at 0.16955 10/11/2014 439,522 3,014 0.00 Bought NOK Sold USD at 6.54534 10/11/2014 68,446 (2,086) (0.00) Bought CHF Sold USD at 0.94156 10/11/2014 230,469 (4,927) (0.00) Bought EUR Sold USD at 0.78019 10/11/2014 798,521 (17,592) (0.00) 296,496 0.01 A-HMDIST (G) Shares (RMB) (hedged) Bought CNY Sold USD at 6.17800 10/11/2014 3,436,711 27,604 0.00 Bought USD Sold JPY at 0.00918 10/11/2014 211,481 5,981 0.00 Bought USD Sold EUR at 1.26190 10/11/2014 827,308 5,547 0.00 Bought USD Sold NOK at 0.15410 10/11/2014 46,215 1,864 0.00 Bought USD Sold GBP at 1.60660 10/11/2014 375,875 1,676 0.00 Bought USD Sold CHF at 1.04407 10/11/2014 268,156 1,215 0.00 Bought USD Sold EUR at 1.26464 10/11/2014 42,619 379 0.00 Bought USD Sold DKK at 0.16955 10/11/2014 54,898 376 0.00 Bought USD Sold CHF at 1.04810 10/11/2014 16,630 140 0.00 Bought USD Sold NOK at 0.15190 10/11/2014 2,518 64 0.00 Bought USD Sold AUD at 0.87676 10/11/2014 3,521 (14) (0.00) Bought NOK Sold USD at 6.54534 10/11/2014 7,333 (223) (0.00) Bought USD Sold AUD at 0.87444 10/11/2014 62,501 (416) (0.00) Bought CHF Sold USD at 0.94156 10/11/2014 21,241 (454) (0.00) Bought EUR Sold USD at 0.78019 10/11/2014 78,186 (1,723) (0.00) 42,016 0.00 A-MINCOME (G) Shares (AUD) (hedged) Bought AUD Sold USD at 1.14384 10/11/2014 83,712,060 579,497 0.02 Bought USD Sold JPY at 0.00918 10/11/2014 5,260,751 148,771 0.00 Bought USD Sold EUR at 1.26208 10/11/2014 20,577,407 140,882 0.00 Bought USD Sold NOK at 0.15410 10/11/2014 1,151,375 46,430 0.00 Bought USD Sold GBP at 1.60660 10/11/2014 9,368,096 41,760 0.00 Bought USD Sold CHF at 1.04407 10/11/2014 6,665,433 30,189 0.00 Bought USD Sold JPY at 0.00925 10/11/2014 580,128 21,160 0.00 Bought USD Sold DKK at 0.16955 10/11/2014 1,364,539 9,356 0.00 Bought USD Sold GBP at 1.61445 10/11/2014 443,053 4,149 0.00 Bought USD Sold CHF at 1.05827 10/11/2014 188,125 3,422 0.00 Bought USD Sold DKK at 0.17143 10/11/2014 68,707 1,237 0.00 Bought NOK Sold USD at 6.65602 10/11/2014 82,031 (1,155) (0.00) Bought EUR Sold USD at 0.78340 10/11/2014 316,567 (5,700) (0.00) Bought AUD Sold USD at 1.12447 10/11/2014 3,793,796 (38,428) (0.00) 981,570 0.03 E-MINCOME (G) Shares (EUR) (hedged) Bought USD Sold JPY at 0.00918 10/11/2014 5,752,640 162,681 0.00 The ac<strong>com</strong>panying notes to the financial statements form an integral part of these financial statements. The percentage of net assets in the schedule of investments and in the geographical split is subject to rounding. 49
- Page 1 and 2: Fidelity Funds Société d’invest
- Page 3 and 4: Fidelity Funds Contents Introductio
- Page 5 and 6: Fidelity Funds Directors and Superv
- Page 7 and 8: Fidelity Funds Investment Manager
- Page 9 and 10: Fidelity Funds America Fund Schedu
- Page 11 and 12: Fidelity Funds American Diversified
- Page 13 and 14: Fidelity Funds American Growth Fund
- Page 15 and 16: Fidelity Funds Asia Pacific Dividen
- Page 17 and 18: Fidelity Funds Asia Pacific Propert
- Page 19 and 20: Fidelity Funds Asian Equity Fund 1,
- Page 21 and 22: Fidelity Funds Asian Smaller Compan
- Page 23 and 24: Fidelity Funds Asian Special Situat
- Page 25 and 26: Fidelity Funds China Consumer Fund
- Page 27 and 28: Fidelity Funds China Focus Fund Sc
- Page 29 and 30: Fidelity Funds Emerging Asia Fund
- Page 31 and 32: Fidelity Funds Emerging Markets Foc
- Page 33 and 34: Fidelity Funds Emerging Markets Fun
- Page 35 and 36: Fidelity Funds EURO STOXX 50 Fund 2
- Page 37 and 38: Fidelity Funds European Dividend Fu
- Page 39 and 40: Fidelity Funds European Dynamic Gro
- Page 41 and 42: Fidelity Funds European Growth Fund
- Page 43 and 44: Fidelity Funds European Smaller Com
- Page 45 and 46: Fidelity Funds European Smaller Com
- Page 47 and 48: Fidelity Funds France Fund Schedul
- Page 49: Fidelity Funds Global Consumer Indu
- Page 53 and 54: Fidelity Funds Global Equity Income
- Page 55 and 56: Fidelity Funds Global Focus Fund S
- Page 57 and 58: Fidelity Funds Global Industrials F
- Page 59 and 60: Fidelity Funds Global Property Fund
- Page 61 and 62: Fidelity Funds Global Real Asset Se
- Page 63 and 64: Fidelity Funds Global Telecommunica
- Page 65 and 66: Fidelity Funds Greater China Fund -
- Page 67 and 68: Fidelity Funds Greater China Fund I
- Page 69 and 70: Fidelity Funds India Focus Fund 7
- Page 71 and 72: Fidelity Funds International Fund
- Page 73 and 74: Fidelity Funds International Fund -
- Page 75 and 76: Fidelity Funds International Fund -
- Page 77 and 78: Fidelity Funds International Fund -
- Page 79 and 80: Fidelity Funds Japan Advantage Fund
- Page 81 and 82: Fidelity Funds Japan Fund Schedule
- Page 83 and 84: Fidelity Funds Japan Smaller Compan
- Page 85 and 86: Fidelity Funds Latin America Fund
- Page 87 and 88: Fidelity Funds Nordic Fund Schedul
- Page 89 and 90: Fidelity Funds Pacific Fund - conti
- Page 91 and 92: Fidelity Funds South East Asia Fund
- Page 93 and 94: Fidelity Funds Switzerland Fund Sc
- Page 95 and 96: Fidelity Funds Thailand Fund Sched
- Page 97 and 98: Fidelity Funds World Fund Schedule
- Page 99 and 100: Fidelity Funds Fidelity Patrimoine
- Page 101 and 102:
Fidelity Funds Fidelity Patrimoine
- Page 103 and 104:
Fidelity Funds Fidelity Patrimoine
- Page 105 and 106:
Fidelity Funds Fidelity Patrimoine
- Page 107 and 108:
Fidelity Funds Fidelity Patrimoine
- Page 109 and 110:
Fidelity Funds Fidelity Sélection
- Page 111 and 112:
Fidelity Funds Fidelity Sélection
- Page 113 and 114:
Fidelity Funds Fidelity Sélection
- Page 115 and 116:
Fidelity Funds Fidelity Sélection
- Page 117 and 118:
Fidelity Funds Fidelity Sélection
- Page 119 and 120:
Fidelity Funds FPS Global Growth Fu
- Page 121 and 122:
Fidelity Funds FPS Global Growth Fu
- Page 123 and 124:
Fidelity Funds FPS Global Growth Fu
- Page 125 and 126:
Fidelity Funds FPS Growth Fund 4 S
- Page 127 and 128:
Fidelity Funds FPS Growth Fund 4 -
- Page 129 and 130:
Fidelity Funds FPS Growth Fund 4 -
- Page 131 and 132:
Fidelity Funds FPS Moderate Growth
- Page 133 and 134:
Fidelity Funds FPS Moderate Growth
- Page 135 and 136:
Fidelity Funds FPS Moderate Growth
- Page 137 and 138:
Fidelity Funds Euro Balanced Fund
- Page 139 and 140:
Fidelity Funds Global Multi Asset I
- Page 141 and 142:
Fidelity Funds Global Multi Asset I
- Page 143 and 144:
Fidelity Funds Global Multi Asset I
- Page 145 and 146:
Fidelity Funds Global Multi Asset I
- Page 147 and 148:
Fidelity Funds Global Multi Asset I
- Page 149 and 150:
Fidelity Funds Global Multi Asset I
- Page 151 and 152:
Fidelity Funds Global Multi Asset I
- Page 153 and 154:
Fidelity Funds Growth & Income Fund
- Page 155 and 156:
Fidelity Funds Growth & Income Fund
- Page 157 and 158:
Fidelity Funds Growth & Income Fund
- Page 159 and 160:
Fidelity Funds Growth & Income Fund
- Page 161 and 162:
Fidelity Funds Multi Asset Strategi
- Page 163 and 164:
Fidelity Funds Multi Asset Strategi
- Page 165 and 166:
Fidelity Funds Multi Asset Strategi
- Page 167 and 168:
Fidelity Funds Multi Asset Strategi
- Page 169 and 170:
Fidelity Funds Multi Asset Strategi
- Page 171 and 172:
Fidelity Funds Multi Asset Strategi
- Page 173 and 174:
Fidelity Funds Multi Asset Strategi
- Page 175 and 176:
Fidelity Funds Multi Asset Strategi
- Page 177 and 178:
Fidelity Funds Asian Bond Fund - co
- Page 179 and 180:
Fidelity Funds Asian High Yield Fun
- Page 181 and 182:
Fidelity Funds China RMB Bond Fund
- Page 183 and 184:
Fidelity Funds Core Euro Bond Fund
- Page 185 and 186:
Fidelity Funds Emerging Market Corp
- Page 187 and 188:
Fidelity Funds Emerging Market Debt
- Page 189 and 190:
Fidelity Funds Emerging Market Loca
- Page 191 and 192:
Fidelity Funds Emerging Markets Inf
- Page 193 and 194:
Fidelity Funds Euro Bond Fund - con
- Page 195 and 196:
Fidelity Funds Euro Corporate Bond
- Page 197 and 198:
Fidelity Funds European High Yield
- Page 199 and 200:
Fidelity Funds European High Yield
- Page 201 and 202:
Fidelity Funds Global Corporate Bon
- Page 203 and 204:
Fidelity Funds Global Corporate Bon
- Page 205 and 206:
Fidelity Funds Global High Yield Fu
- Page 207 and 208:
Fidelity Funds Global High Yield Fu
- Page 209 and 210:
Fidelity Funds Global Income Fund -
- Page 211 and 212:
Fidelity Funds Global Income Fund -
- Page 213 and 214:
Fidelity Funds Global Inflation-lin
- Page 215 and 216:
Fidelity Funds Global Strategic Bon
- Page 217 and 218:
Fidelity Funds Global Strategic Bon
- Page 219 and 220:
Fidelity Funds Global Strategic Bon
- Page 221 and 222:
Fidelity Funds Global Strategic Bon
- Page 223 and 224:
Fidelity Funds Global Strategic Bon
- Page 225 and 226:
Fidelity Funds International Bond F
- Page 227 and 228:
Fidelity Funds Sterling Bond Fund
- Page 229 and 230:
Fidelity Funds US Dollar Bond Fund
- Page 231 and 232:
Fidelity Funds US High Yield Fund
- Page 233 and 234:
Fidelity Funds US High Yield Fund -
- Page 235 and 236:
Fidelity Funds Fixed Term 2018 Fund
- Page 237 and 238:
Fidelity Funds Euro Cash Fund Sche
- Page 239 and 240:
Fidelity Funds MoneyBuilder Europe
- Page 241 and 242:
Fidelity Funds MoneyBuilder Europe
- Page 243 and 244:
Fidelity Funds MoneyBuilder Europea
- Page 245 and 246:
Fidelity Funds MoneyBuilder Europea
- Page 247 and 248:
Fidelity Funds MoneyBuilder Global
- Page 249 and 250:
Fidelity Funds MoneyBuilder Global
- Page 251 and 252:
Fidelity Funds MoneyBuilder Global
- Page 253 and 254:
Fidelity Funds MoneyBuilder Global
- Page 255 and 256:
Fidelity Funds Fidelity Target 2020
- Page 257 and 258:
Fidelity Funds Fidelity Target 2020
- Page 259 and 260:
Fidelity Funds Fidelity Target 2020
- Page 261 and 262:
Fidelity Funds Fidelity Target 2020
- Page 263 and 264:
Fidelity Funds Fidelity Target 2020
- Page 265 and 266:
Fidelity Funds Fidelity Target 2020
- Page 267 and 268:
Fidelity Funds Fidelity Target 2015
- Page 269 and 270:
Fidelity Funds Fidelity Target 2015
- Page 271 and 272:
Fidelity Funds Fidelity Target 2015
- Page 273 and 274:
Fidelity Funds Fidelity Target 2020
- Page 275 and 276:
Fidelity Funds Fidelity Target 2020
- Page 277 and 278:
Fidelity Funds Fidelity Target 2020
- Page 279 and 280:
Fidelity Funds Fidelity Target 2020
- Page 281 and 282:
Fidelity Funds Fidelity Target 2025
- Page 283 and 284:
Fidelity Funds Fidelity Target 2025
- Page 285 and 286:
Fidelity Funds Fidelity Target 2025
- Page 287 and 288:
Fidelity Funds Fidelity Target 2025
- Page 289 and 290:
Fidelity Funds Fidelity Target 2025
- Page 291 and 292:
Fidelity Funds Fidelity Target 2030
- Page 293 and 294:
Fidelity Funds Fidelity Target 2030
- Page 295 and 296:
Fidelity Funds Fidelity Target 2030
- Page 297 and 298:
Fidelity Funds Fidelity Target 2030
- Page 299 and 300:
Fidelity Funds Fidelity Target 2035
- Page 301 and 302:
Fidelity Funds Fidelity Target 2035
- Page 303 and 304:
Fidelity Funds Fidelity Target 2035
- Page 305 and 306:
Fidelity Funds Fidelity Target 2040
- Page 307 and 308:
Fidelity Funds Fidelity Target 2040
- Page 309 and 310:
Fidelity Funds Fidelity Target 2040
- Page 311 and 312:
Fidelity Funds Fidelity Target 2045
- Page 313 and 314:
Fidelity Funds Fidelity Target 2045
- Page 315 and 316:
Fidelity Funds Fidelity Target 2045
- Page 317 and 318:
Fidelity Funds Fidelity Target 2050
- Page 319 and 320:
Fidelity Funds Fidelity Target 2050
- Page 321 and 322:
Fidelity Funds FAWF Asian Special S
- Page 323 and 324:
Fidelity Funds FAWF Diversified Sto
- Page 325 and 326:
Fidelity Funds FAWF Emerging Market
- Page 327 and 328:
Fidelity Funds FAWF Equity Income F
- Page 329 and 330:
Fidelity Funds FAWF International F
- Page 331 and 332:
Fidelity Funds FAWF International F
- Page 333 and 334:
Fidelity Funds FAWF International F
- Page 335 and 336:
Fidelity Funds FAWF International F
- Page 337 and 338:
Fidelity Funds FAWF Pacific Fund 1,
- Page 339 and 340:
Fidelity Funds FAWF Limited Term Bo
- Page 341 and 342:
Fidelity Funds FAWF Limited Term Bo
- Page 343 and 344:
Fidelity Funds FAWF US Dollar Bond
- Page 345 and 346:
Fidelity Funds FAWF US High Income
- Page 347 and 348:
Fidelity Funds FAWF US High Income
- Page 349 and 350:
Fidelity Funds Institutional Americ
- Page 351 and 352:
Fidelity Funds Institutional Asia P
- Page 353 and 354:
Fidelity Funds Institutional Euro B
- Page 355 and 356:
Fidelity Funds Institutional Europe
- Page 357 and 358:
Fidelity Funds Institutional Global
- Page 359 and 360:
Fidelity Funds Institutional Global
- Page 361 and 362:
Fidelity Funds Institutional Japan
- Page 363 and 364:
Fidelity Funds Institutional Europe
- Page 365 and 366:
This page has been left blank inten
- Page 367 and 368:
Asia Pacific Dividend Fund Asia Pac
- Page 369 and 370:
Emerging Markets Fund Euro Blue Chi
- Page 371 and 372:
Global Consumer Industries Fund Glo
- Page 373 and 374:
Greater China Fund Greater China Fu
- Page 375 and 376:
Malaysia Fund Nordic Fund Pacific F
- Page 377 and 378:
Balanced Funds: FPS Global Growth F
- Page 379 and 380:
Emerging Market Debt Fund Emerging
- Page 381 and 382:
International Bond Fund Sterling Bo
- Page 383 and 384:
Reserved Equity Funds: Fidelity Tar
- Page 385 and 386:
Reserved Bond Funds: Institutional
- Page 387 and 388:
Institutional Global Sector Fund 4,
- Page 389 and 390:
Fidelity Funds Statement of Net Ass
- Page 391 and 392:
Fidelity Funds Statement of Net Ass
- Page 393 and 394:
Fidelity Funds Statement of Net Ass
- Page 395 and 396:
Fidelity Funds Statement of Net Ass
- Page 397 and 398:
Fidelity Funds Statement of Net Ass
- Page 399 and 400:
Fidelity Funds Statement of Net Ass
- Page 401 and 402:
Fidelity Funds Statement of Net Ass
- Page 403 and 404:
Fidelity Funds Statement of Net Ass
- Page 405 and 406:
Fidelity Funds Statement of Net Ass
- Page 407 and 408:
1 Fidelity Funds Notes to the Finan
- Page 409 and 410:
Fidelity Funds Notes to the Financi
- Page 411 and 412:
Fidelity Funds Notes to the Financi
- Page 413 and 414:
Fidelity Funds Notes to the Financi
- Page 415 and 416:
Fidelity Funds Notes to the Financi
- Page 417 and 418:
Fidelity Funds Notes to the Financi
- Page 419 and 420:
Fidelity Funds Notes to the Financi
- Page 421:
Fidelity, Fidelity Worldwide Invest